
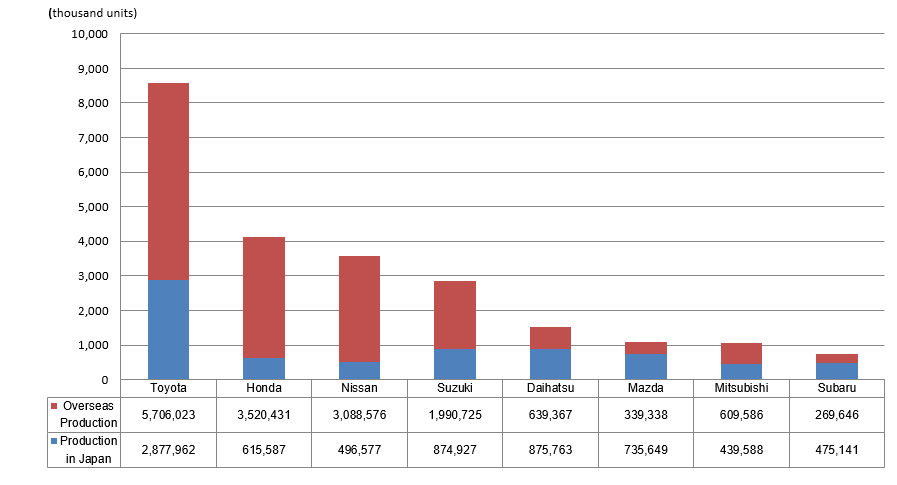
2021 global production volume by Japanese OEMs
| Global Production |
Production in Japan | Overseas Production |
||||||
|---|---|---|---|---|---|---|---|---|
| Total | Pct.chg. | Total | Pct.chg. | PCs | CVs | Total | Pct.chg. | |
| Toyota |
8,583,985
|
8.5%
|
2,877,962
|
-1.5%
|
-
|
-
|
5,706,023
|
14.4%
|
| Honda |
4,136,018
|
-6.0%
|
615,587
|
-15.6%
|
-
|
-
|
3,520,431
|
-4.1%
|
| Nissan |
3,585,153
|
-1.2%
|
496,577
|
-2.5%
|
425,946
|
70,631
|
3,088,576
|
-1.0%
|
| Suzuki |
2,865,652
|
11.1%
|
874,927
|
-5.8%
|
-
|
-
|
1,990,725
|
20.6%
|
| Daihatsu |
1,515,130
|
8.6%
|
875,763
|
-3.8%
|
-
|
-
|
639,367
|
32.1%
|
| Mazda |
1,074,987
|
-8.5%
|
735,649
|
-1.5%
|
735,649
|
0
|
339,338
|
-20.7%
|
| Mitsubishi |
1,049,174
|
22.8%
|
439,588
|
10.7%
|
-
|
-
|
609,586
|
33.4%
|
| Subaru |
744,787
|
-15.8%
|
475,141
|
-16.7%
|
-
|
-
|
269,646
|
-14.3%
|
| Total |
23,554,886
|
3.2%
|
7,391,194
|
-4.2%
|
-
|
-
|
16,163,692
|
7.0%
|
Note:
- Mark "-" in the table denotes "No production" or "No detailed information available."
- The year-over-year ratio of the 8 automakers' total production volume was calculated by MarkLines using the total 2020 figure obtained from each automaker's press releases.