
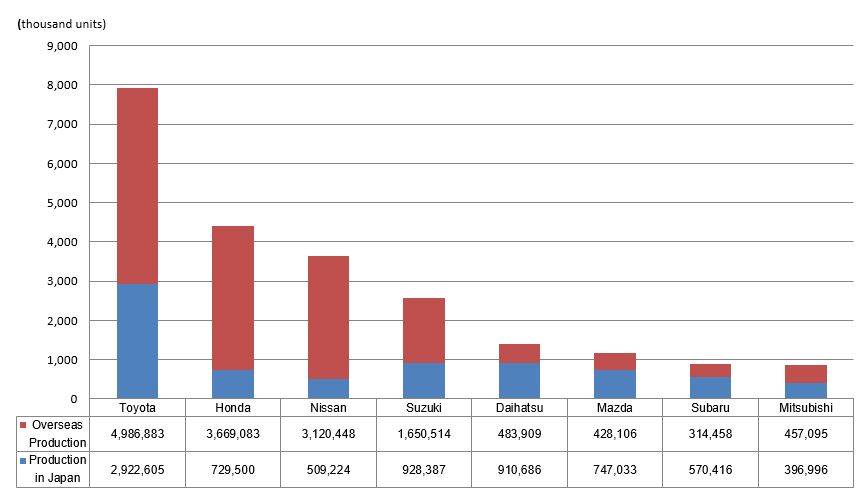
| Global Production |
Production in Japan | Overseas Production |
||||||
|---|---|---|---|---|---|---|---|---|
| Total | Pct.chg. | Total | Pct.chg. | PCs | CVs | Total | Pct.chg. | |
| Toyota | 7,909,488 | -12.6% | 2,922,605 | -14.4% | - | - | 4,986,883 | -11.5% |
| Honda | 4,398,583 | -14.9% | 729,500 | -13.5% | - | - | 3,669,083 | -15.2% |
| Nissan | 3,629,672 | -26.8% | 509,224 | -37.0% | 428,017 | 81,207 | 3,120,448 | -24.8% |
| Suzuki | 2,578,901 | -15.5% | 928,387 | -1.9% | - | - | 1,650,514 | -21.7% |
| Daihatsu | 1,394,595 | -18.9% | 910,686 | -4.5% | - | - | 483,909 | -36.8% |
| Mazda | 1,175,139 | -21.0% | 747,033 | -26.1% | 740,378 | 6,655 | 428,106 | -10.4% |
| Subaru | 884,874 | -10.4% | 570,416 | -7.8% | - | - | 314,458 | -14.7% |
| Mitsubishi | 854,091 | -37.6% | 396,996 | -35.9% | - | - | 457,095 | -39.0% |
| Total | 22,825,343 | -17.2% | 7,714,847 | -16.3% | - | - | 15,110,496 | -17.6% |
Source: Compiled from domestic and overseas production figures published in press releases by each automaker. (As of Jan. 28, 2021)
Note:
- Mark "-" in the table denotes "No production" or "No detailed information available."
- The year-over-year ratio of the 8 automakers' total production volume was calculated by MarkLines using the total 2019 figure obtained from each automaker's press releases.