
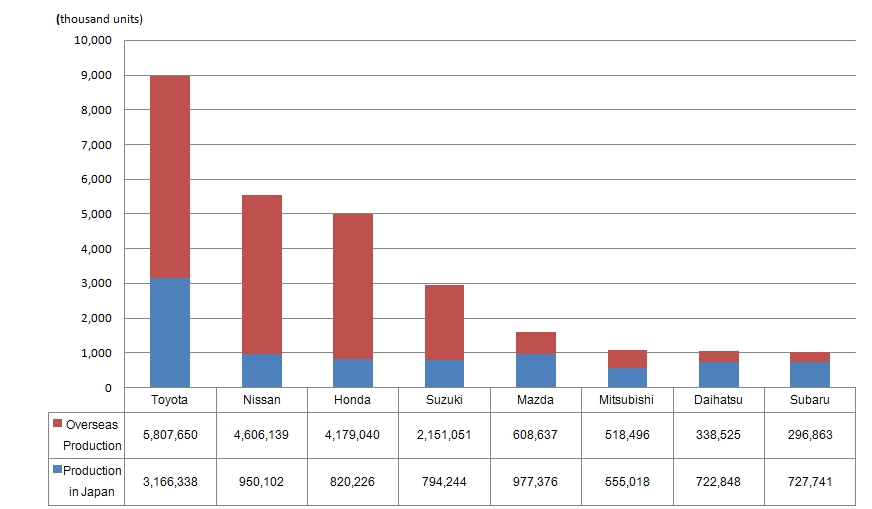
2016 global production volume by Japanese OEMs (Preliminary)
| Global Production |
Production in Japan | Overseas Production |
||||||
|---|---|---|---|---|---|---|---|---|
| Total | Pct.chg. | Total | Pct.chg. | PCs | CVs | Total | Pct.chg. | |
| Toyota | 8,973,988 | 0.5% | 3,166,338 | -0.7% | 2,847,367 | 318,971 | 5,807,650 | 1.2% |
| Nissan | 5,556,241 | 7.5% | 950,102 | 8.9% | 835,058 | 115,044 | 4,606,139 | 7.2% |
| Honda | 4,999,266 | 10.0% | 820,226 | 12.3% | - | - | 4,179,040 | 9.6% |
| Suzuki | 2,945,295 | -2.9% | 794,244 | -15.3% | - | - | 2,151,051 | 2.6% |
| Mazda | 1,586,013 | 2.9% | 977,376 | 0.5% | 967,510 | 9,866 | 608,637 | 7.1% |
| Mitsubishi | 1,073,514 | -11.9% | 555,018 | -12.7% | - | - | 518,496 | -11.1% |
| Daihatsu | 1,061,373 | 8.3% | 722,848 | 3.7% | 562,323 | 160,525 | 338,525 | 19.9% |
| Subaru | 1,024,604 | 9.2% | 727,741 | 2.5% | - | - | 296,863 | 29.7% |
| Total | 27,220,294 | 3.3% | 8,713,893 | -0.3% | - | - | 18,506,401 | 5.1% |
Note:
- Mark "-" in the table denotes "No production" or "No detailed information available."
- The year-over-year ratio of the 8 automakers' total production volume was calculated by MarkLines using the total 2015 figure obtained from each automaker's press releases.