
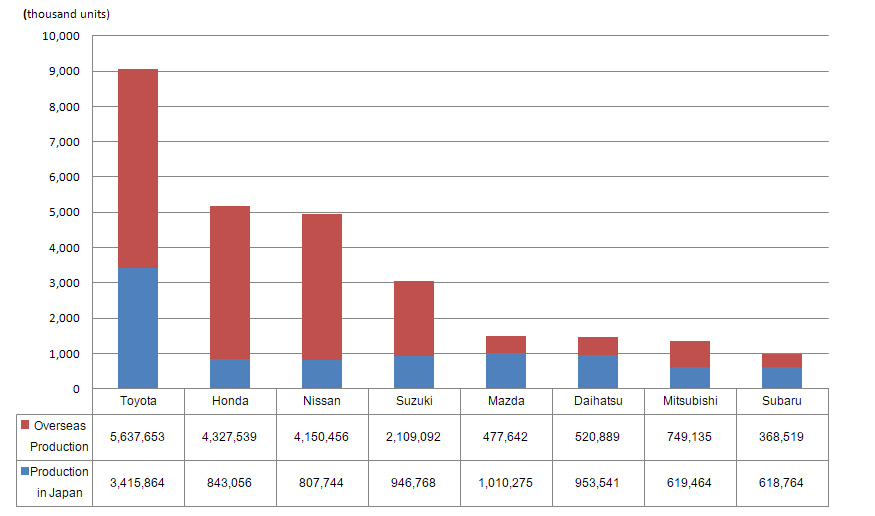
| Global Production |
Production in Japan | Overseas Production |
||||||
|---|---|---|---|---|---|---|---|---|
| Total | Pct.chg. | Total | Pct.chg. | PCs | CVs | Total | Pct.chg. | |
| Toyota |
9,053,517
|
1.9%
|
3,415,864 |
8.8%
|
-
|
-
|
5,637,653
|
-1.9%
|
| Honda |
5,170,595
|
-3.5%
|
843,056 |
-5.4%
|
-
|
-
|
4,327,539
|
-3.1%
|
| Nissan |
4,958,200
|
-9.6%
|
807,744 |
-13.2%
|
708,820
|
98,924
|
4,150,456
|
-8.9%
|
| Suzuki |
3,055,860
|
-11.1%
|
946.768 |
-6.6%
|
-
|
-
|
2,109,092
|
-12.9%
|
| Mazda |
1,487,917
|
-6.8%
|
1,010,275 |
1.4%
|
1,000,085
|
10,190
|
477,642
|
-20.5%
|
| Daihatsu |
1,474,430
|
0.4%
|
953,541 |
2.4%
|
-
|
-
|
520,889
|
-3.1%
|
| Mitsubishi |
1,368,599
|
-5.9%
|
619,464 |
-8.4%
|
-
|
-
|
749,135
|
-3.8%
|
| Subaru |
987,283
|
-3.1%
|
618,764 |
-6.2%
|
-
|
-
|
368,519
|
2.5%
|
| Total | 27,556,401 | -4.0% |
9,215,476
|
-0.2% |
-
|
-
|
18,340,925
|
-5.8%
|
Source: Compiled from domestic and overseas production figures published in press releases by each automaker. (As of Jan. 30, 2020)
Note:
- Mark "-" in the table denotes "No production" or "No detailed information available."
- The year-over-year ratio of the 8 automakers' total production volume was calculated by MarkLines using the total 2018 figure obtained from each automaker's press releases.