
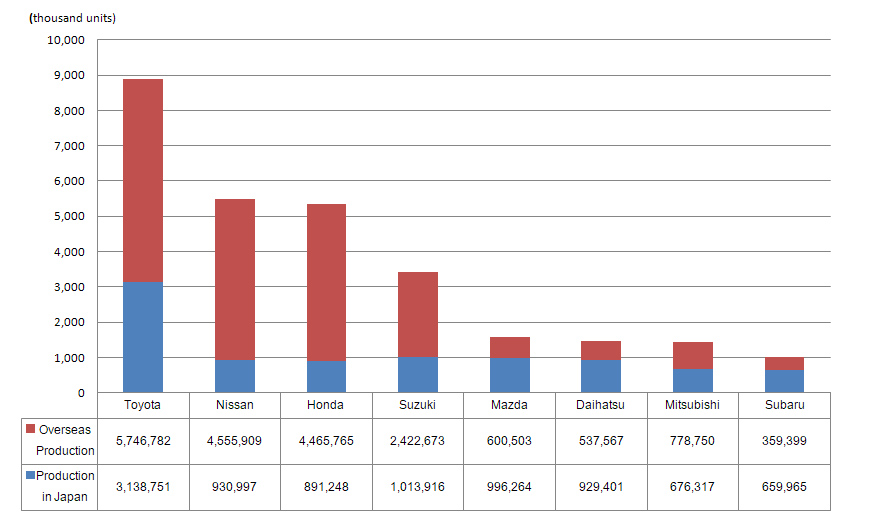
2018 global production volume by Japanese OEMs (Preliminary)
| Global Production |
Production in Japan | Overseas Production |
||||||
|---|---|---|---|---|---|---|---|---|
| Total | Pct.chg. | Total | Pct.chg. | PCs | CVs | Total | Pct.chg. | |
| Toyota |
8,885,533
|
-1.4%
|
3,138,751
|
-1.6%
|
2,825,147
|
313,604
|
5,746,782
|
-1.2%
|
| Nissan |
5,486,906
|
-4.9%
|
930,997
|
-8.7%
|
823,515
|
107,482
|
4,555,909
|
-4.1%
|
| Honda |
5,357,013
|
2.3%
|
891,248
|
9.0%
|
-
|
-
|
4,465,765
|
1.1%
|
| Suzuki |
3,436,589
|
4.1%
|
1,013,916
|
2.7%
|
-
|
-
|
2,422,673
|
4.7%
|
| Mazda |
1,596,767
|
-0.7%
|
996,264
|
2.6%
|
984,291
|
11,973
|
600,503
|
-5.6%
|
| Daihatsu |
1,466,968
|
16.1%
|
929,401
|
1.1%
|
756,745
|
172,656
|
537,567
|
56.3%
|
| Mitsubishi |
1,455,067
|
20.2%
|
676,317
|
16.7%
|
-
|
-
|
778,750
|
23.4%
|
| Subaru |
1,019,364
|
-5.0%
|
659,965
|
-7.0%
|
-
|
-
|
359,399
|
-1.1%
|
| Total |
28,704,207
|
0.8%
|
9,236,859
|
0.5%
|
-
|
-
|
19,467,348
|
1.0%
|
Source: Compiled from domestic and overseas production figures published in press releases by each automaker. (As of Feb. 1, 2019)
Note:
- Mark "-" in the table denotes "No production" or "No detailed information available."
- The year-over-year ratio of the 8 automakers' total production volume was calculated by MarkLines using the total 2017 figure obtained from each automaker's press releases.