
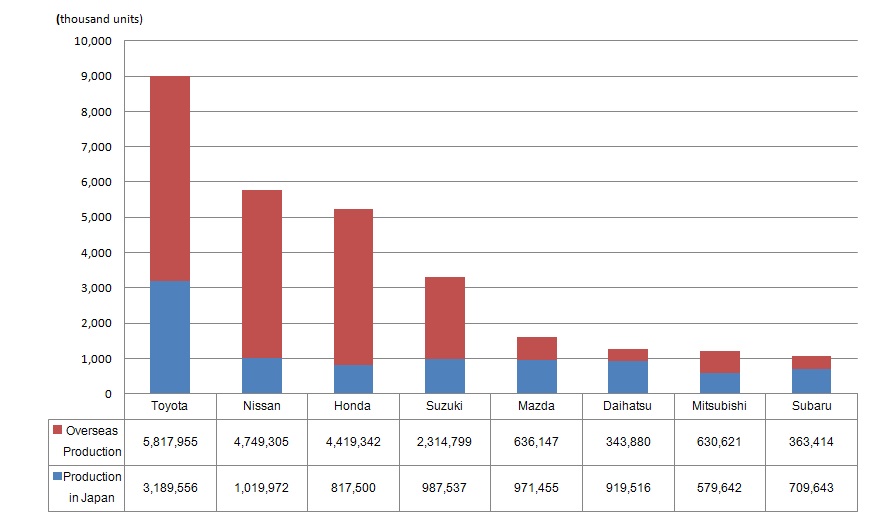
2017 global production volume by Japanese OEMs (Preliminary)
| Global Production |
Production in Japan | Overseas Production |
||||||
|---|---|---|---|---|---|---|---|---|
| Total | Pct.chg. | Total | Pct.chg. | PCs | CVs | Total | Pct.chg. | |
| Toyota | 9,007,511 | 0.4% | 3,189,556 | 0.7% | 2,869,600 | 319,956 | 5,817,955 | 0.2% |
| Nissan | 5,769,277 | 3.8% | 1,019,972 | 7.4% | 921,505 | 98,467 | 4,749,305 | 3.1% |
| Honda | 5,236,842 | 4.8% | 817,500 | -0.3% | - | - | 4,419,342 | 5.8% |
| Suzuki | 3,302,336 | 12.1% | 987,537 | 24.3% | - | - | 2,314,799 | 7.6% |
| Mazda | 1,607,602 | 1.4% | 971,455 | -0.6% | 961,039 | 10,416 | 636,147 | 4.5% |
| Daihatsu | 1,263,396 | 19.0% | 919,516 | 27.2% | 749,828 | 169,688 | 343,880 | 1.6% |
| Mitsubishi | 1,210,263 | 10.9% | 579,642 | 4.4% | - | - | 630,621 | 17.5% |
| Subaru | 1,073,057 | 4.7% | 709,643 | -2.5% | - | - | 363,414 | 22.4% |
| Total | 28,470,284 | 4.6% | 9,194,821 | 5.5% | - | - | 19,275,463 | 4.2% |
Note:
- Mark "-" in the table denotes "No production" or "No detailed information available."
- The year-over-year ratio of the 8 automakers' total production volume was calculated by MarkLines using the total 2016 figure obtained from each automaker's press releases.