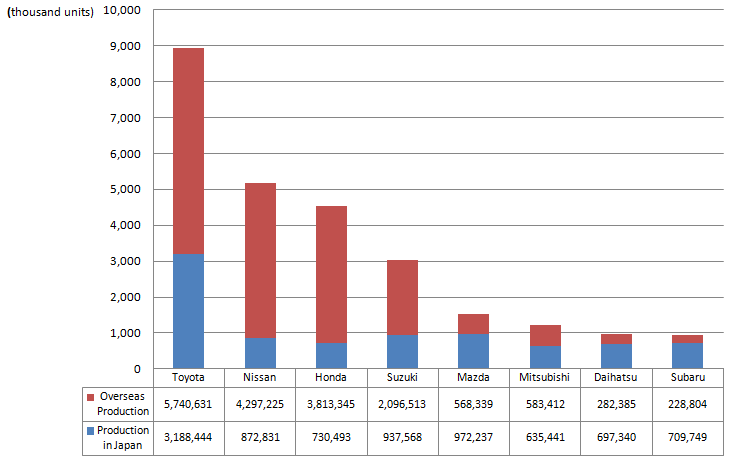
2015 global production volume by Japanese OEMs (Preliminary)

| Global Production |
Production in Japan | Overseas Production |
||||||
|---|---|---|---|---|---|---|---|---|
| Total | Pct.chg. | Total | Pct.chg. | PCs | CVs | Total | Pct.chg. | |
| Toyota | 8,929,075 | -0.8% | 3,188,444 | -2.4% | 2,827,349 | 361,095 | 5,740,631 | 0.1% |
| Nissan | 5,170,056 | 1.4% | 872,831 | -0.9% | 755,742 | 117,089 | 4,297,225 | 1.9% |
| Honda | 4,543,838 | 0.7% | 730,493 | -23.8% | - | - | 3,813,345 | 7.2% |
| Suzuki | 3,034,081 | 0.6% | 937,568 | -11.5% | - | - | 2,096,513 | 7.1% |
| Mazda* | 1,540,576 | 16.0% | 972,237 | 4.1% | 955,961 | 16,276 | 568,339 | 44.2% |
| Mitubishi | 1,218,853 | -3.4% | 635,441 | -0.9% | - | - | 583,412 | -6.1% |
| Daihatsu | 979,725 | -10.8% | 697,340 | -10.8% | 530,784 | 166,556 | 282,385 | -10.7% |
| Subaru | 938,553 | 5.6% | 709,749 | 2.0% | - | - | 228,804 | 18.5% |
| Total* | 26,354,757 | 0.5% | 8,744,103 | -5.1% | - | - | 17,610,654 | 3.6% |
Source: Compiled from domestic and overseas production figures published in press releases by each automaker.
(As of Jan. 27, 2016)
Note:
- Mark "-" in the table denotes "No production" or "No detailed information available."
- The year-over-year ratio of the 8 automakers' total production volume was calculated by MarkLines using the total 2014 figure obtained from each automaker's press releases.
*The figures for Mazda were revised. Because of this, there has been a change to the total given for the 8 companies. (Feb. 29, 2016)


