
 AI Navigator


Search Results by Category
 AI Navigator
All information related to {{ key_word }}.
AI Navigation will guide you. Click here for information about {{ key_word }}.
Images
 1
1
Jameel Motors and GAC form joint venture to launch electric vehicles in UK
 4
4
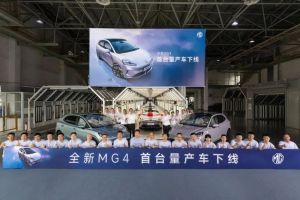
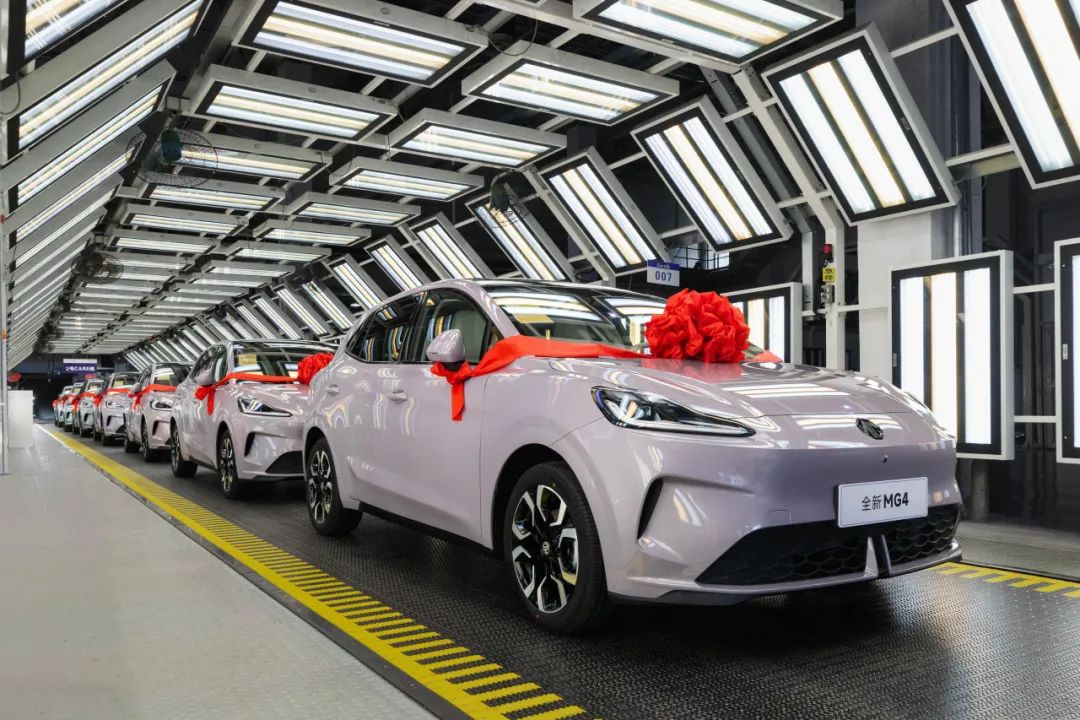
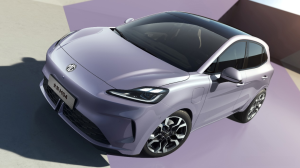
MG4 EV hatchback rolls off production line, with launch in August
 1
1
Stellantis plans to produce 5,000 Fiat 500 Hybrid at Mirafiori plant from November 2025
 5
5
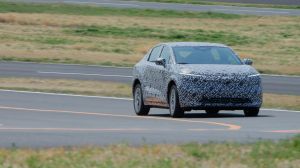
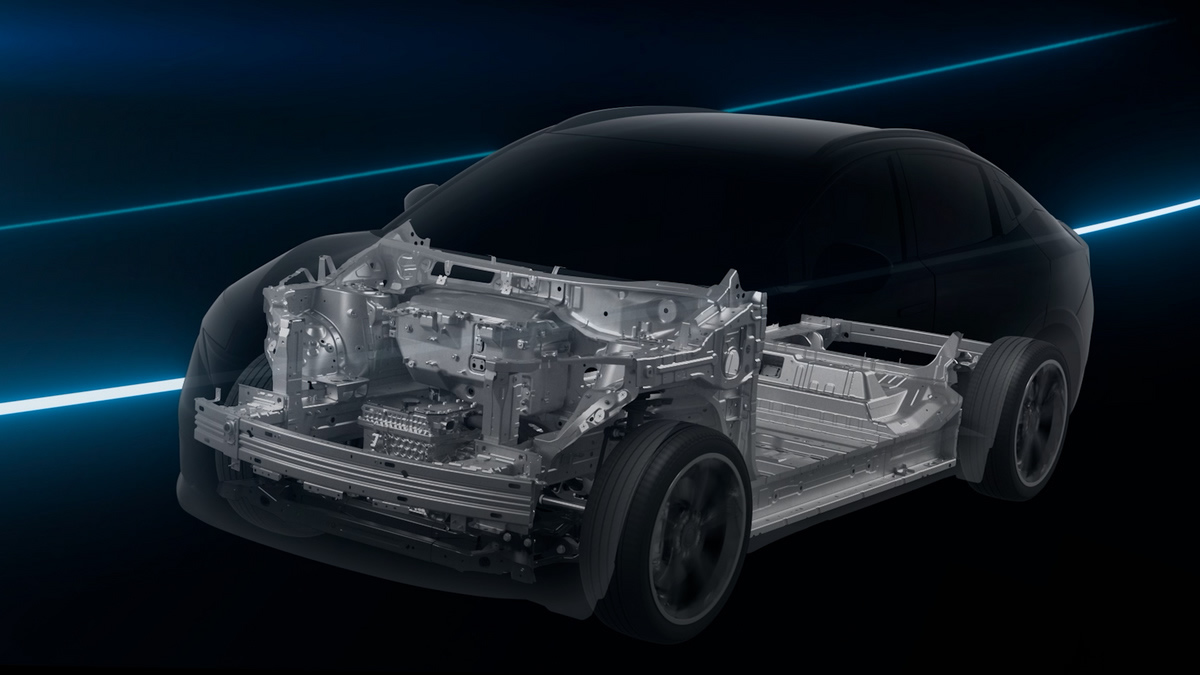
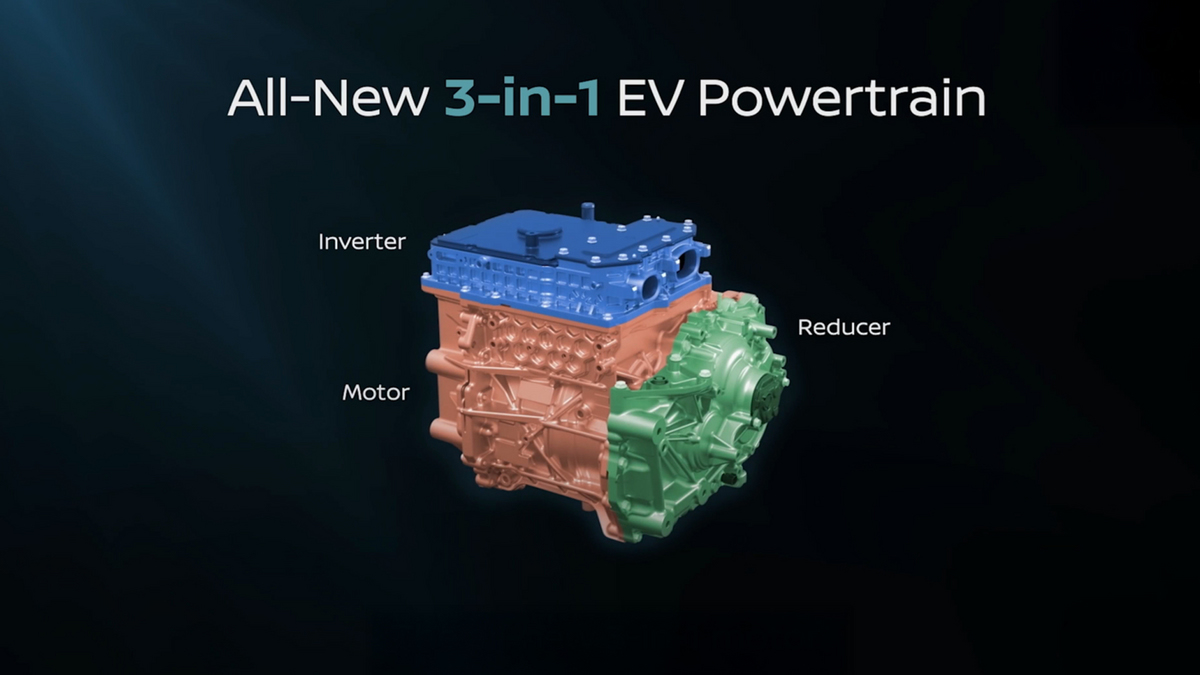
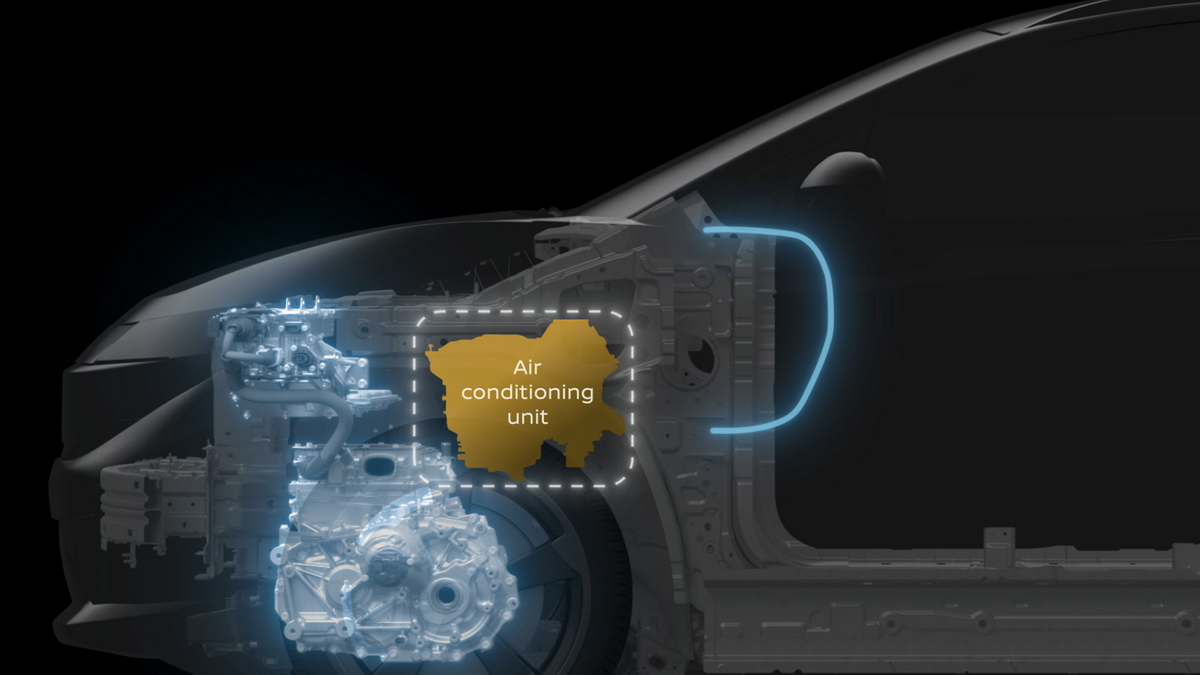
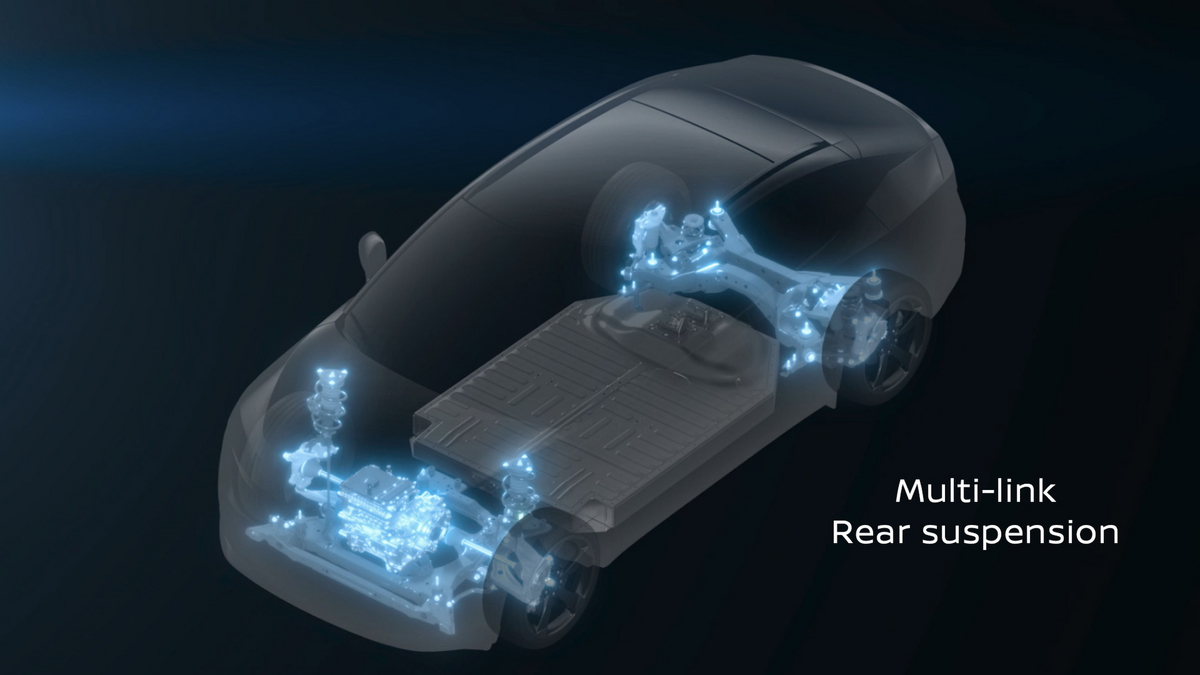
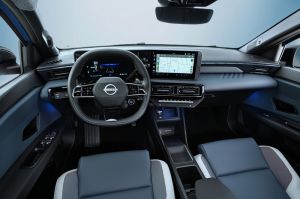
Nissan releases 2nd video of all-new Nissan Leaf, adopting new 3-in-1 powertrain
 1
1
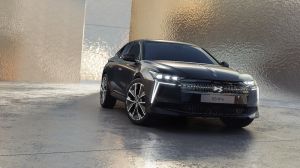
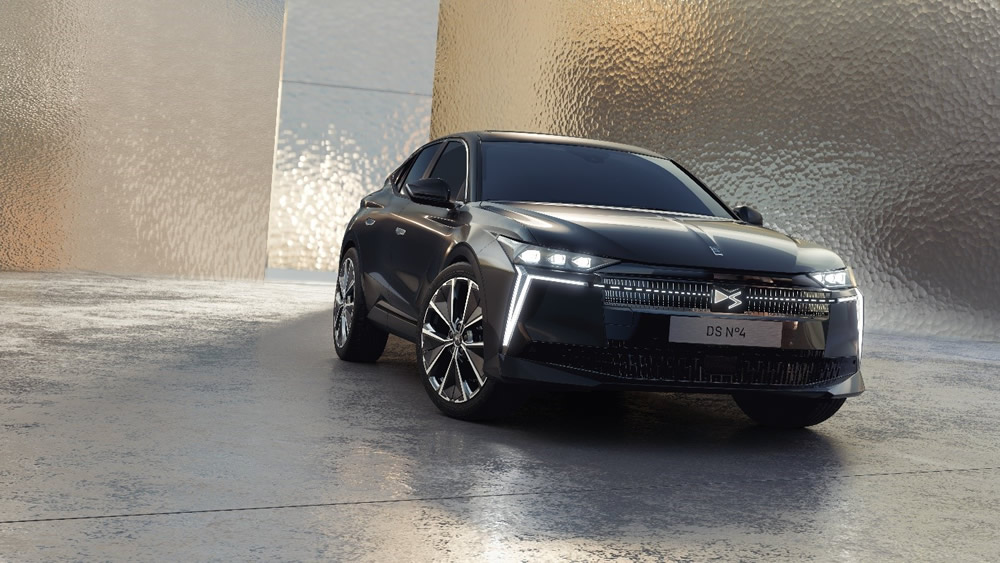
DS Automobile opens orders for DS N°4 in France
 3
3
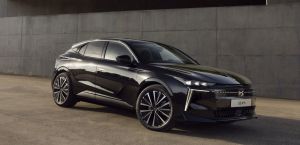
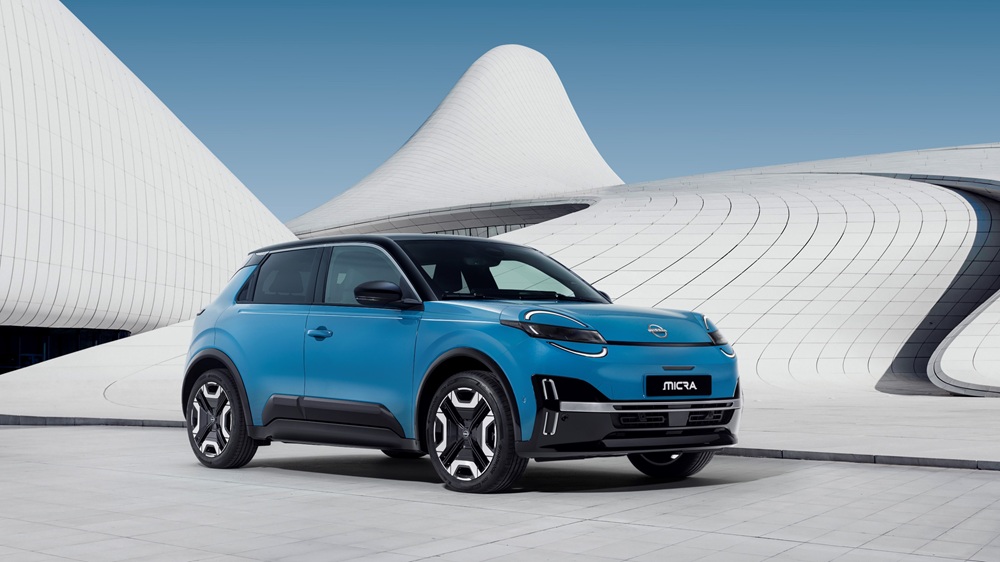
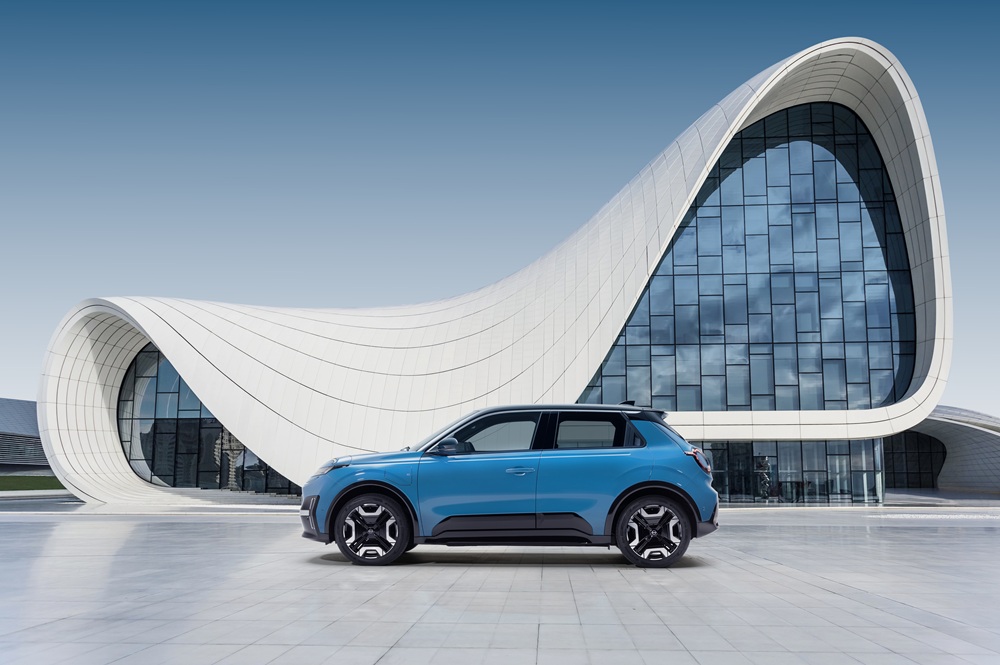
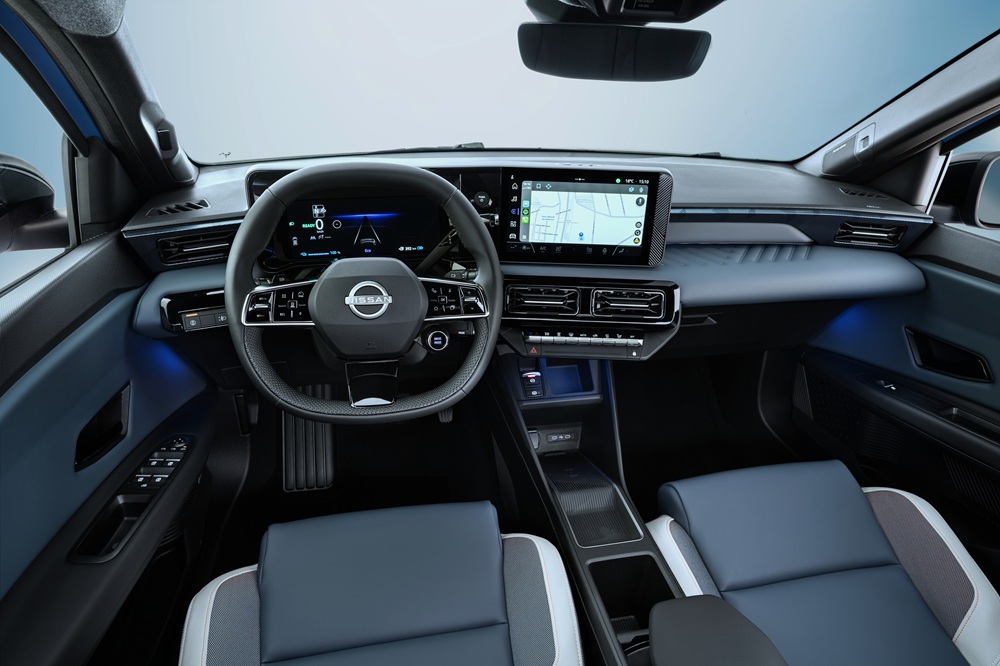
Nissan unveils all-new electric Micra B segment hatchback with two battery options in Europe
 1
1
Stellantis introduces DS N°4 premium compact hatchback
 2
2
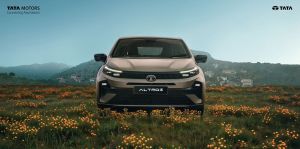
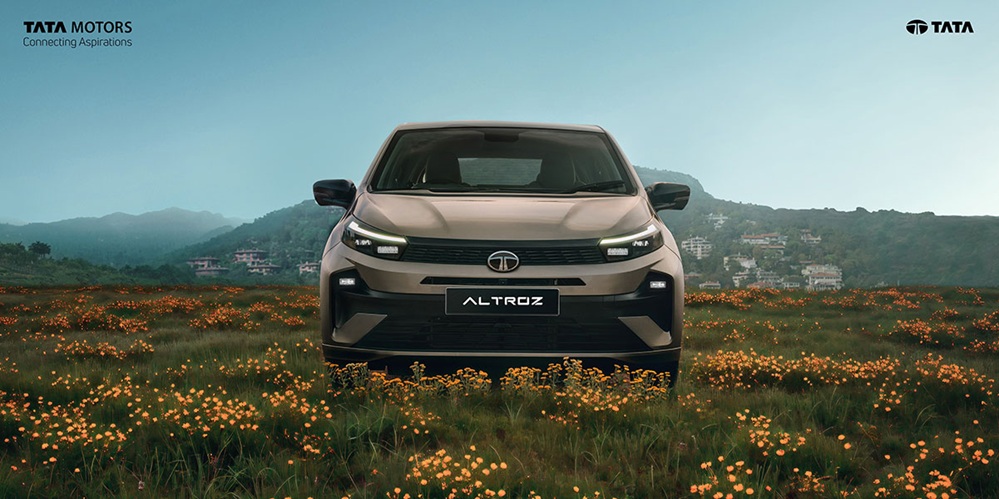
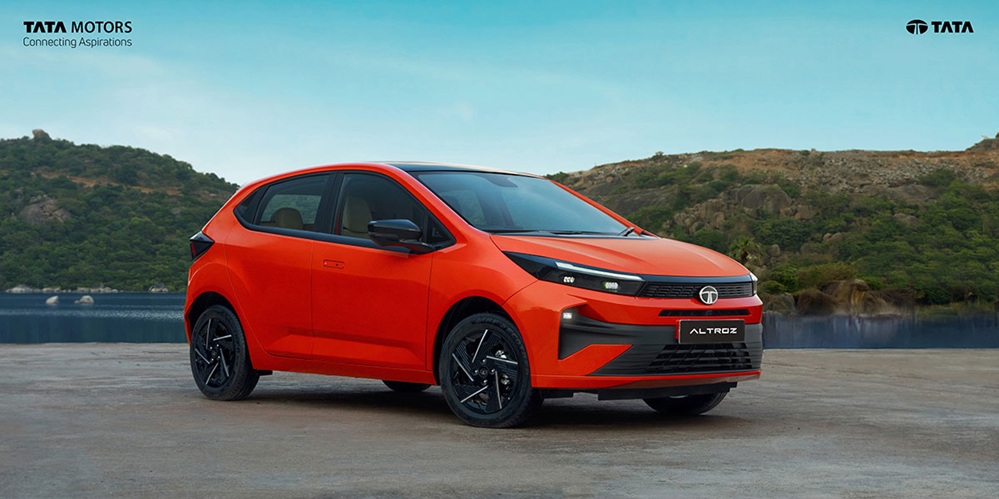
Tata Motors, India introduces new Altroz hatchback with enhanced features
 1
1
MAS 2025: Proton debuts its second EV model in Malaysia, showcases futuristic experiences
 1
1
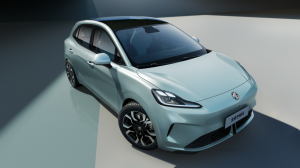
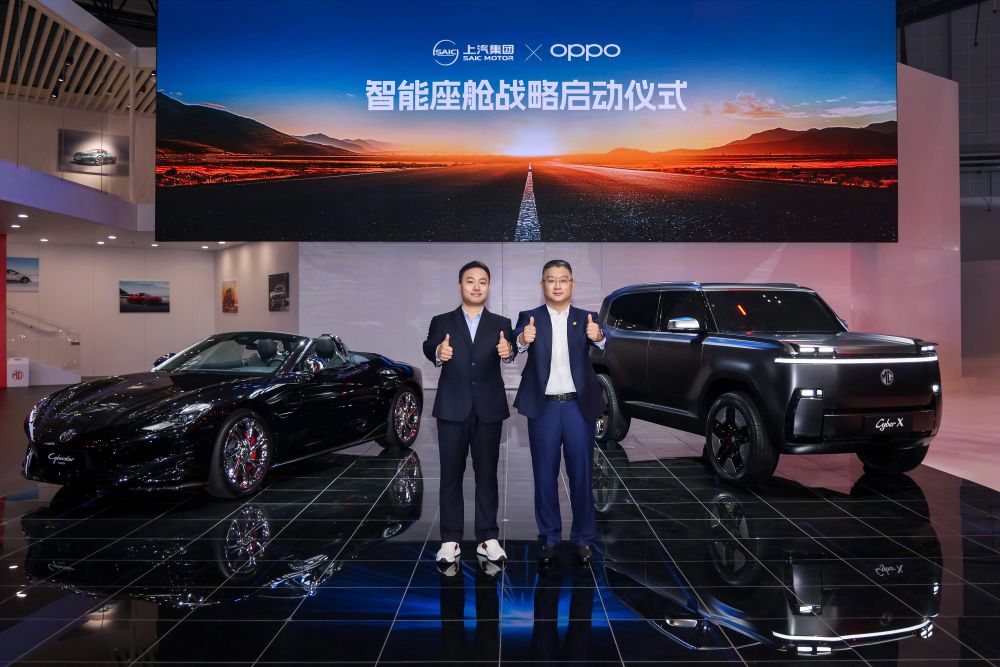
MG4 EV hatchback to feature intelligent cockpit developed by SAIC Motor, OPPO
Sort by :
1 - 14 of 14 results
Data changes for Sales Statistics
y, the total sales volume in Finland has also been corrected. June 24, 2016 Canada Sales data of Ford F-Series for 2015 have been revised. June 15, 2016 Poland The vehicle model classification criteria used by the source for Polish market data changed from Jan. 2016, and some vehicles including hatchbacks, wagons, vans, and SUVs that were previously classified as commercial vehicles are now included in the passenger vehicle category. As a res...
Automotive Sales Data Updated at: 2025/07/16
China - Flash report, Automotive sales volume ranking, 2025 (By maker, model, vehicle type)
s totaled 2.581 million units, up 10.3% y/y; CV exports totaled 501,000 units, up 10.5% y/y; and NEV exports totaled 1.06 million units, up 75.2% y/y. New vehicle sales by type (Factory shipments) Jun. 2025 Jan.-Jun. 2025 Units(10,000) Share(%) Y-o-Y(%) Units(10,000) Share(%) Y-o-Y(%) Sedan/Hatchback 104.8 36.1 10.7 566.7 36.2 11.2 MPV 10.6 3.7 17.8 57.6 3.7 26.3 SUV 135.4 46.6 17.5 711.1 45.4 12.8 Mini Van 2.7 0.9 3.8 17.8 1.1 47.5...
Automotive Sales Data Updated at: 2025/07/14
China - Flash report, Automotive sales volume ranking, 2024 (By maker, model, vehicle type)
ts totaled 4.955 million units, up 19.7% y/y; CV exports totaled 904,000 units, up 17.5% y/y; and NEV exports totaled 1.284 million units, up 6.7% y/y.New vehicle sales by type (Factory shipments) Dec. 2024 Jan.-Dec. 2024 Units(10,000) Share(%) Y-o-Y(%) Units(10,000) Share(%) Y-o-Y(%) Sedan/Hatchback 125.2 35.9 0.9 1,151.7 36.6 0.2 MPV 13.5 3.9 13.4 105.0 3.3 -4.8 SUV 169.6 48.6 20.5 1,472.2 46.8 11.5 Mini Van 3.6 1.0 44.0 27.4 0.9 ...
Automotive Sales Data Updated at: 2025/07/02
China - Flash report, Automotive sales volume, 2023
xports totaled 4.14 million units, up 63.7% y/y; CV exports totaled 770,000 units, up 32.2% y/y; NEV exports totaled 1.203 million units, up 77.6% y/y.New vehicle sales by type (Factory shipments) Dec. 2023 Jan.-Dec. 2023 Units(10,000) Share(%) Y-o-Y(%) Units(10,000) Share(%) Y-o-Y(%) Sedan/Hatchback 124.1 39.3 17.0 1,149.0 38.2 3.4 MPV 11.9 3.8 19.0 110.2 3.7 17.7 SUV 140.7 44.6 31.5 1,320.6 43.9 18.0 Mini Van 2.5 0.8 -26.5 26.5 0....
Automotive Sales Data Updated at: 2025/06/04
Representative models for each segment
Representative models for each segment Home Representative models for each segment Representative models for each segment These are typical models included in each segment. (Refer to sales volume in 2024) Segment Representative models North America Europe China Japan Other Sedan/Hatchback A (Basic) Fiat Mobi, JAC E10X, Chevrolet Spark Fiat Panda, Hyundai i10, Kia Morning BYD Seagull, Wuling Hongguang MINIEV, Changan Lumin Honda N-B...
Automotive Sales Data Updated at: 2025/03/27
China - Flash report, Automotive sales volume, 2022
Cumulative commercial vehicle exports were 582,000 units, up 44.9% y/y. Cumulative NEV exports were 679,000 units, reflecting an increase of 120% y/y.New vehicle sales by type (Factory shipments) Dec. 2022 Jan.-Dec. 2022 Units(10,000) Share(%) Y-o-Y(%) Units(10,000) Share(%) Y-o-Y(%) Sedan/Hatchback 106.1 41.5 -5.8 1,111.6 41.4 11.5 MPV 10.0 3.9 -11.5 93.7 3.5 -11.2 SUV 107.0 41.9 -6.2 1,118.7 41.6 10.8 Mini Van 3.4 1.3 -17.1 32.3 ...
Automotive Sales Data Updated at: 2023/02/07
China - Flash report, Automotive sales volume, 2021
ve passenger vehicle exports were 1.614 million units, up by 110% y/y, while cumulative commercial vehicle exports were 402,000 units, up by 70.7% y/y.New vehicle sales by type (Factory shipments) Dec. 2021 Jan.-Dec. 2021 Units(10,000) Share(%) Y-o-Y(%) Units(10,000) Share(%) Y-o-Y(%) Sedan/Hatchback 112.6 40.4 7.5 993.4 37.8 7.1 MPV 11.3 4.1 -20.8 105.5 4.0 0.1 SUV 114.1 41.0 0.3 1,010.1 38.4 6.8 Mini Van 4.1 1.5 -11.8 39.1 1.5 0.8...
Automotive Sales Data Updated at: 2022/02/25
China - Flash report, Sales volume, 2020
le exports totaled 29,000 units, reflecting a 2.5% y/y increase. YTD vehicle exports from January to December totaled 995,000 units, down by 2.9% y/y. New vehicle sales by type (Factory shipments) Dec. 2020 Jan.-Dec. 2020 Units(10,000) Share(%) Y-o-Y(%) Units(10,000) Share(%) Y-o-Y(%) Sedan/Hatchback 104.7 37.0 2.3 927.5 36.6 -9.9 MPV 14.3 5.0 -3.2 105.4 4.2 -23.8 SUV 113.8 40.2 14.2 946.1 37.4 0.7 Mini Van 4.7 1.7 -1.8 38.8 1.5 -2....
Automotive Sales Data Updated at: 2021/08/04
China - Flash report, Sales volume, 2019
enger car exports totaled 725,000 units, reflecting a 4.3% y/y decline. Commercial vehicle exports totaled 299,000 units, reflecting a 5.7% y/y increase.New vehicle sales by type (Factory shipments) Dec. 2019 Jan.-Dec. 2019 Units(10,000) Share(%) Y-oY(%) Units(10,000) Share(%) Y-oY(%) Sedan/Hatchback 102.6 38.6 -0.4 1,030.8 40.0 -10.7 MPV 14.8 5.6 -16.1 138.4 5.4 -20.2 SUV 99.1 37.3 1.2 935.3 36.3 -6.3 Mini Van 4.8 1.8 1.7 40.0 1.6 ...
Automotive Sales Data Updated at: 2020/05/12
China - Flash report, Sales volume, 2018
cles (for about 1% y/y increase). After balancing imports and exports in 2019, the annual demand of China’s automotive market will be 28,200,000 units.New vehicle sales by type (Factory shipments) Dec. 2018 Jan.-Dec. 2018 Units(10,000) Share(%) Y-oY(%) Units(10,000) Share(%) Y-oY(%) Sedan/Hatchback 102.85 38.64 -14.30 1,152.78 41.05 -2.70 MPV 17.62 6.62 -22.85 173.46 6.18 -16.22 SUV 98.16 36.88 -16.32 999.47 35.59 -2.52 Mini Van 4...
Automotive Sales Data Updated at: 2019/01/31
China - Flash report, Sales volume, 2017
er vehicles and 1% for commercial vehicles.(*) Based on the revised CAAM press release, the sales and production of commercial EVs have been modified. New vehicle sales by type (Factory shipments) Dec. 2017 Jan.-Dec. 2017 Units(10,000) Share(%) Y-oY(%) Units(10,000) Share(%) Y-oY(%) * Sedan/Hatchback 120.00 39.21 -4.35 1,184.80 41.03 -2.48 MPV 22.83 7.46 -15.98 207.07 7.17 -17.05 SUV 117.30 38.33 8.40 1,025.27 35.50 13.32 Mini Van 5...
Automotive Sales Data Updated at: 2018/07/24
China - Flash report, Sales volume, 2016
5% y/y) and 231,000 commercial vehicles (down 23.1% y/y) shipped overseas. CAAM forecasts that approximately 29.40 million vehicles will be sold in 2017.New vehicle sales by type (Factory shipments) Dec. 2016 Jan.-Dec. 2016 Units(10,000) Share(%) Y-oY(%) Units(10,000) Share(%) Y-oY(%) Sedan/Hatchback 125.46 41.04 -2.27 1214.99 43.35 3.44 MPV 27.17 8.89 -0.51 249.65 8.91 18.38 SUV 108.21 35.39 35.61 904.70 32.28 44.59 Mini Van 6....
Automotive Sales Data Updated at: 2017/01/18
India - Flash report, Sales volume, 2016
6.5% to 17,324 units. M&HCVs were up 22.0% to 23,515 units and LCVs were up 14.0% to 30,320 units.By automaker sales, Maruti-Suzuki was up 16.2%. Hyundai was up 9.7%. Mahindra reported growth of 15.6%. Tata was up 10.0% and Renault was up 210.6%.Maruti-Suzuki sales were helped by demand for premium hatchback Baleno and all-new compact SUV Vitara Brezza. Renault rode on the success of small car Kwid with sales increasing more than threefold. By ty...
Automotive Sales Data Updated at: 2017/01/11
China - Flash report, Sales volume, 2015
s*(Units(10,000)) 2015 Total 2450.33 3.3% 2459.76 4.7% PC 2107.94 5.8% 2114.63 7.3% CV 342.39 -10.0% 345.13 -9.0% Source:CAAM*Factory shipmentsNew vehicle sales by type (Factory shipments) Dec. 2015 Jan.-Dec. 2015 Units(10,000) Share(%) Y-oY(%) Units(10,000) Share(%) Y-oY(%) Sedan/Hatchback 128.09 46.0 1.3 1,172.02 47.6 -5.3 MPV 27.27 9.8 27.1 210.67 8.6 10.1 SUV 79.40 28.5 60.7 622.03 25.3 52.4 Mini Van 9.46 3.4 2.9 109.9...
Automotive Sales Data Updated at: 2016/07/06


 Japan
Japan USA
USA Mexico
 Germany
 China (Shanghai)
 Thailand
 India
India