
 AI Navigator


Search Results by Category
 AI Navigator
All information related to {{ key_word }}.
AI Navigation will guide you. Click here for information about {{ key_word }}.
Images
 2
2
SmartBar
 3
3
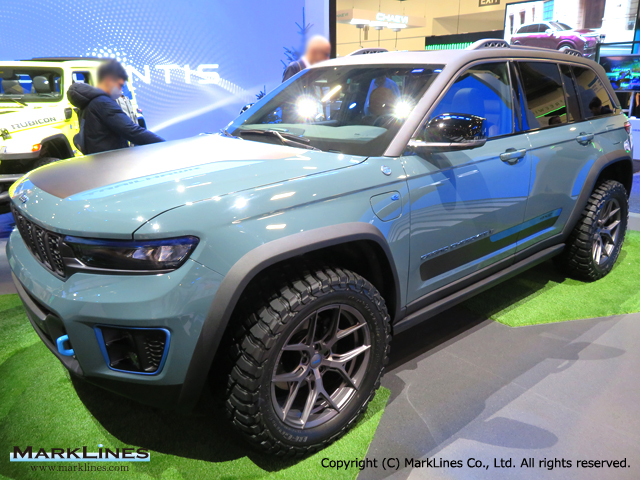
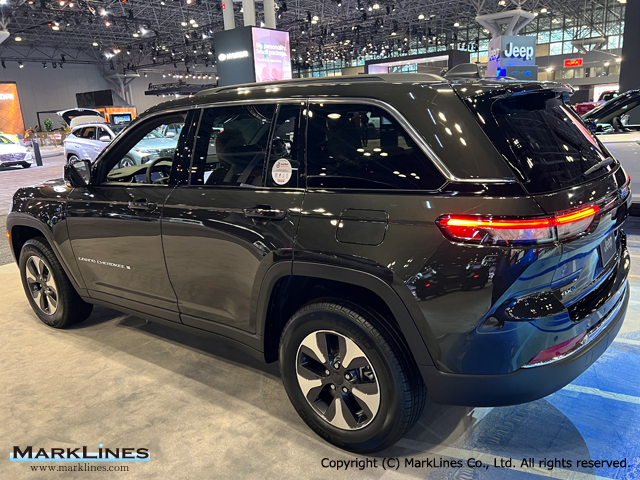
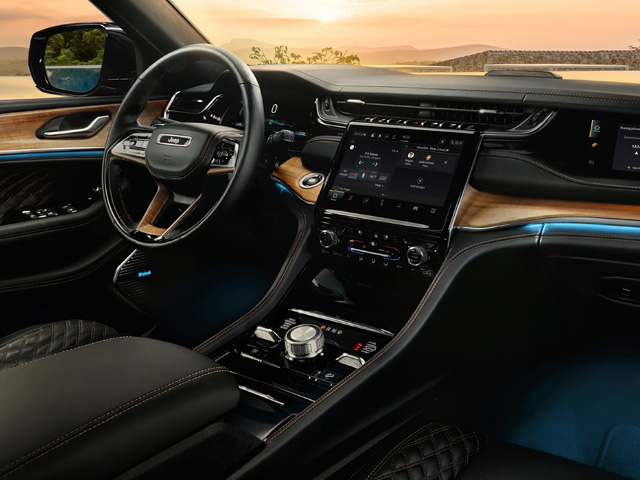
Jeep Grand Cherokee 4xe
 2
2
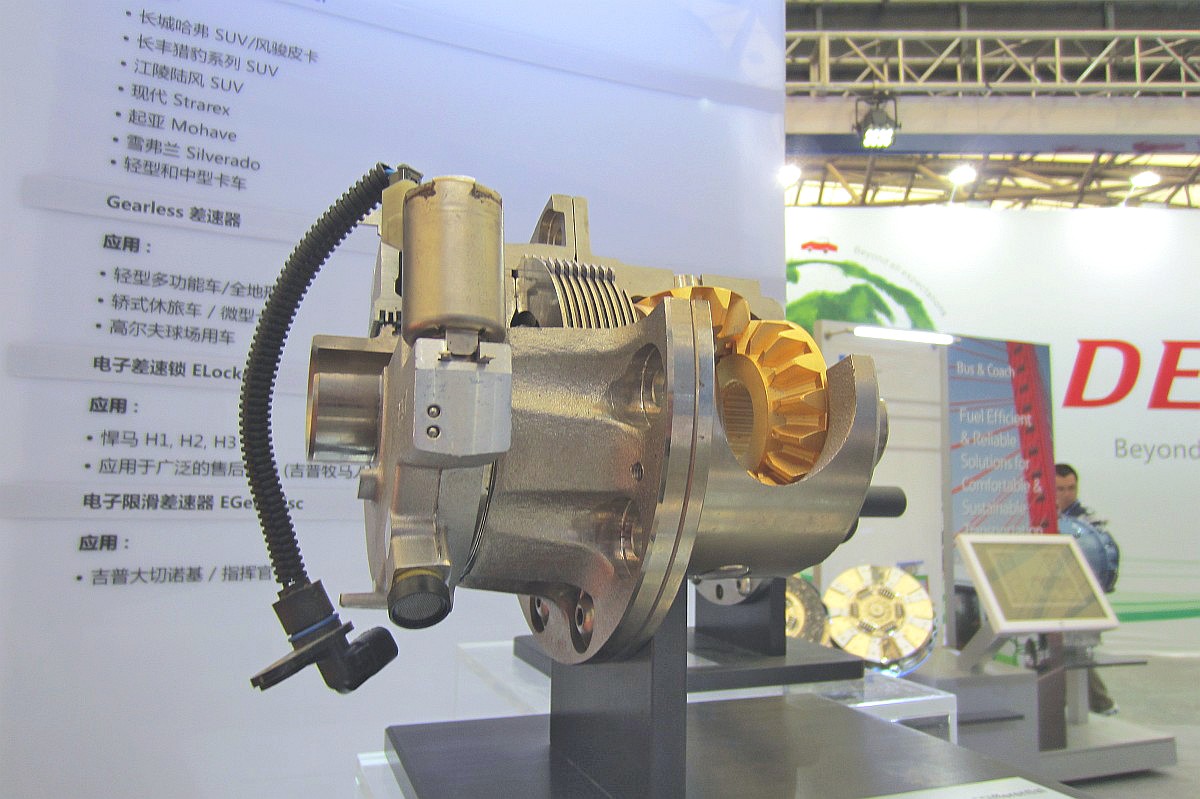
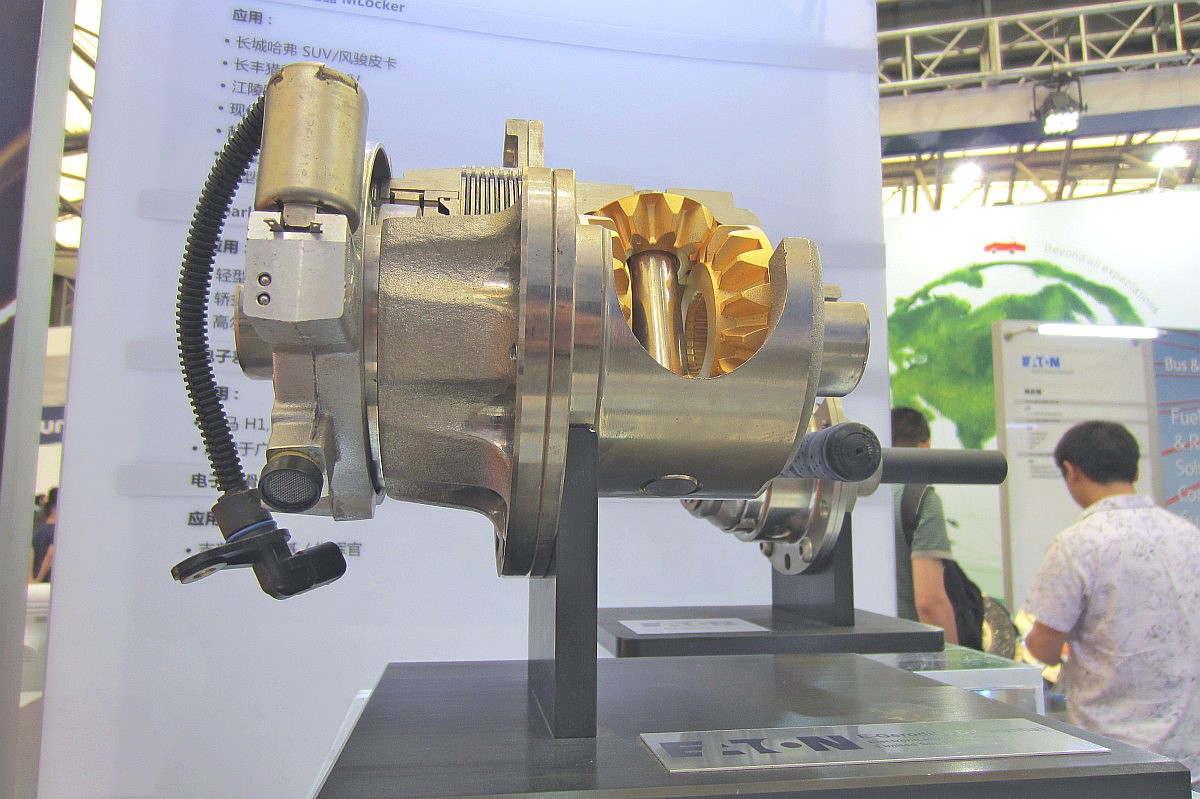
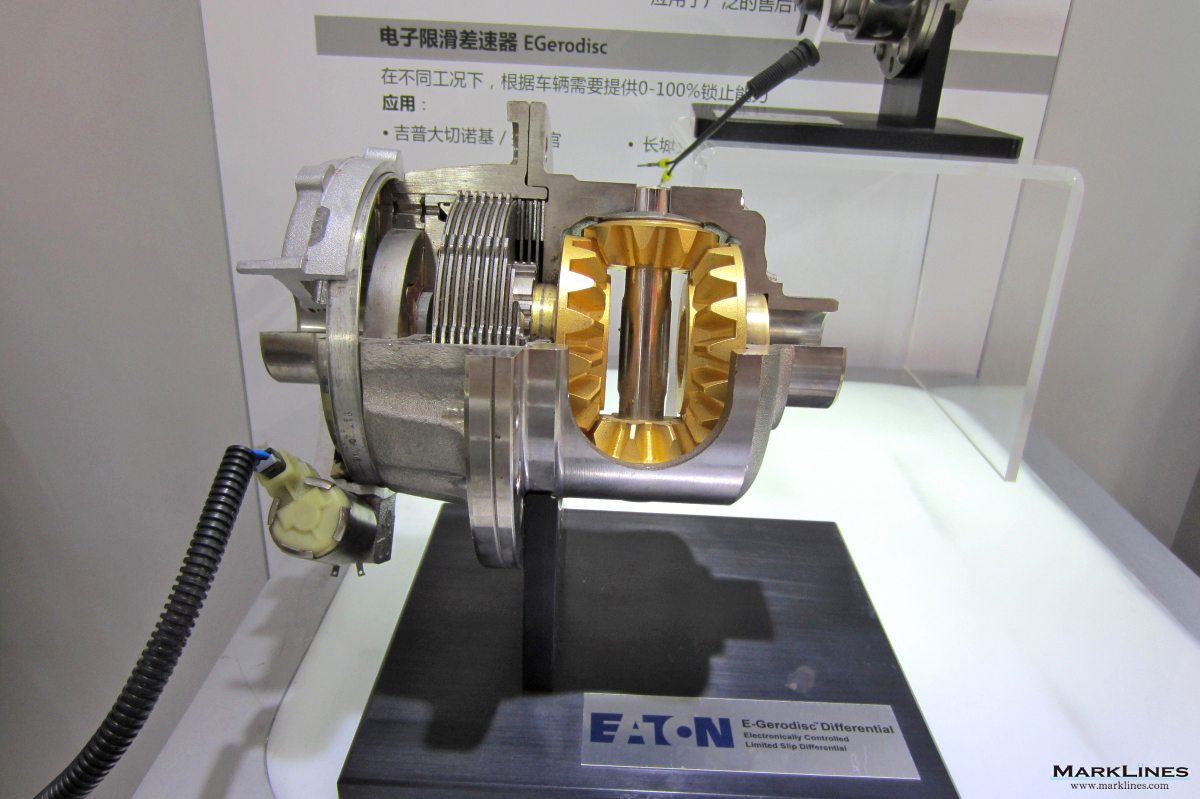
E-Gerodisc differential--electronically controlled limited slip differential
 2
2
E-Gerodisc differential--electronically controlled limited slip differential
 2
2
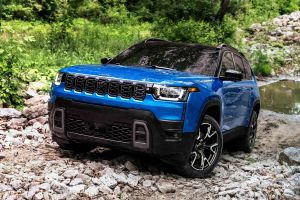
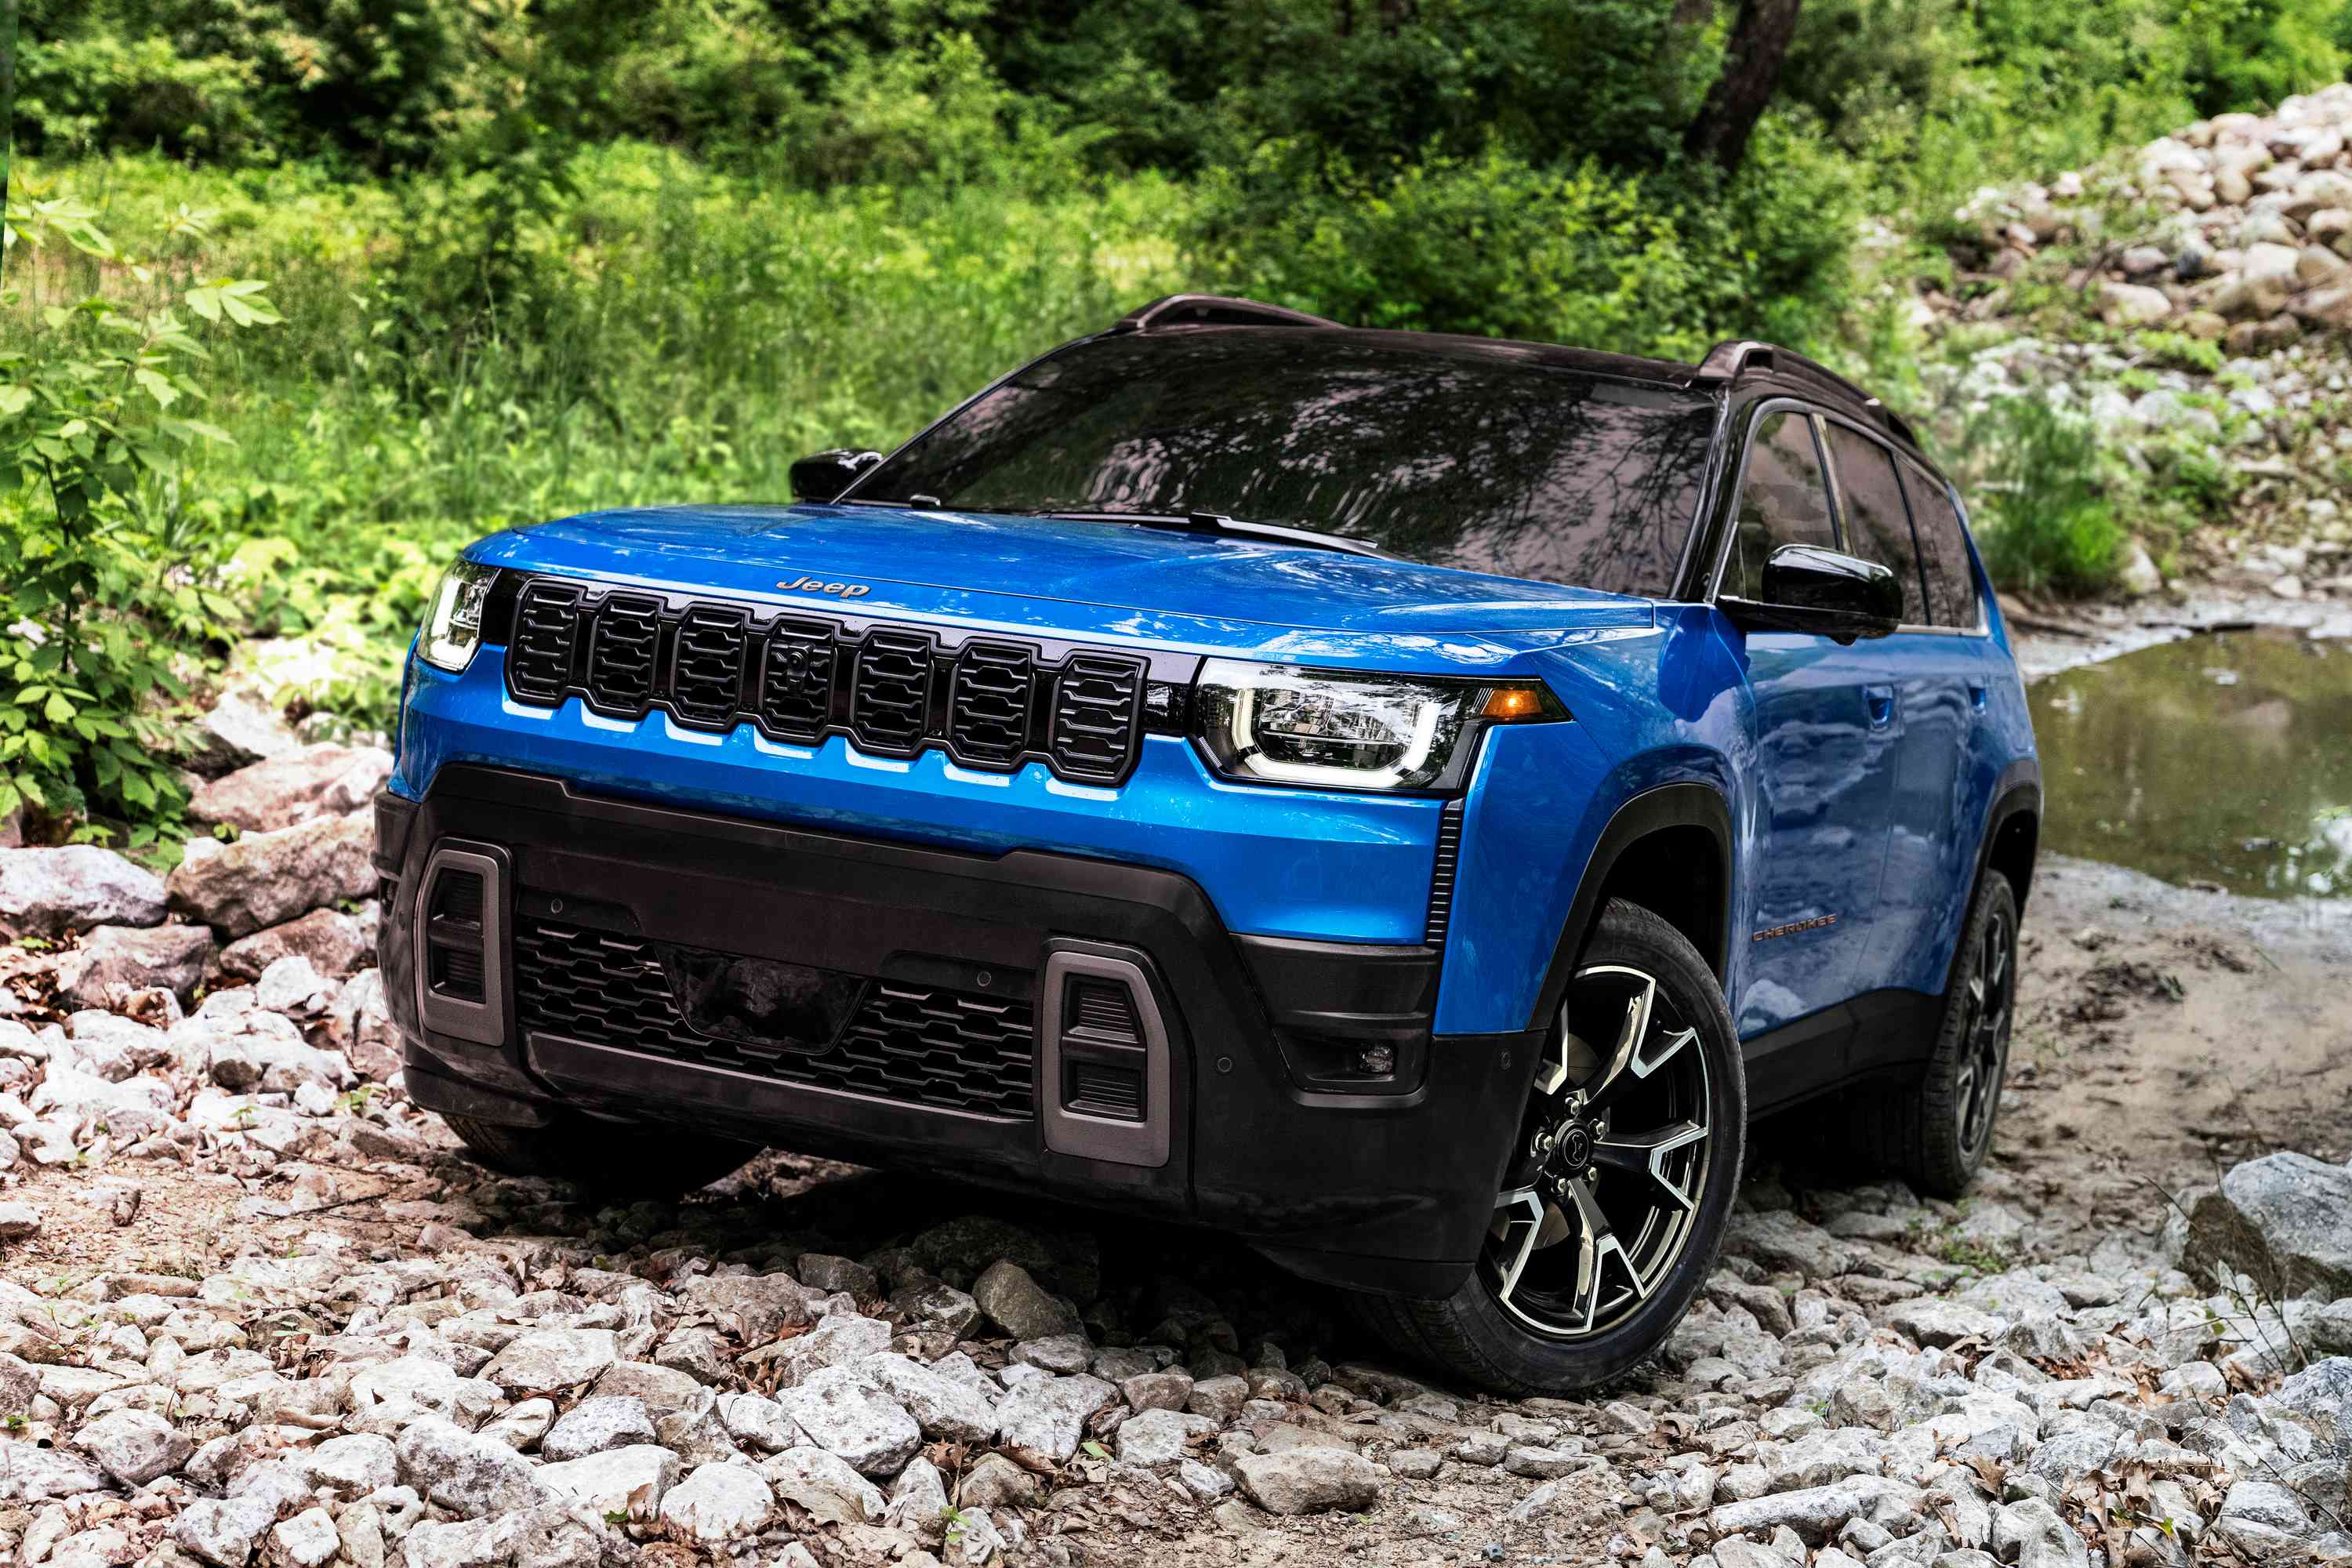
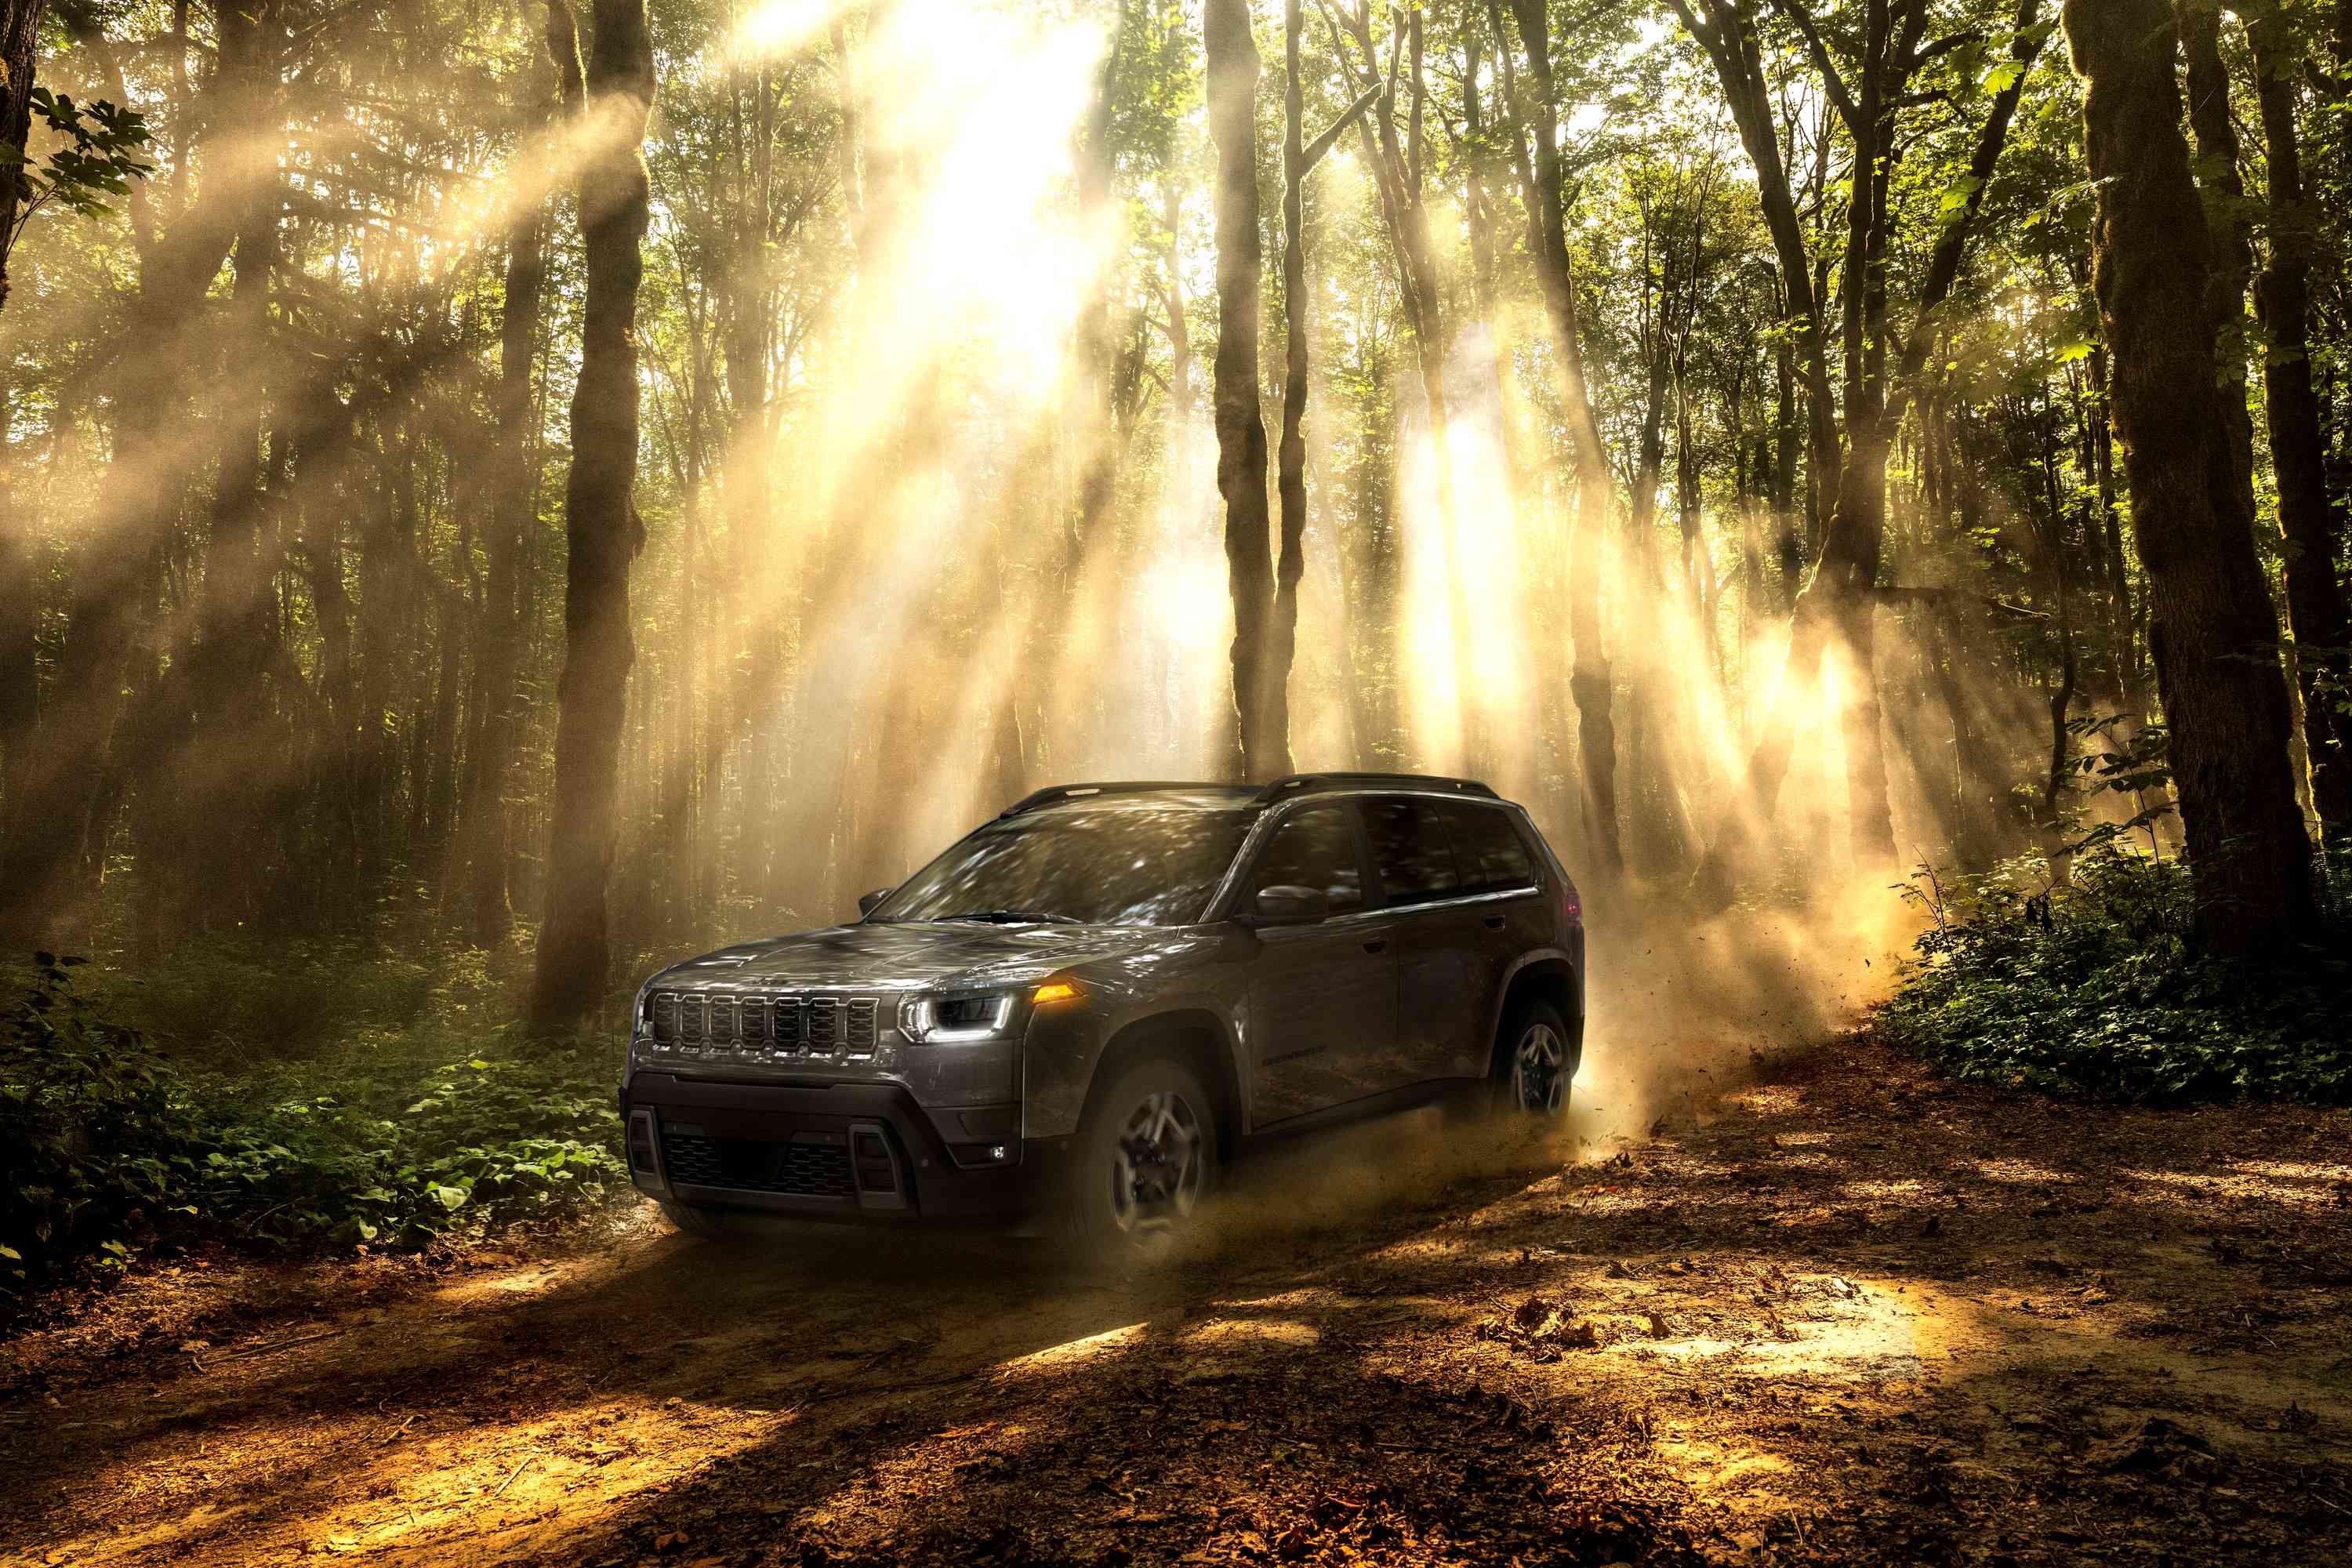
All-new Jeep Cherokee to debut in late 2025
 2
2
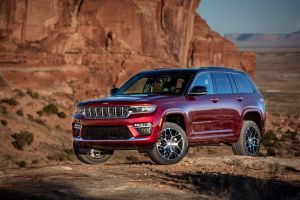
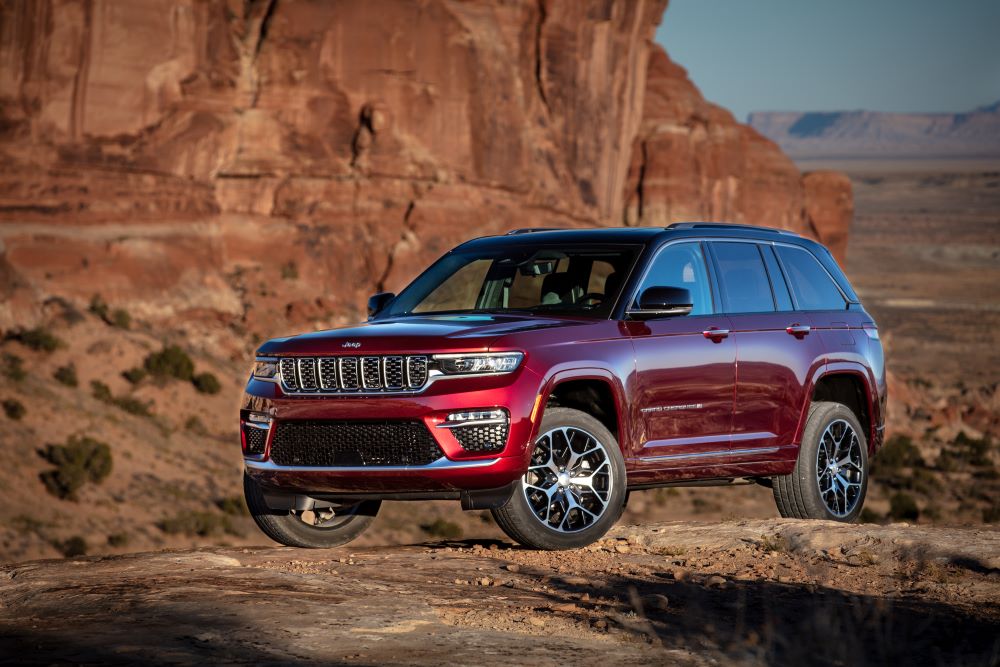
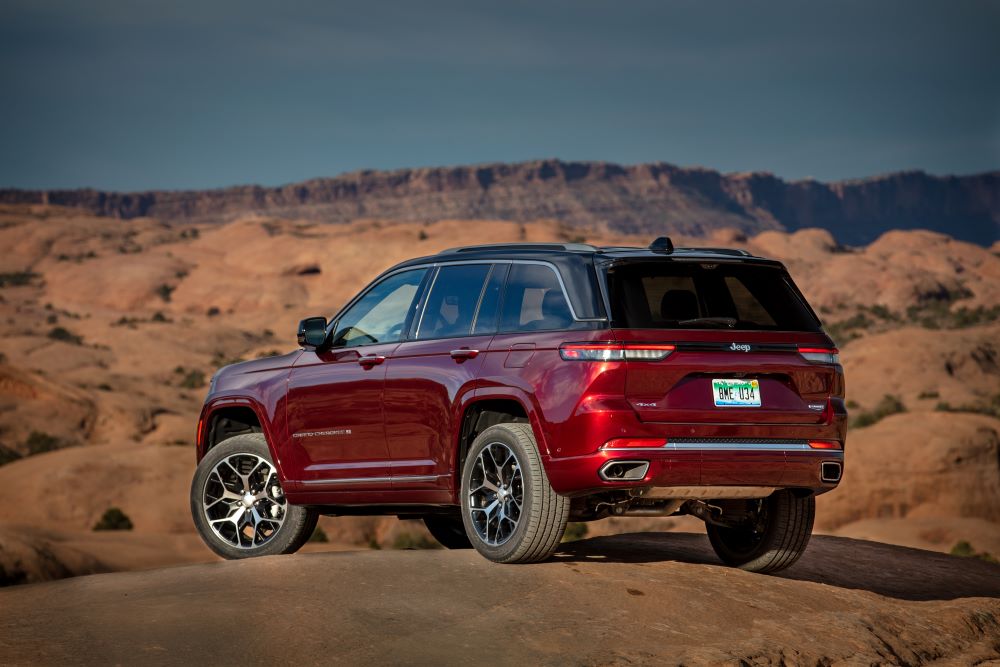
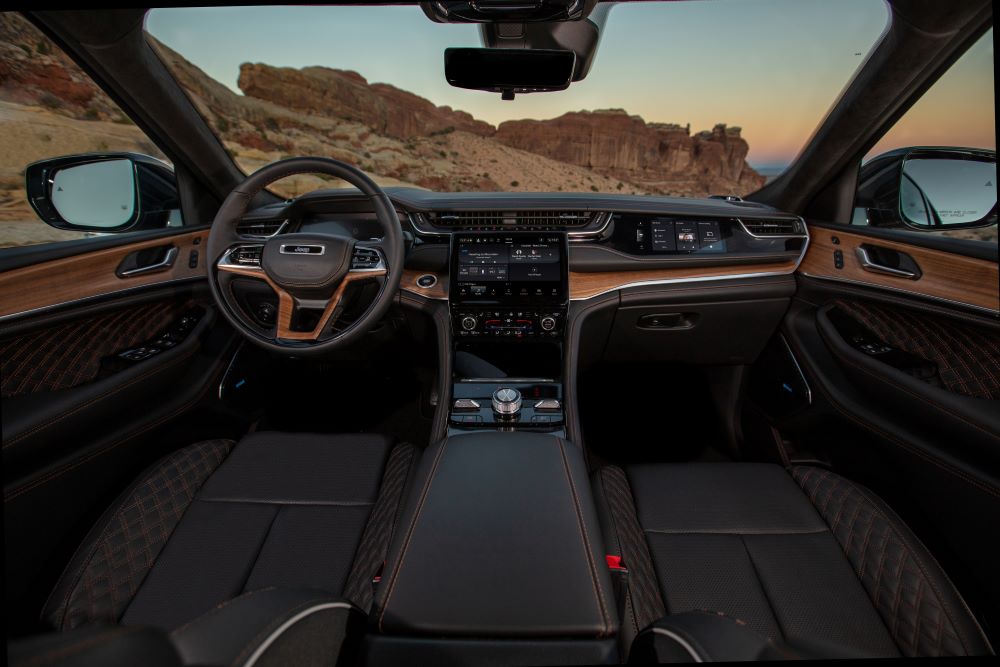
Jeep brand previews refreshed 2026 Grand Cherokee
 1
1
Stellantis reports 9% decrease in Q1 2025 consolidated shipments estimates
 2
2
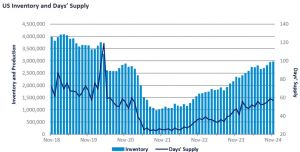
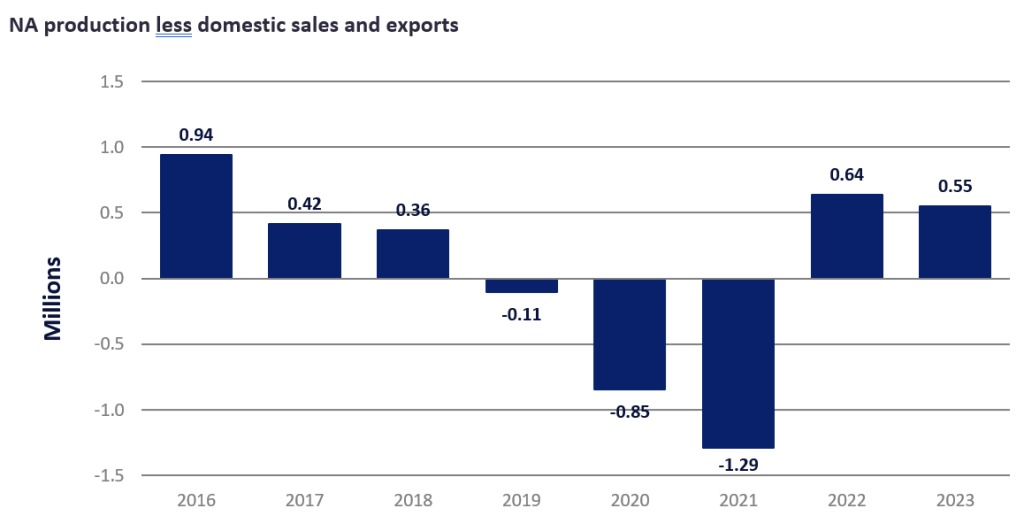
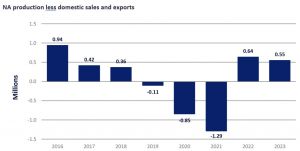
GlobalData blog: Nearly five years post-pandemic: where are we now?
 3
3
Jeep enhances affordability of 2025 Grand Cherokee line with lower prices
 3
3
Stellantis MEA unveils Jeep Grand Cherokee L in Egypt
Sort by :
1 - 12 of 12 results
Data changes for Sales Statistics
Retroactively from 2021, MG's sales figures of E-mobility have been updated.There is no change in the total number of monthly sales. May 1, 2023 Japan The buses sales data for March 2023 have been updated. There is no change in the total of each vehicle type, including the total of buses nor the grand total. April 10, 2023 USA Sales figures of Mercedes in January - March 2022 have been updated. As a result, the total sales figure for the U.S...
Automotive Sales Data Updated at: 2025/07/16
USA - Flash report, Automotive sales volume, 2023
ve Total 810 - -% 930 - -% Share 0.1% -% -% 0.0% -% -% Karma *2 Total 5 3 66.7% 38 185 -79.5% Share 0.0% 0.0% 0.0 pt 0.0% 0.0% 0.0 pt VinFast *2 Total N/A - -% N/A - -% Share -% -% -% -% -% -% Others Total 1,281 1,060 20.8% 14,436 10,820 33.4% Share 0.1% 0.1% 0.0 pt 0.1% 0.1% 0.0 pt Grand Total *2 1,454,597 1,287,280 13.0% 15,608,386 13,903,429 12.3% Source: Releases by each company, MarkLines Data Center *1 Includes Sprinter *...
Automotive Sales Data Updated at: 2025/06/04
USA - Flash report, Automotive sales volume, 2022
0.0 pt 0.1% 0.0% 0.1 pt Lucid Motors *2 Total 463 369 25.5% 2,656 577 360.3% Share 0.0% 0.0% 0.0 pt 0.0% 0.0% 0.0 pt Karma *2 Total 3 10 -70.0% 185 99 86.9% Share 0.0% 0.0% 0.0 pt 0.0% 0.0% 0.0 pt Others Total 1,060 826 28.3% 10,820 9,511 13.8% Share 0.1% 0.1% 0.0 pt 0.1% 0.1% 0.0 pt Grand Total *2 1,287,280 1,221,230 5.4% 13,903,429 15,081,117 -7.8% Source: Releases by each company, MarkLines Data Center *1 Includes Sprinter *2...
Automotive Sales Data Updated at: 2025/06/04
USA - Flash report, Automotive sales volume, 2021
% -% -% Rivian *2 Total 252 - -% 584 - -% Share 0.0% -% -% 0.0% -% -% Lucid Motors *2 Total 369 - -% 577 - -% Share 0.0% -% -% 0.0% -% -% Karma *2 Total 10 - -% 99 - -% Share 0.0% -% -% 0.0% -% -% Others Total 826 743 11.2% 9,511 6,963 36.6% Share 0.1% 0.0% 0.0 pt 0.1% 0.0% 0.0 pt Grand Total *2 1,221,647 1,619,907 -24.6% 15,079,182 14,580,541 3.4% Source: Releases by each company, MarkLines Data Center *1 Includes Sprinter *...
Automotive Sales Data Updated at: 2025/06/04
USA - Flash report, Sales volume, 2020
re 0.2% 0.2% 0.0 pt 0.2% 0.2% 0.0 pt Jaguar *2 Total 1,119 3,311 -66.2% 17,976 31,051 -42.1% Share 0.1% 0.2% -0.1 pt 0.1% 0.2% -0.1 pt smart Total NA NA -% NA 680 -% Share -% -% -% -% 0.0% -% Others Total 1,252 1,481 -15.5% 12,177 16,724 -27.2% Share 0.1% 0.1% 0.0 pt 0.1% 0.1% 0.0 pt Grand Total *2 1,619,085 1,540,073 5.1% 14,577,371 17,061,082 -14.6% Source: Releases by each company, MarkLines Data Center *1 Includes Sprinter *...
Automotive Sales Data Updated at: 2025/06/04
Representative models for each segment
3, BYD Qin L, VW Passat Subaru Legacy, Nissan Fairlady Z, Mazda Atenza (Mazda 6) Toyota Camry, Hyundai Sonata, Kia K5 E (Large) Lexus ES, Dodge Charger, Toyota Crown BMW 5 Series, Mercedes-Benz E-Class, Audi A6 Audi A6, Mercedes-Benz E-Class, ZEEKR 001 Toyota Crown, Lexus ES, Nissan GT-R Hyundai Grandeur, Genesis G80, Kia K8 F (Luxury) Chevrolet Corvette, Porsche 911, Mercedes-Benz S-Class Porsche 911, Mercedes-Benz S-Class, BMW 7 Series MG ...
Automotive Sales Data Updated at: 2025/03/27
USA - Flash report, Sales volume, 2018
0.3% 0.3% 0.0 pt Jaguar Total 3,462 3,414 1.4% 30,483 39,594 -23.0% Share 0.2% 0.2% 0.0 pt 0.2% 0.2% -0.1 pt smart Total 122 166 -26.5% 1,276 3,071 -58.5% Share 0.0% 0.0% 0.0 pt 0.0% 0.0% 0.0 pt Others Total 2,095 2,200 -4.8% 19,346 21,101 -8.3% Share 0.1% 0.1% 0.0 pt 0.1% 0.1% 0.0 pt Grand Total 1,627,481 1,603,129 1.5% 17,274,250 17,230,436 0.3% Source: Releases by each company, MarkLines Data Center *1 Includes Sprinter *2 The...
Automotive Sales Data Updated at: 2019/01/28
Mexico - Flash report, Sales volume, 2014
-1.2% Toyota RAV 4* 2,391 3,211 -25.5% Dodge i10*(Hyundai) 4,077 5,456 -25.3% Ford RangerCrew Cab * 2,356 1,167 101.9% VW Gol* 4,060 4,451 -8.8% Nissan Frontier 2,120 2,011 5.4% Toyota Corolla * 3,969 2,717 46.1% Jeep Patriot* 2,065 2,282 -9.5% SEAT Ibiza 4 puertas* 3,641 4,289 -15.1% Jeep Grand Cherokee * 1,843 1,630 13.1% Others 74,928 85,204 -12.1% Others 60,317 58,055 3.9% Total 213,669 223,409 -4.4% Total 114,320 107,347 6.5% ...
Automotive Sales Data Updated at: 2015/01/14
Australia - Flash report, Sales volume, 2014
4.9% 6 Ford Ranger 2,023 1,781 13.6% 6 Ford Ranger 15,466 12,344 25.3% 7 Mazda CX-5 1,895 1,638 15.7% 7 Mitsubishi Triton 13,039 14,820 -12.0% 8 Toyota Camry 1,805 2,061 -12.4% 8 Mazda CX-5 12,901 11,731 10.0% 9 Holden Cruze 1,747 2,467 -29.2% 9 Volkswagen Golf 12,094 8,567 41.2% 10 Jeep Grand Cherokee 1,409 1,196 17.8% 10 Toyota Camry 11,923 12,196 -2.2% Source: FCAI {{ include file="/daisu/en/flash_sales/australia.html" }} Flas...
Automotive Sales Data Updated at: 2015/01/07
USA - Flash report, Sales volume, 2014
242 238,192 1.7 Ford FordF-Series 74,355 74,592 -0.3 753,851 763,402 -1.3 FordEscape 25,603 24,462 4.7 306,212 295,993 3.5 FordFusion 23,166 24,408 -5.1 306,860 295,280 3.9 FCA RamP/U 44,222 33,405 32.4 439,789 355,673 23.6 JeepCherokee 17,715 15,038 17.8 178,508 25,786 592.3 Jeep Grand Cherokee 17,176 16,517 4.0 183,786 174,275 5.5 Toyota Toyo...
Automotive Sales Data Updated at: 2015/01/06
Mexico - Flash report, Sales volume, 2013
Jeep Patriot* 6,402 7,290 -12.2% Dodge i10*(Hyundai) 13,127 12,478 5.2% Nissan URVAN Carga* 5,872 5,169 13.6% SEAT Ibiza 4 puertas* 10,961 13,590 -19.3% Nissan Estacas Largo 5,840 4,642 25.8% VW Gol* 10,019 12,180 -17.7% Ford F-350* 5,778 6,148 -6.0% Ford Ikon Hatch* 9,528 5,998 58.9% Jeep Grand Cherokee* 5,385 4,473 20.4% Sub total 397,427 348,631 14.0% Sub total 152,229 116,687 30.5% Others 224,729 227,596 -1.3% Others 169,614 183,...
Automotive Sales Data Updated at: 2014/04/24
USA - Flash report, Sales volume, 2013
224 237,758 4.4 GMCSierra 17,854 18,710 -4.6 184,389 157,185 17.3 Ford FordF-Series 74,592 68,787 8.4 763,402 645,316 18.3 FordEscape 24,462 20,131 21.5 295,993 261,008 13.4 FordFusion 24,408 19,283 26.6 295,280 241,263 22.4 Chrysler RamP/U 33,405 30,211 10.6 355,673 293,363 21.2 Jeep Grand Cherokee 16,517 17,121 -3.5 174,275 154,734 12.6 Jeep Cherokee 15,038 0 N/C 25,786 0 N/C Toyota Toyota Camry 29,964 31,407 -4.6 408,484 404,...
Automotive Sales Data Updated at: 2014/01/06


 Japan
Japan USA
USA Mexico
 Germany
 China (Shanghai)
 Thailand
 India
India