
 AI Navigator


Search Results by Category
 AI Navigator
All information related to {{ key_word }}.
AI Navigation will guide you. Click here for information about {{ key_word }}.
Images
 3
3
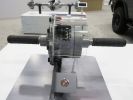
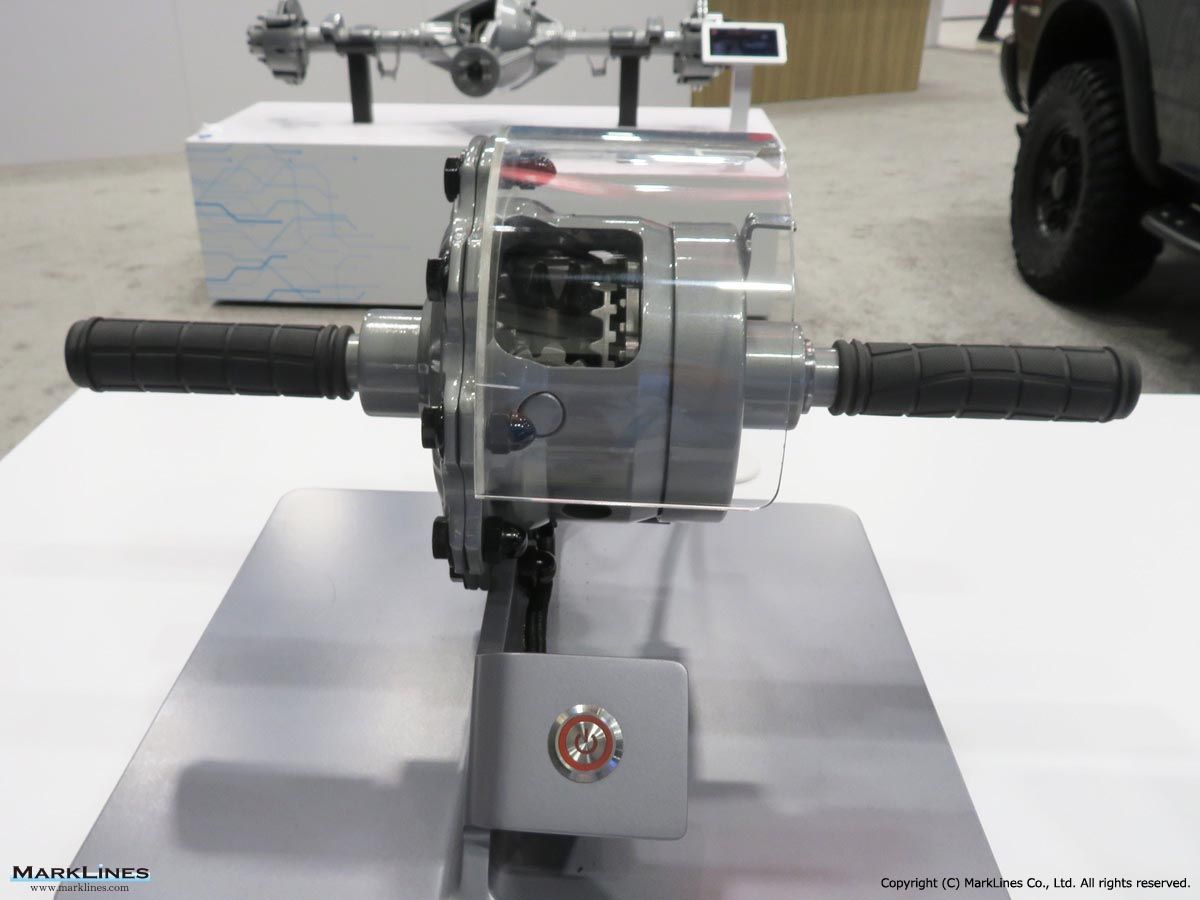
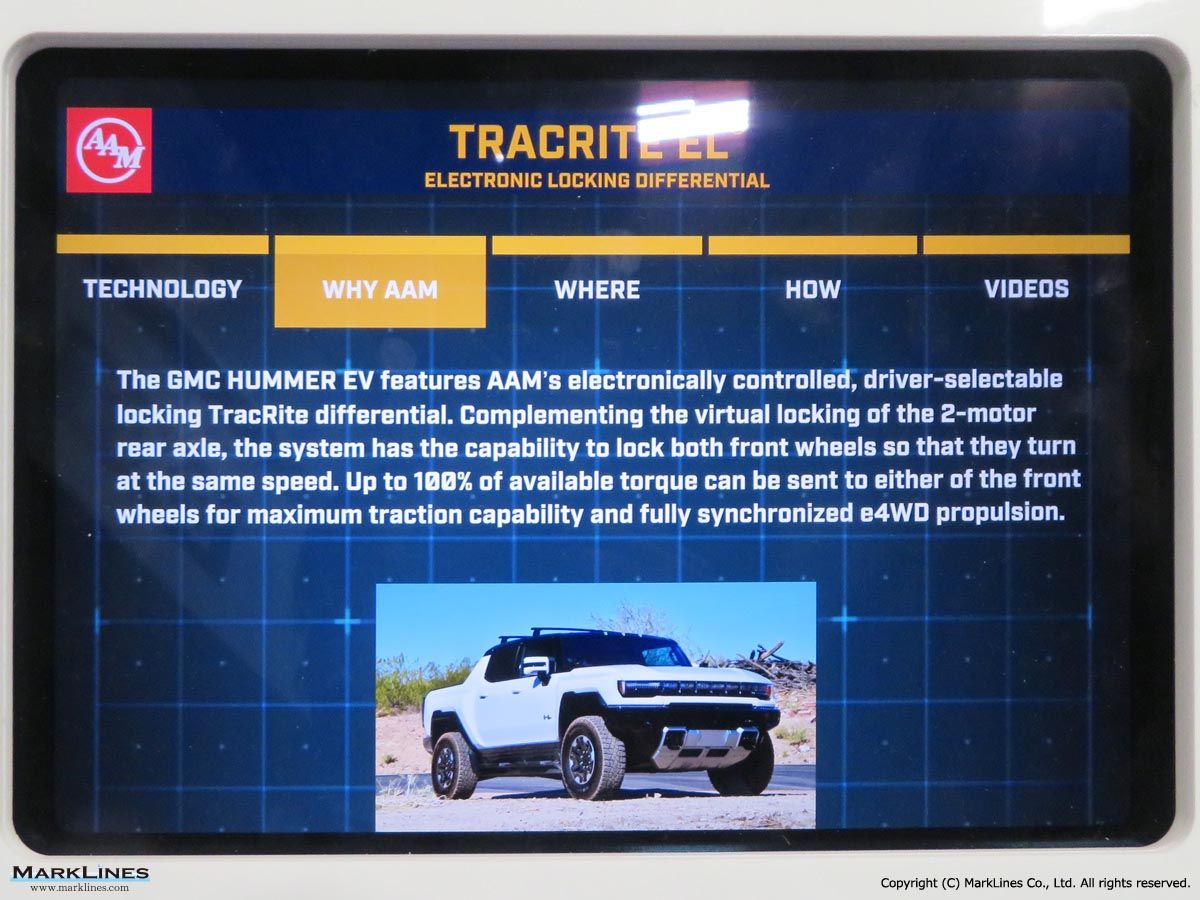
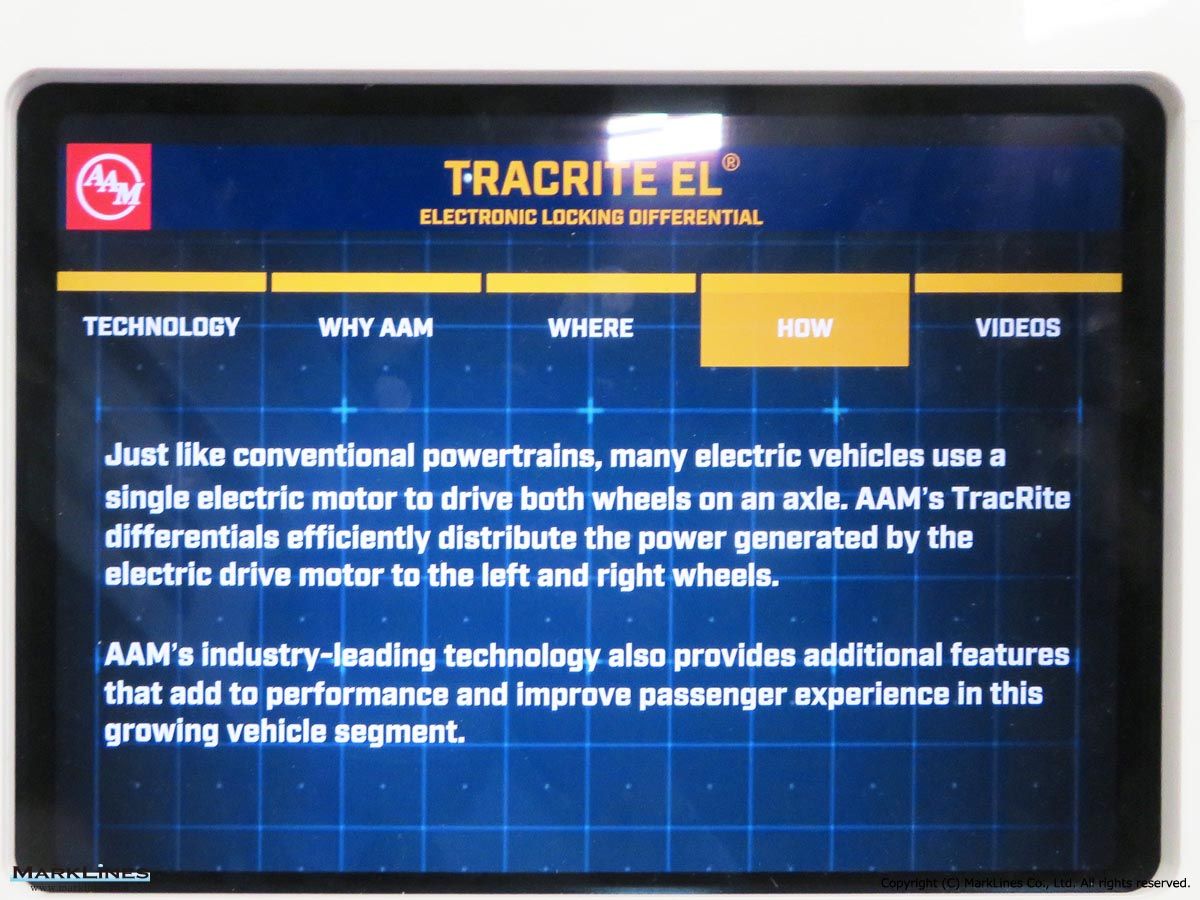
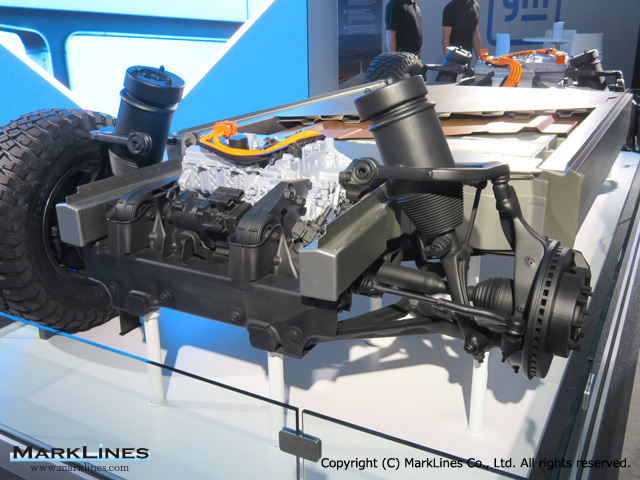
TracRite EL electronic locking differential
 2
2
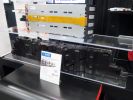
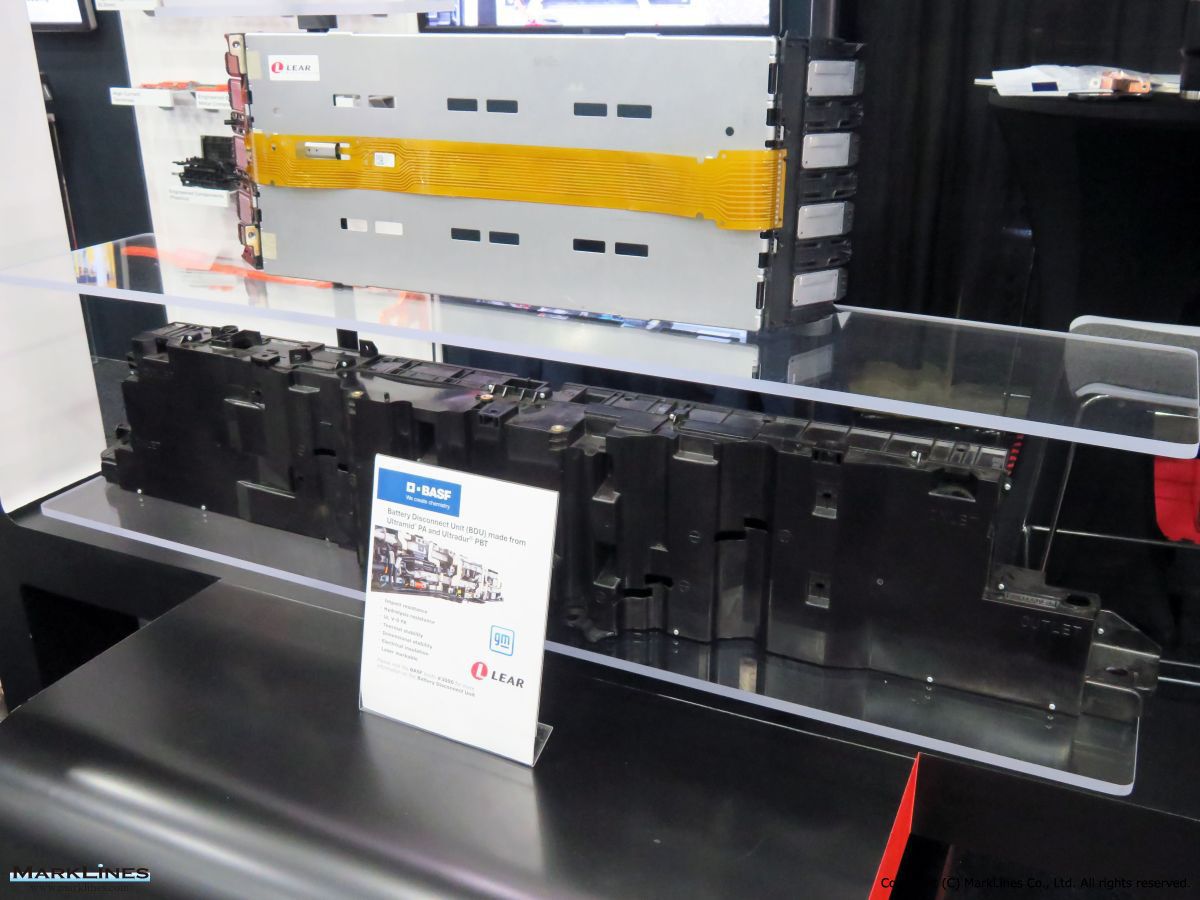
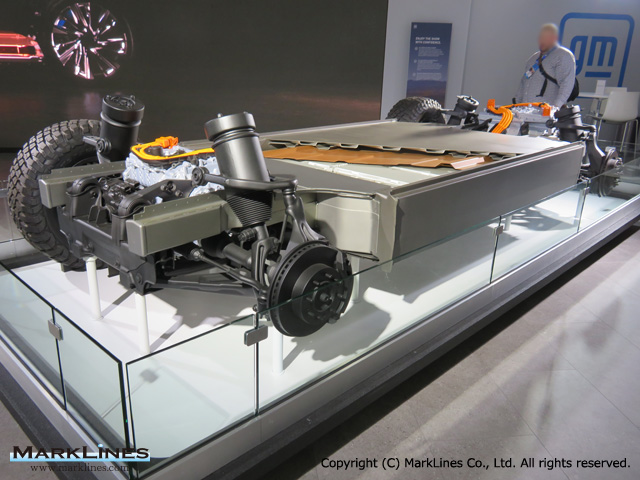
Battery disconnect unit
 4
4
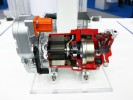
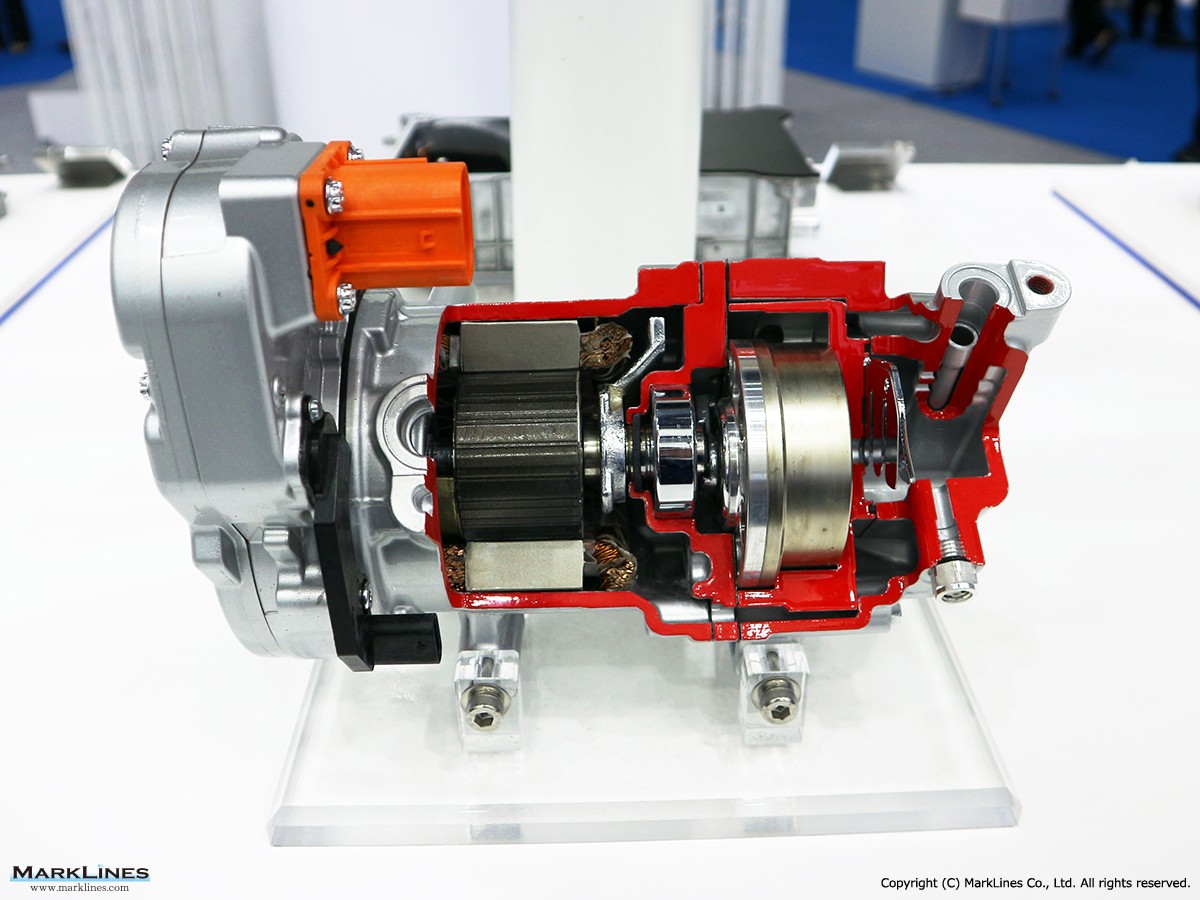
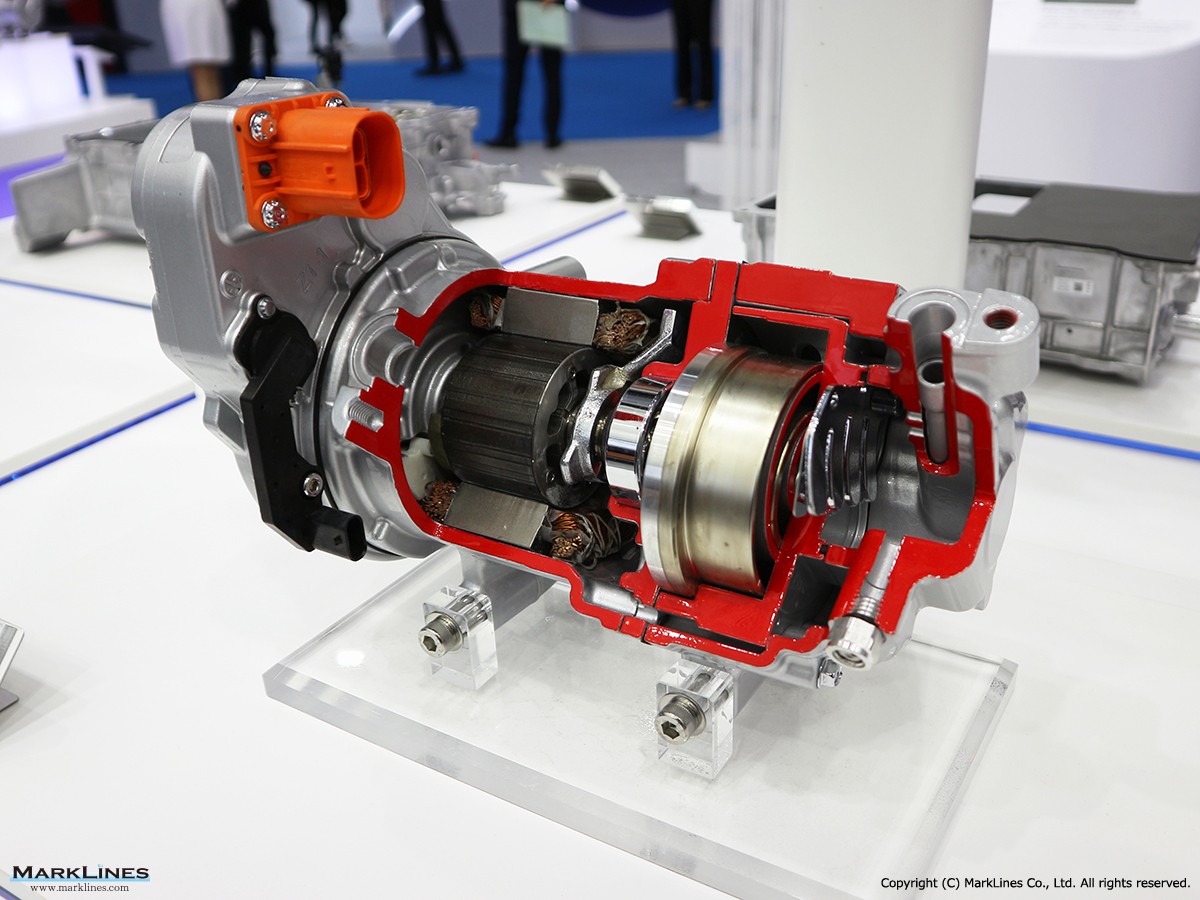
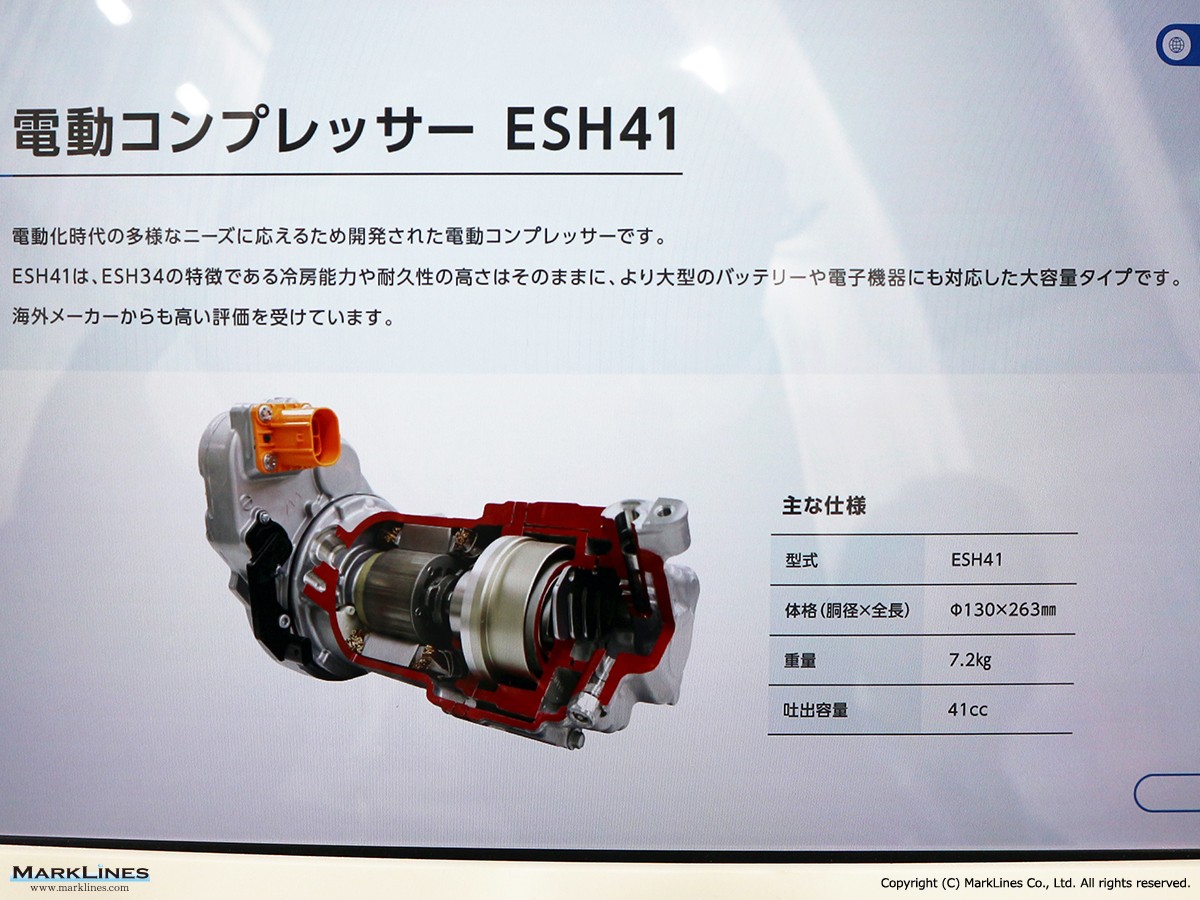
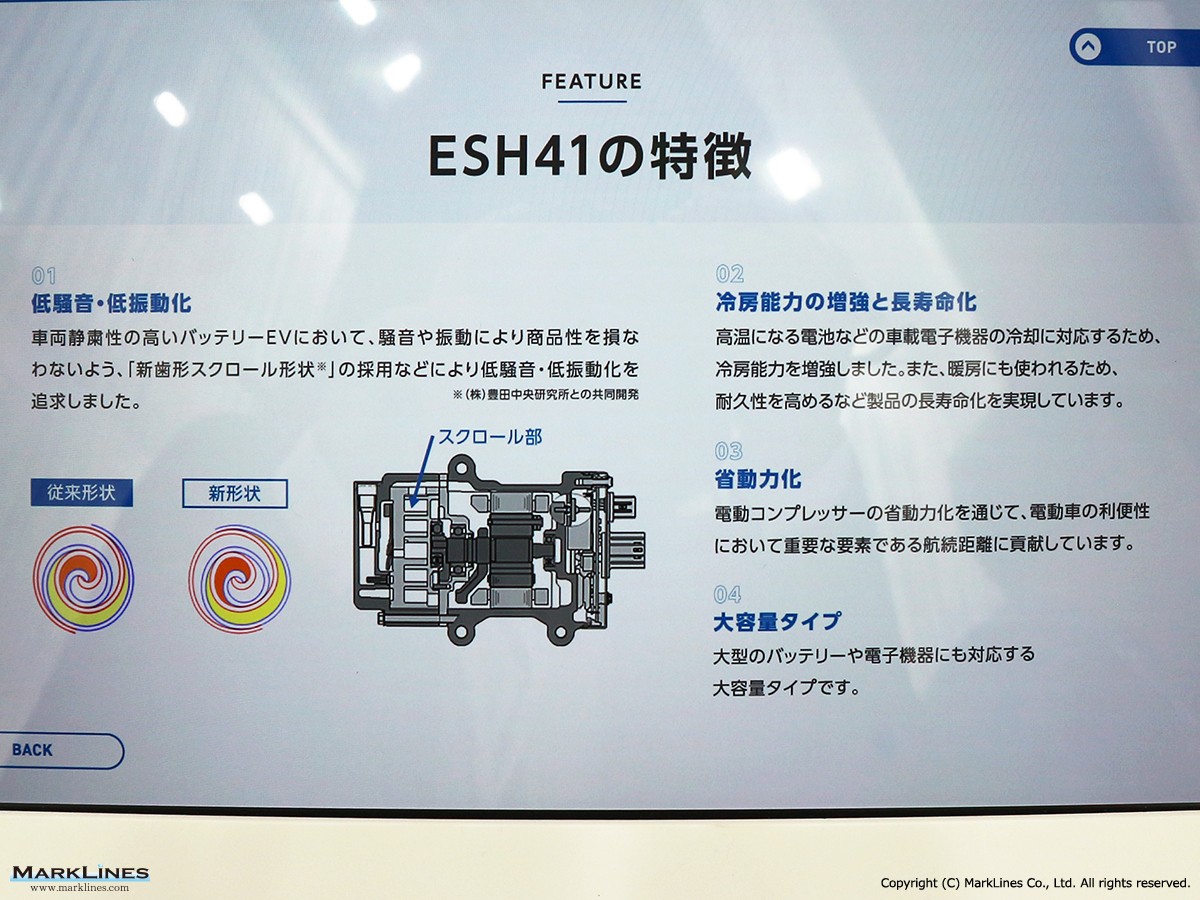
Electric compressor ESH41
 7
7
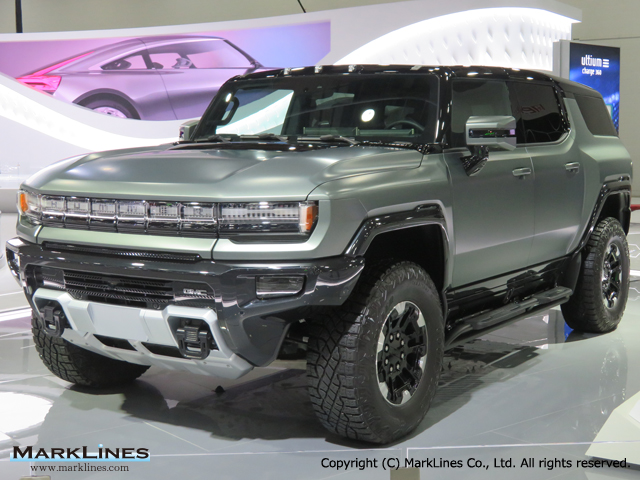
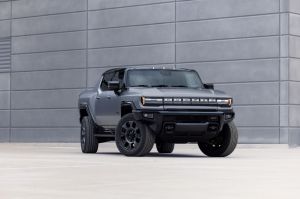
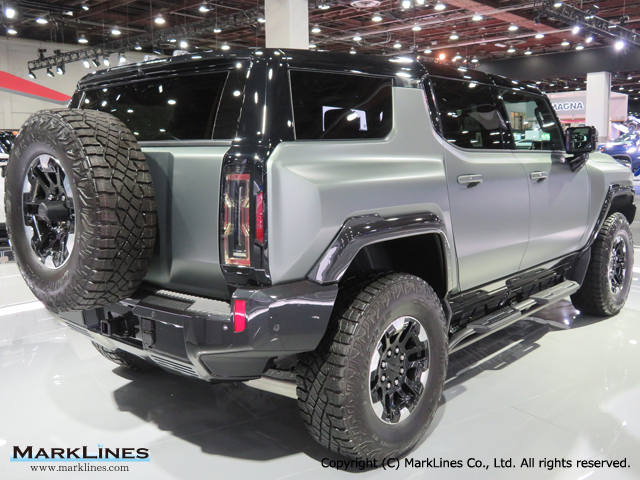
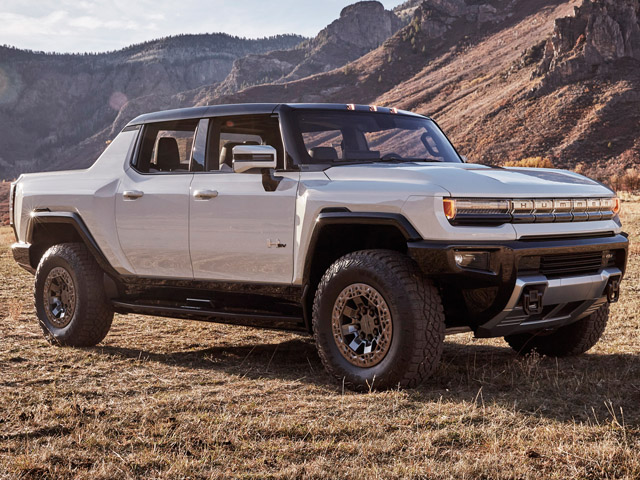
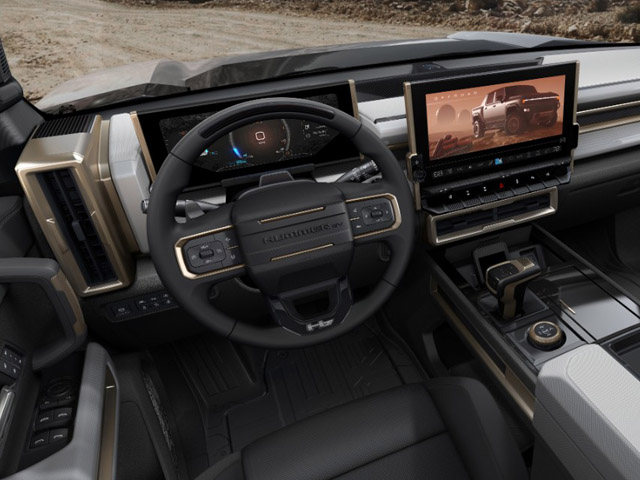
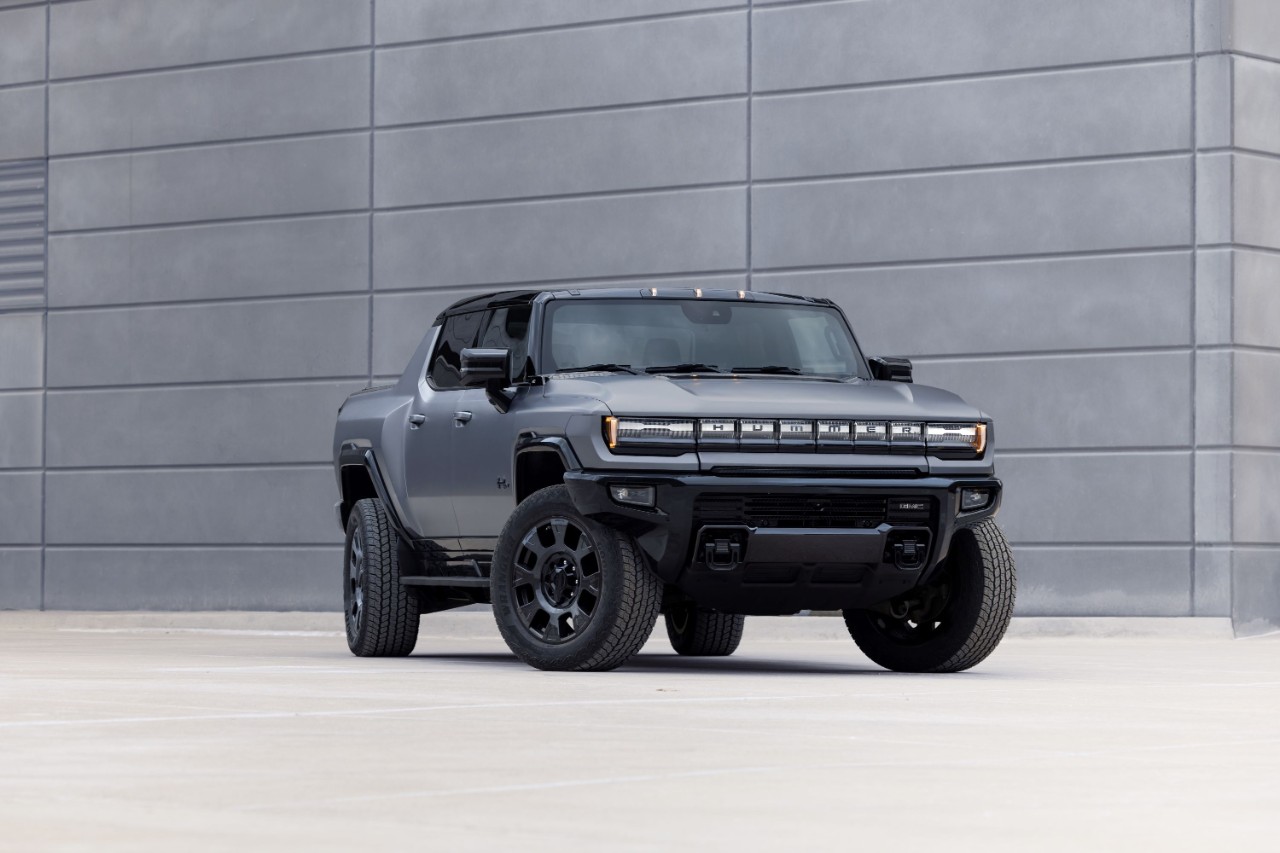
GMC Hummer
 2
2
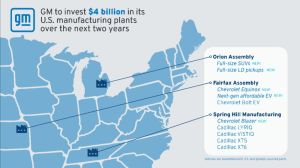
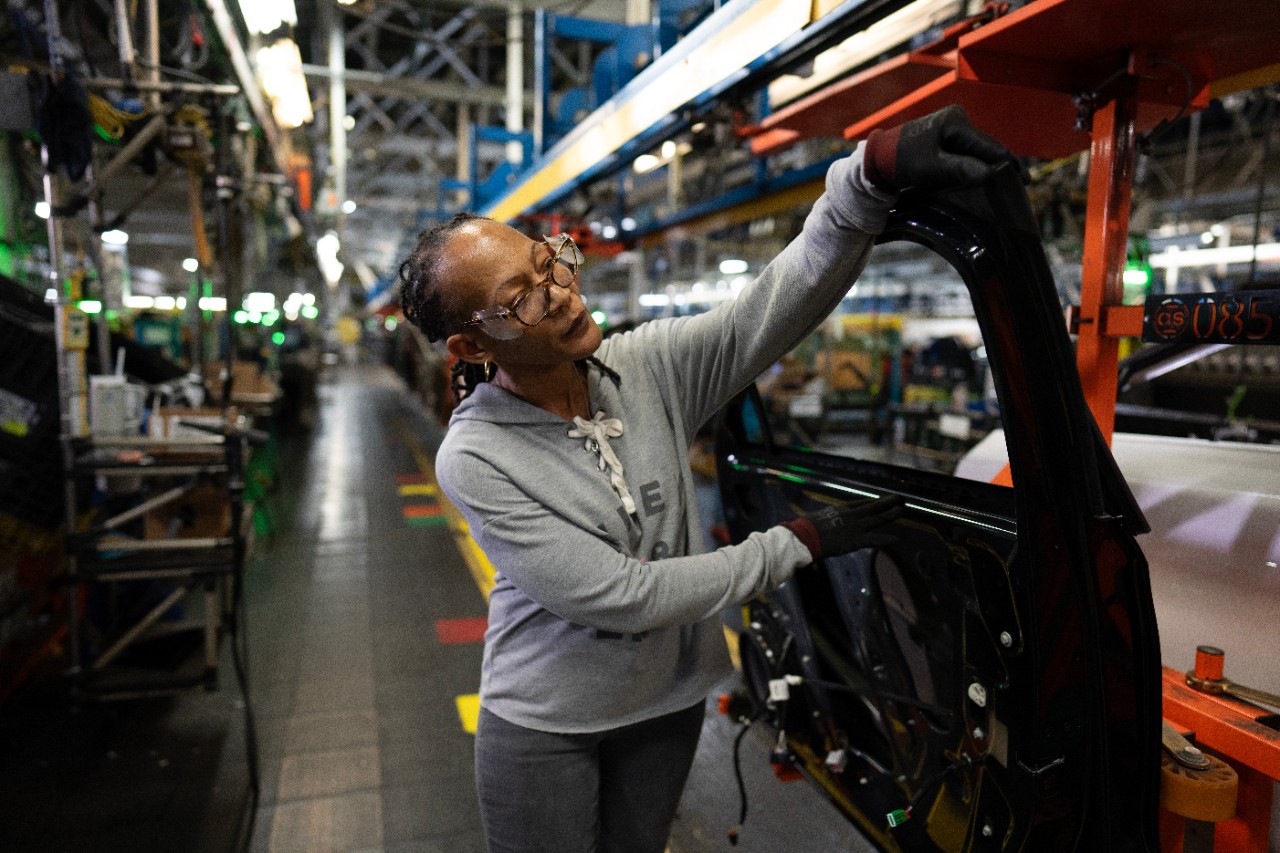
GM to invest USD 4 billion in Orion, Fairfax, Spring Hill plants over 2 years
 1
1
GMC announces new features for 2026 Hummer EV
 1
1
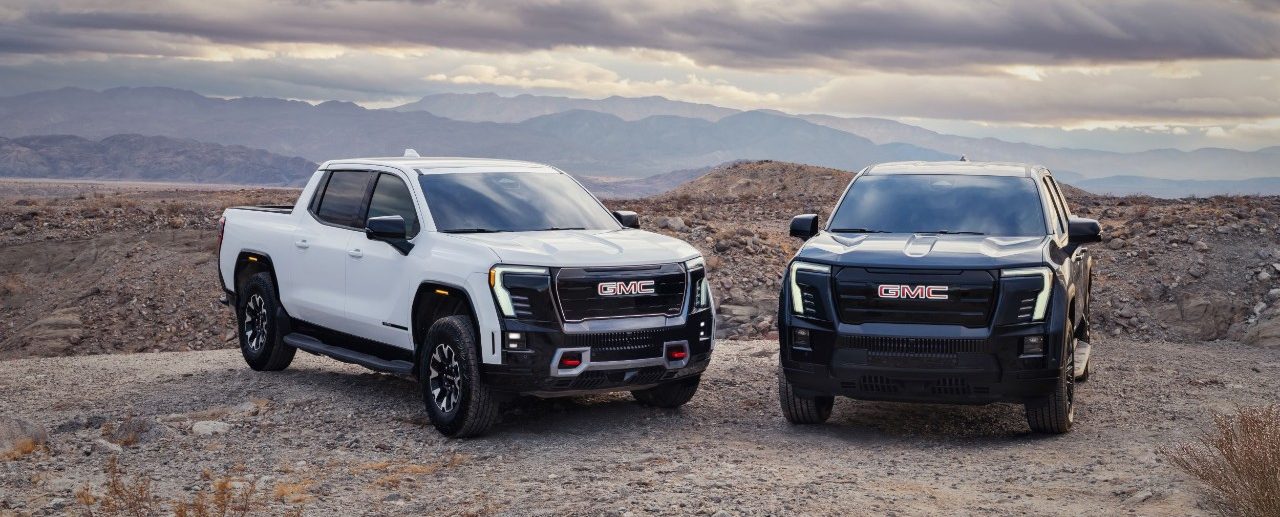
GMC adds AT4, Elevation trim levels for 2026 GMC Sierra EV
 1
1
GM tops 300,000 EV sales in the U.S.
 1
1
GMC Middle East introduces Hummer EV pickup and SUV in UAE and Kuwait
 2
2
GMC set to expand to other global markets following record 2023
Sort by :
1 - 12 of 12 results
Japan - Flash report, Automotive sales volume, 2023
.9% 236 0.1% 240 0.1% -1.7% Dodge 7 0.0% 21 0.1% -66.7% 217 0.1% 433 0.1% -49.9% Lotus 19 0.1% 6 0.0% 216.7% 198 0.1% 179 0.1% 10.6% McLaren 12 0.0% 15 0.0% -20.0% 177 0.1% 136 0.0% 30.1% Autobianchi 3 0.0% 6 0.0% -50.0% 47 0.0% 77 0.0% -39.0% Rover - -% 6 0.0% -% 39 0.0% 53 0.0% -26.4% GMC 3 0.0% 3 0.0% 0.0% 27 0.0% 44 0.0% -38.6% Morgan 1 0.0% 2 0.0% -50.0% 22 0.0% 29 0.0% -24.1% Pontiac 2 0.0% - -% -% 16 0.0% 17 0.0% -5.9% MG...
Automotive Sales Data Updated at: 2025/06/04
Japan - Flash report, Automotive sales volume, 2022
327 0.1% -12.5% Rolls Royce 18 0.1% 29 0.1% -37.9% 240 0.1% 240 0.1% 0.0% Lotus 6 0.0% 28 0.1% -78.6% 179 0.1% 305 0.1% -41.3% McLaren 15 0.0% 12 0.0% 25.0% 136 0.0% 189 0.1% -28.0% Autobianchi 6 0.0% 10 0.0% -40.0% 77 0.0% 82 0.0% -6.1% Rover 6 0.0% 7 0.0% -14.3% 53 0.0% 42 0.0% 26.2% GMC 3 0.0% 8 0.0% -62.5% 44 0.0% 97 0.0% -54.6% Opel - -% 2 0.0% -% 33 0.0% 3 0.0% 1000.0% BYD 9 0.0% - -% -% 31 0.0% - -% -% Morgan 2 0.0% 7 0....
Automotive Sales Data Updated at: 2025/06/04
Japan - Flash report, Automotive sales volume, 2021
64 0.1% 116.5% Daihatsu 32 0.1% 25 0.1% 28.0% 327 0.1% 70 0.0% 367.1% Scania 33 0.1% 39 0.1% -15.4% 317 0.1% 359 0.1% -11.7% Lotus 28 0.1% 51 0.1% -45.1% 305 0.1% 275 0.1% 10.9% Rolls Royce 29 0.1% 29 0.1% 0.0% 240 0.1% 226 0.1% 6.2% McLaren 12 0.0% 13 0.0% -7.7% 189 0.1% 205 0.1% -7.8% GMC 8 0.0% 7 0.0% 14.3% 97 0.0% 53 0.0% 83.0% Autobianchi 10 0.0% 5 0.0% 100.0% 82 0.0% 74 0.0% 10.8% Rover 7 0.0% 9 0.0% -22.2% 42 0.0% 38 0.0% 1...
Automotive Sales Data Updated at: 2025/06/04
Japan - Flash report, Sales volume, 2020
205 0.1% 353 0.1% -41.9% Aston Martin 18 0.0% 38 0.1% -52.6% 196 0.1% 314 0.1% -37.6% BMW Alpina 21 0.1% 13 0.0% 61.5% 164 0.1% 209 0.1% -21.5% smart - -% 78 0.2% -% 124 0.0% 1,990 0.6% -93.8% Autobianchi 5 0.0% 3 0.0% 66.7% 74 0.0% 63 0.0% 17.5% Daihatsu 25 0.1% - -% -% 70 0.0% - -% -% GMC 7 0.0% 7 0.0% 0.0% 53 0.0% 37 0.0% 43.2% Rover 9 0.0% 3 0.0% 200.0% 38 0.0% 41 0.0% -7.3% Morgan 1 0.0% 1 0.0% 0.0% 36 0.0% 25 0.0% 44.0% Un...
Automotive Sales Data Updated at: 2025/06/04
Japan - Flash report, Sales volume, 2019
% 13.9% 239 0.1% 230 0.1% 3.9% BMW Alpina 13 0.0% 13 0.0% 0.0% 209 0.1% 253 0.1% -17.4% Lotus 21 0.1% 15 0.0% 40.0% 203 0.1% 224 0.1% -9.4% Autobianchi 3 0.0% 7 0.0% -57.1% 63 0.0% 69 0.0% -8.7% Hyundai - -% - -% -% 50 0.0% 16 0.0% 212.5% Rover 3 0.0% 4 0.0% -25.0% 41 0.0% 34 0.0% 20.6% GMC 7 0.0% 4 0.0% 75.0% 37 0.0% 52 0.0% -28.8% Chrysler 5 0.0% 3 0.0% 66.7% 27 0.0% 49 0.0% -44.9% Morgan 1 0.0% 2 0.0% -50.0% 25 0.0% 25 0.0% 0.0...
Automotive Sales Data Updated at: 2020/01/23
Japan - Flash report, Sales volume, 2018
0.1% 219 0.1% 15.5% Scania 40 0.1% 17 0.0% 135.3% 249 0.1% 160 0.0% 55.6% Rolls Royce 36 0.1% 27 0.1% 33.3% 230 0.1% 225 0.1% 2.2% Lotus 15 0.0% 17 0.0% -11.8% 224 0.1% 172 0.0% 30.2% McLaren 21 0.1% 15 0.0% 40.0% 222 0.1% 164 0.0% 35.4% Autobianchi 7 0.0% - -% -% 69 0.0% 49 0.0% 40.8% GMC 4 0.0% 2 0.0% 100.0% 52 0.0% 52 0.0% 0.0% Chrysler 3 0.0% 20 0.1% -85.0% 49 0.0% 213 0.1% -77.0% Rover 4 0.0% 8 0.0% -50.0% 34 0.0% 46 0.0% -2...
Automotive Sales Data Updated at: 2019/04/03
Japan - Flash report, Sales volume, 2017
42 0.1% -36.0% Chrysler 20 0.1% 26 0.1% -23.1% 213 0.1% 283 0.1% -24.7% Lotus 17 0.0% 13 0.0% 30.8% 172 0.0% 197 0.1% -12.7% Mclaren 15 0.0% 20 0.1% -25.0% 164 0.0% 179 0.1% -8.4% Scania 17 0.0% 8 0.0% 112.5% 160 0.0% 104 0.0% 53.8% Hyundai 5 0.0% 15 0.0% -66.7% 127 0.0% 169 0.0% -24.9% GMC 2 0.0% 8 0.0% -75.0% 52 0.0% 51 0.0% 2.0% Autobianchi - -% - -% -% 49 0.0% 11 0.0% 345.5% Rover 8 0.0% 6 0.0% 33.3% 46 0.0% 45 0.0% 2.2% Mor...
Automotive Sales Data Updated at: 2018/07/24
Japan - Flash report, Sales volume, 2016
1% 156 0.0% 42.9% Lotus 13 0.0% 15 0.0% -13.3% 197 0.1% 271 0.1% -27.3% Aston Martin 19 0.1% 19 0.1% 0.0% 186 0.1% 164 0.0% 13.4% Mclaren 20 0.1% 13 0.0% 53.8% 179 0.1% 90 0.0% 98.9% Hyundai 15 0.0% 14 0.0% 7.1% 169 0.0% 82 0.0% 106.1% Scania 8 0.0% 3 0.0% 166.7% 104 0.0% 47 0.0% 121.3% GMC 8 0.0% 1 0.0% 700.0% 51 0.0% 50 0.0% 2.0% Rover 6 0.0% 5 0.0% 20.0% 45 0.0% 47 0.0% -4.3% Lancia 4 0.0% 2 0.0% 100.0% 23 0.0% 22 0.0% 4.5% H...
Automotive Sales Data Updated at: 2017/01/11
Japan - Flash report, Sales volume, 2013
% Bentley 72 0.2% 8 0.0% 800.0% 293 0.1% 216 0.1% 35.6% BMW Alpina 43 0.1% 16 0.0% 168.8% 226 0.1% 152 0.0% 48.7% Aston Martin 22 0.1% 17 0.1% 29.4% 209 0.1% 166 0.1% 25.9% Lamborghini 14 0.0% 16 0.0% -12.5% 190 0.1% 177 0.1% 7.3% Rolls Royce 18 0.1% 12 0.0% 50.0% 116 0.0% 90 0.0% 28.9% GMC 13 0.0% 5 0.0% 160.0% 110 0.0% 107 0.0% 2.8% Hummer 2 0.0% 11 0.0% -81.8% 91 0.0% 225 0.1% -59.6% Mclaren 7 0.0% 4 0.0% 75.0% 84 0.0% 42 0.0% ...
Automotive Sales Data Updated at: 2016/05/02
Japan - Flash report, Sales volume, 2014
73.7% Lotus 19 0.1% 21 0.1% -9.5% 321 0.1% 305 0.1% 5.2% Bentley 28 0.1% 72 0.2% -61.1% 317 0.1% 293 0.1% 8.2% Lamborghini 15 0.0% 14 0.0% 7.1% 187 0.1% 190 0.1% -1.6% Aston Martin 18 0.0% 22 0.1% -18.2% 168 0.1% 209 0.1% -19.6% Rolls Royce 15 0.0% 18 0.1% -16.7% 154 0.0% 116 0.0% 32.8% GMC 10 0.0% 13 0.0% -23.1% 92 0.0% 110 0.0% -16.4% Hyundai 3 0.0% 8 0.0% -62.5% 92 0.0% 66 0.0% 39.4% Mclaren 10 0.0% 7 0.0% 42.9% 88 0.0% 84 0.0%...
Automotive Sales Data Updated at: 2016/04/28
Japan - Flash report, Sales volume, 2015
4 0.2% -41.3% Lotus 15 0.0% 19 0.1% -21.1% 271 0.1% 321 0.1% -15.6% Aston Martin 19 0.1% 18 0.0% 5.6% 164 0.0% 168 0.1% -2.4% Rolls Royce 10 0.0% 15 0.0% -33.3% 156 0.0% 154 0.0% 1.3% Mclaren 13 0.0% 10 0.0% 30.0% 90 0.0% 88 0.0% 2.3% Hyundai 14 0.0% 3 0.0% 366.7% 82 0.0% 92 0.0% -10.9% GMC 1 0.0% 10 0.0% -90.0% 50 0.0% 92 0.0% -45.7% Rover 5 0.0% 3 0.0% 66.7% 47 0.0% 38 0.0% 23.7% Scania 3 0.0% 3 0.0% 0.0% 47 0.0% 43 0.0% 9.3% ...
Automotive Sales Data Updated at: 2016/04/26
Global Sales of Major Automakers and Groups
Automakers and Groups Maker / Group *1 2009 (units in thousands) 2008 (units in thousands) Y-o-Y Toyota Group Toyota 6,980 7,996 -12.7% Daihatsu 755 866 -12.8% Hino 79 110 -28.2% Total 7,813 8,972 -12.9% GM Chevrolet n.a. 4,120 -% Opel/Vauxhall n.a. 1,503 -% Wuling n.a. 606 -% GMC n.a. 481 -% Buick n.a. 435 -% Pontiac n.a. 383 -% Saturn n.a. 207 -% Cadillac n.a. 187 -% Holden n.a. 139 -% Daewoo n.a. 121 -% Saab...
Automotive Sales Data Updated at: 2016/04/24


 Japan
Japan USA
USA Mexico
 Germany
 China (Shanghai)
 Thailand
 India
India