


Search Results by Category
All information related to {{ key_word }}.
AI Navigator will guide you. Click here for information about {{ key_word }}.
Images
 2
2
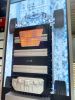
Compact Exhaust System
 2
2
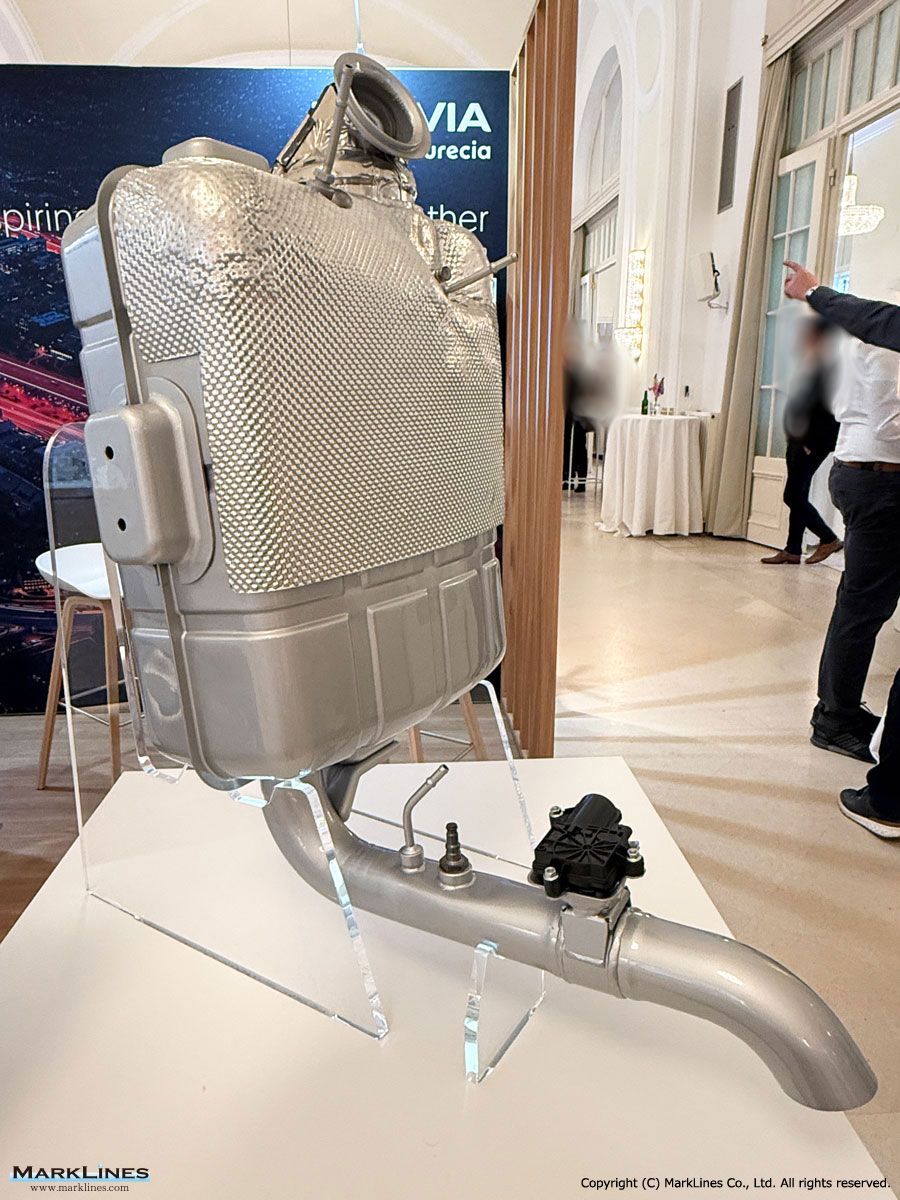
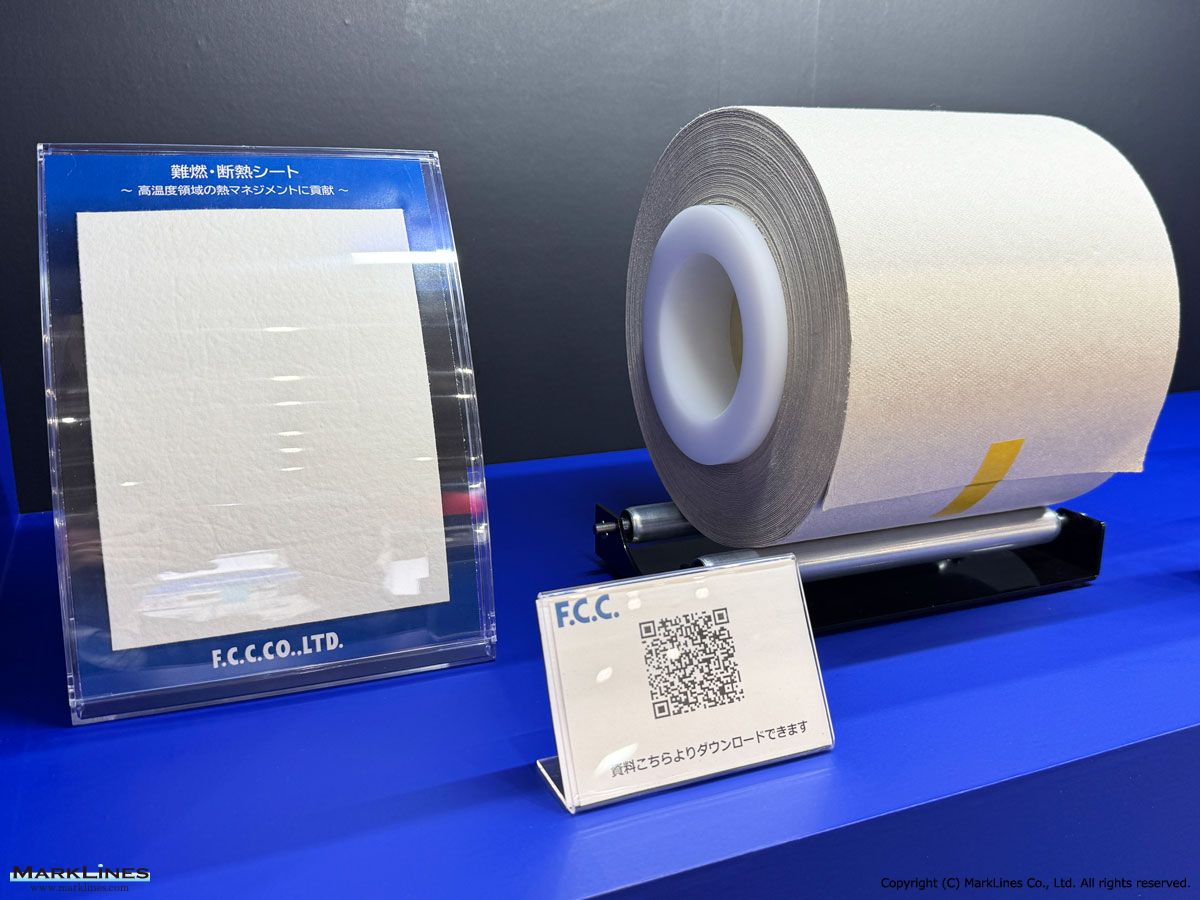
Flame-Retardant and Heat-Insulating Sheet (Ultra-High Temperature Range)
 2
2
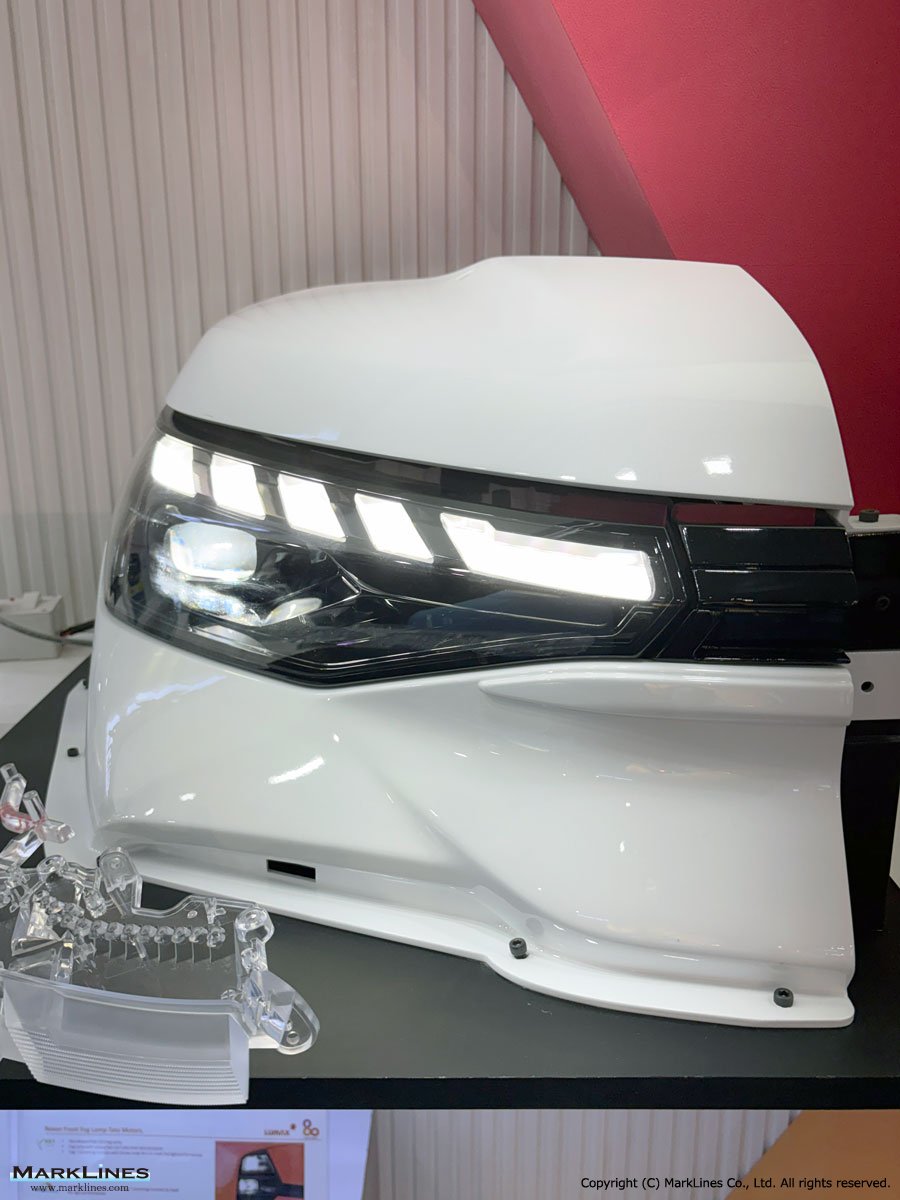
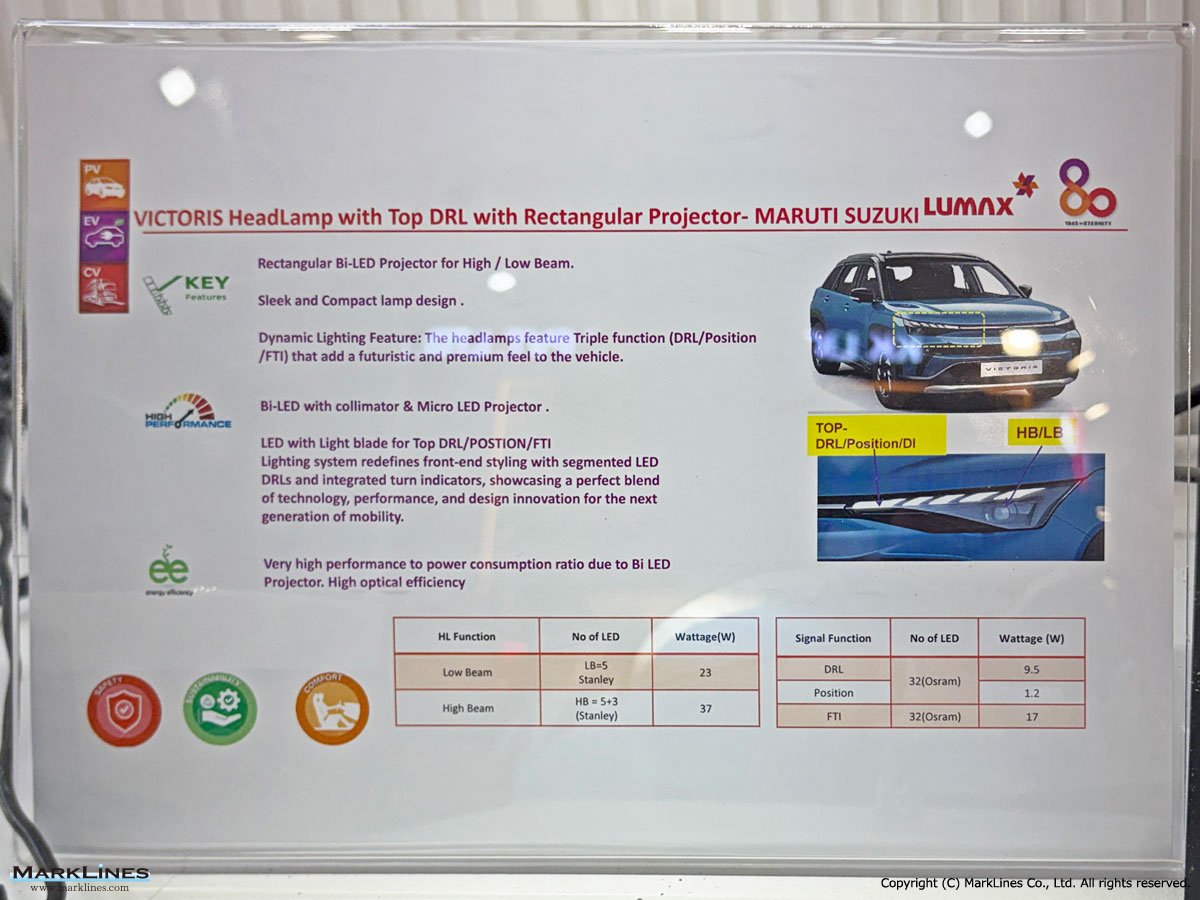
Top DRL with rectangular projector
 1
1
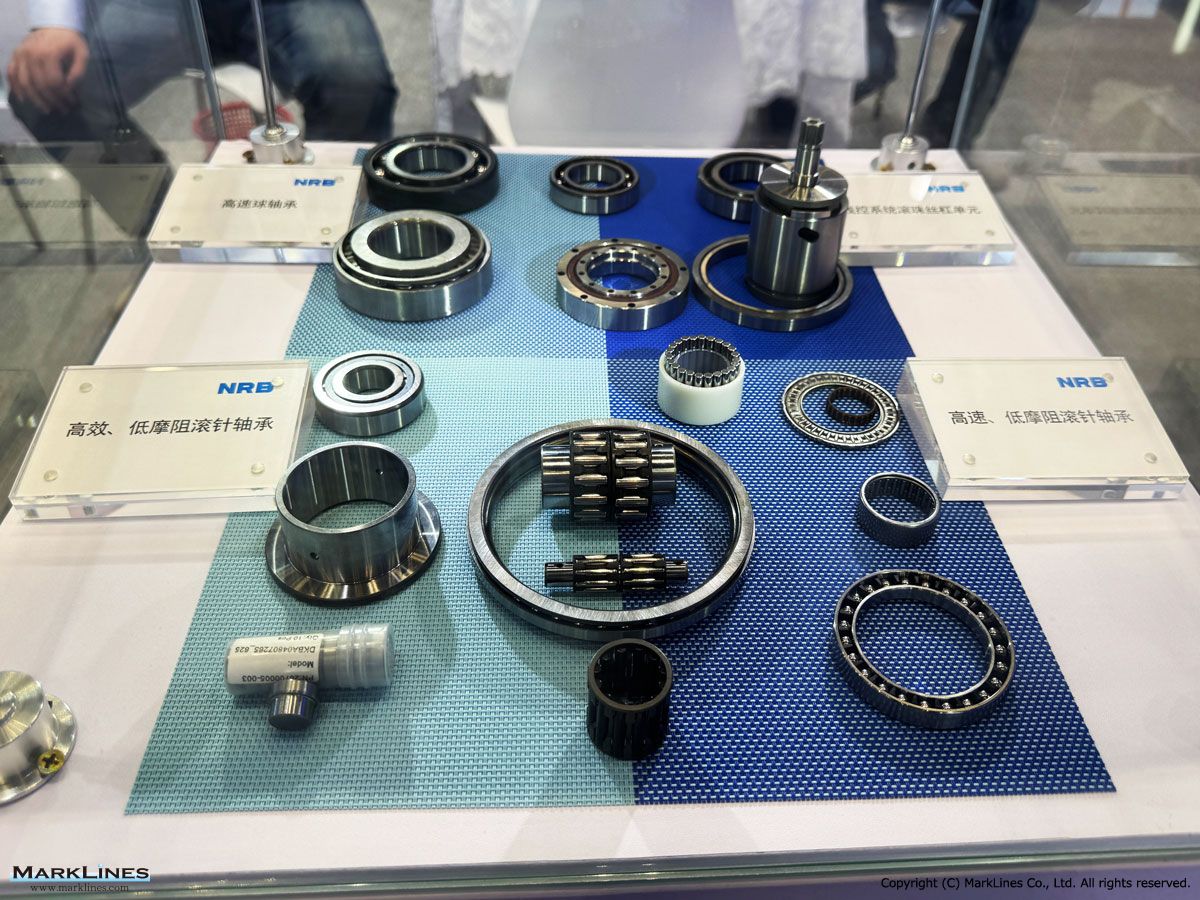
Various types of bearings
 4
4
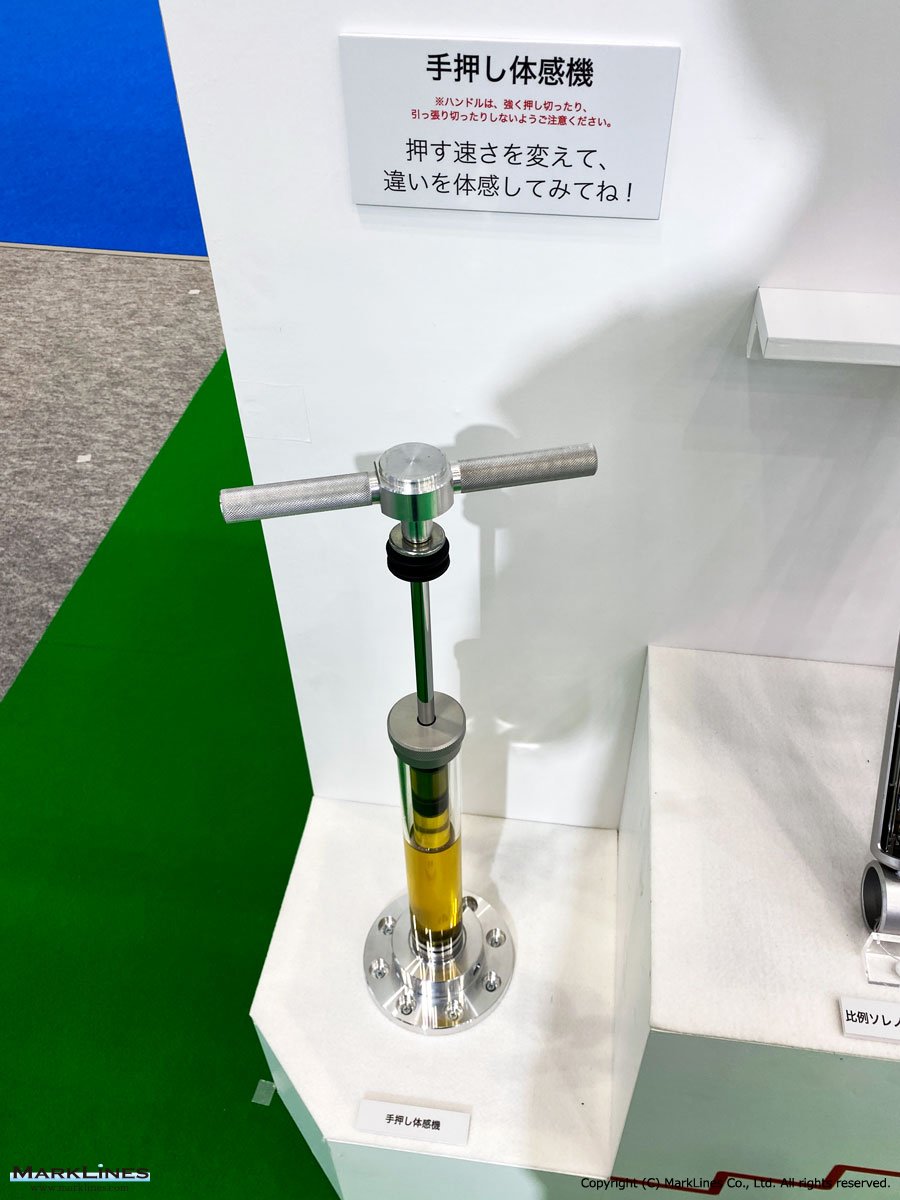
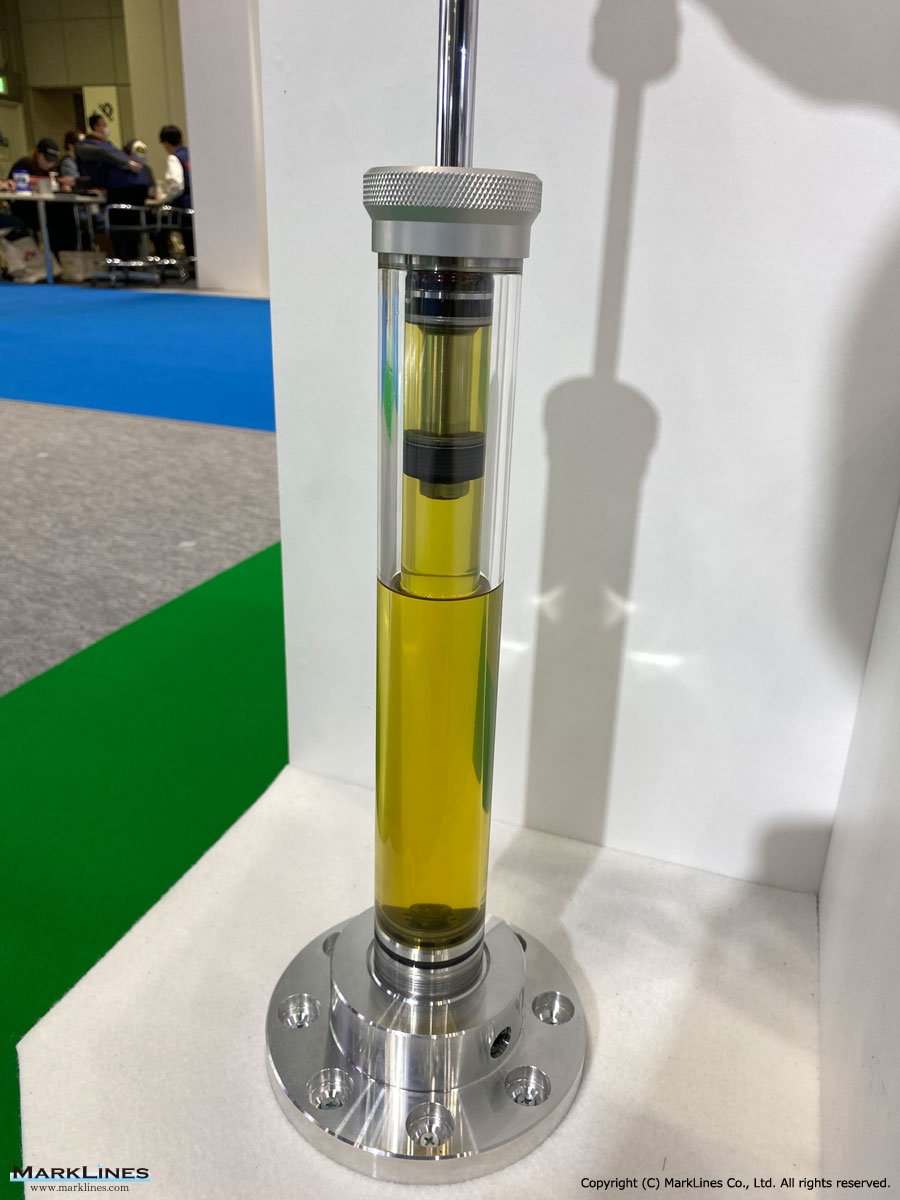
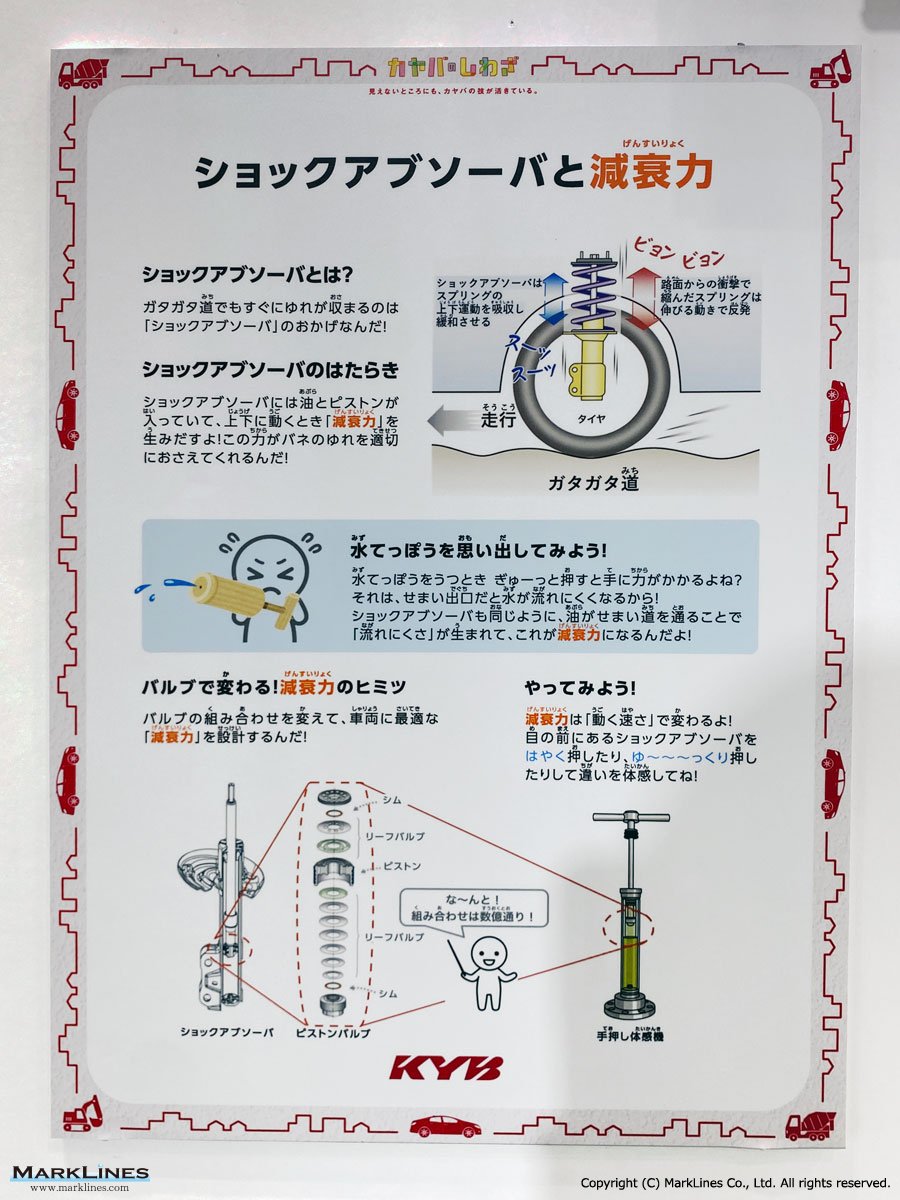
Shock Absorber Push Experience Machine
 1
1
Ceramic Paper - Alumina (Top left), Ceramic Paper - Zirconia (Top right), Ceramic plate Aluminum Oxide (Bottom right)
 2
2
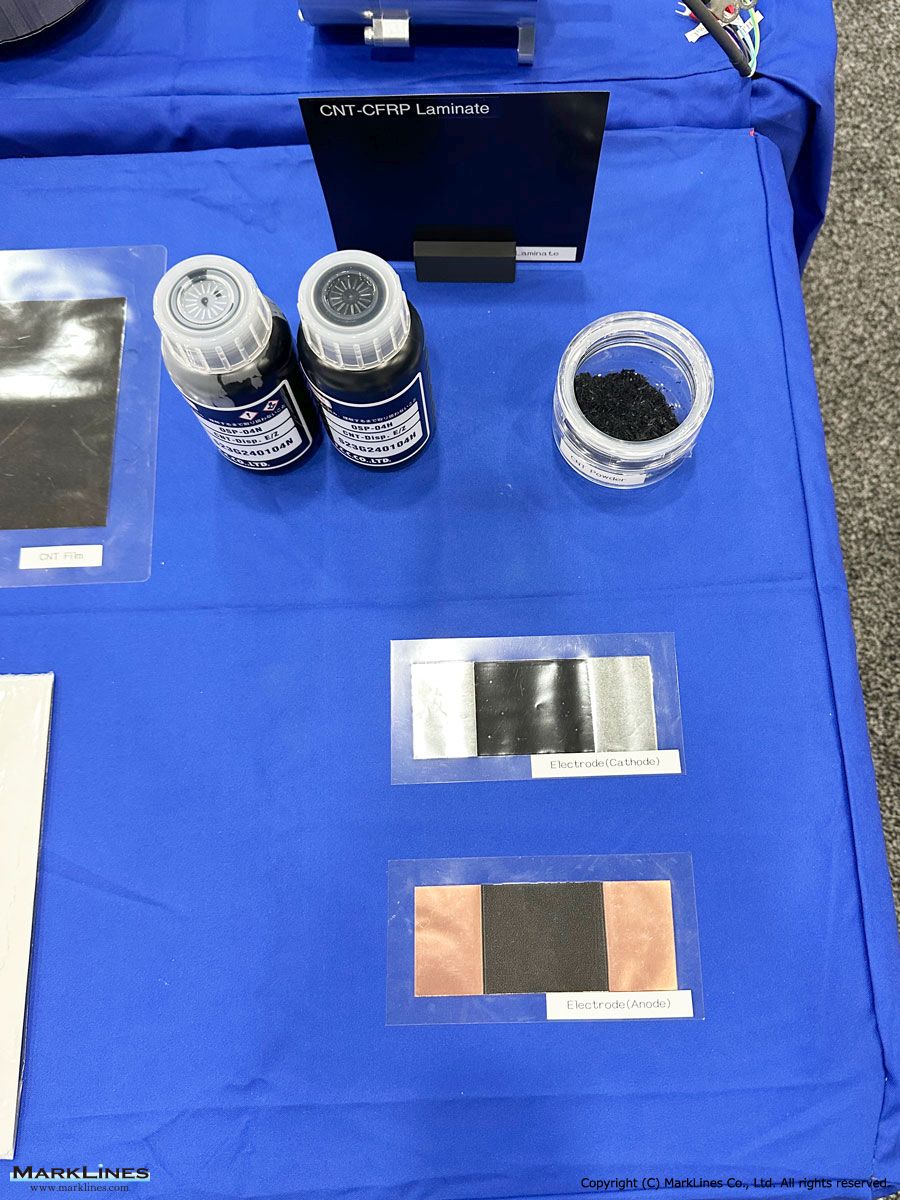
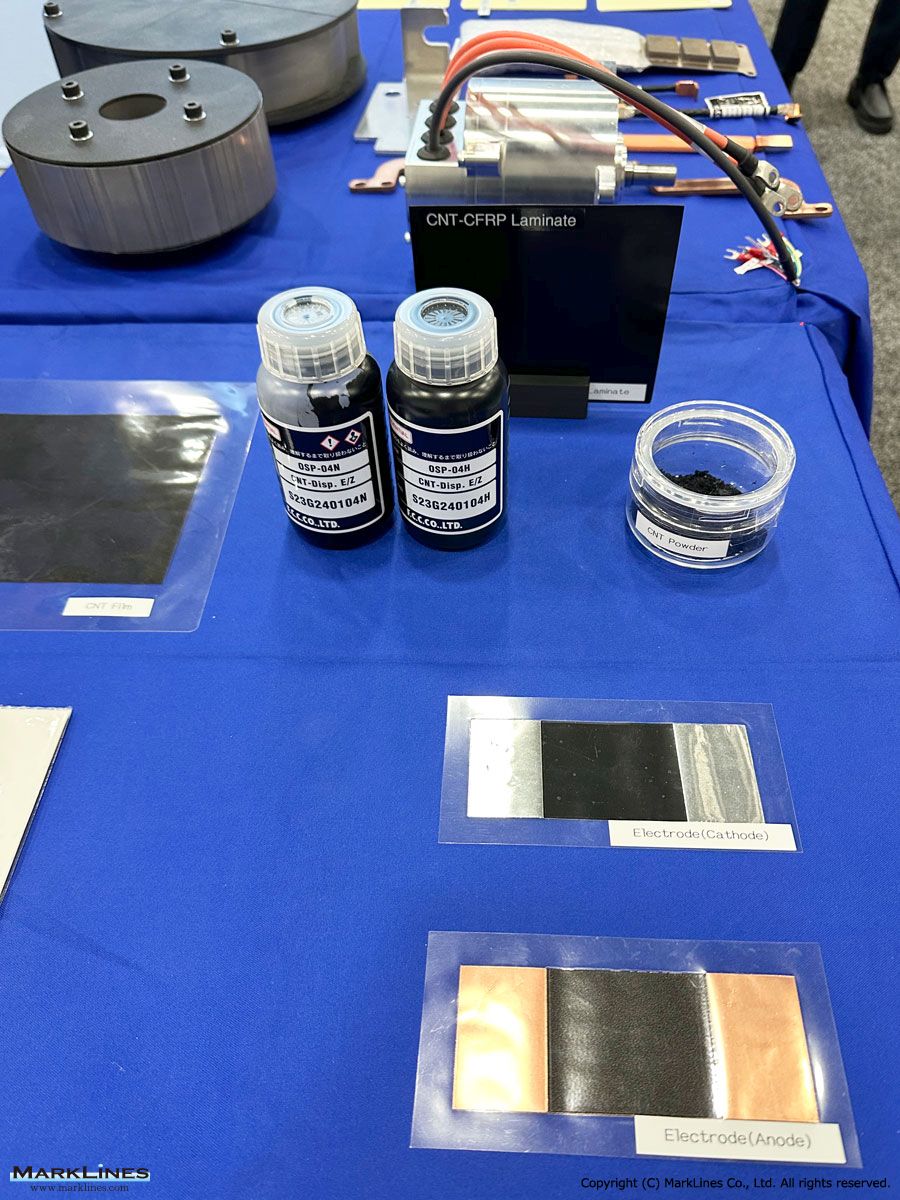
Top : CNT powder, Middle : Electrode (Cathode), Bottom : Electrode (Anode)
 1
1
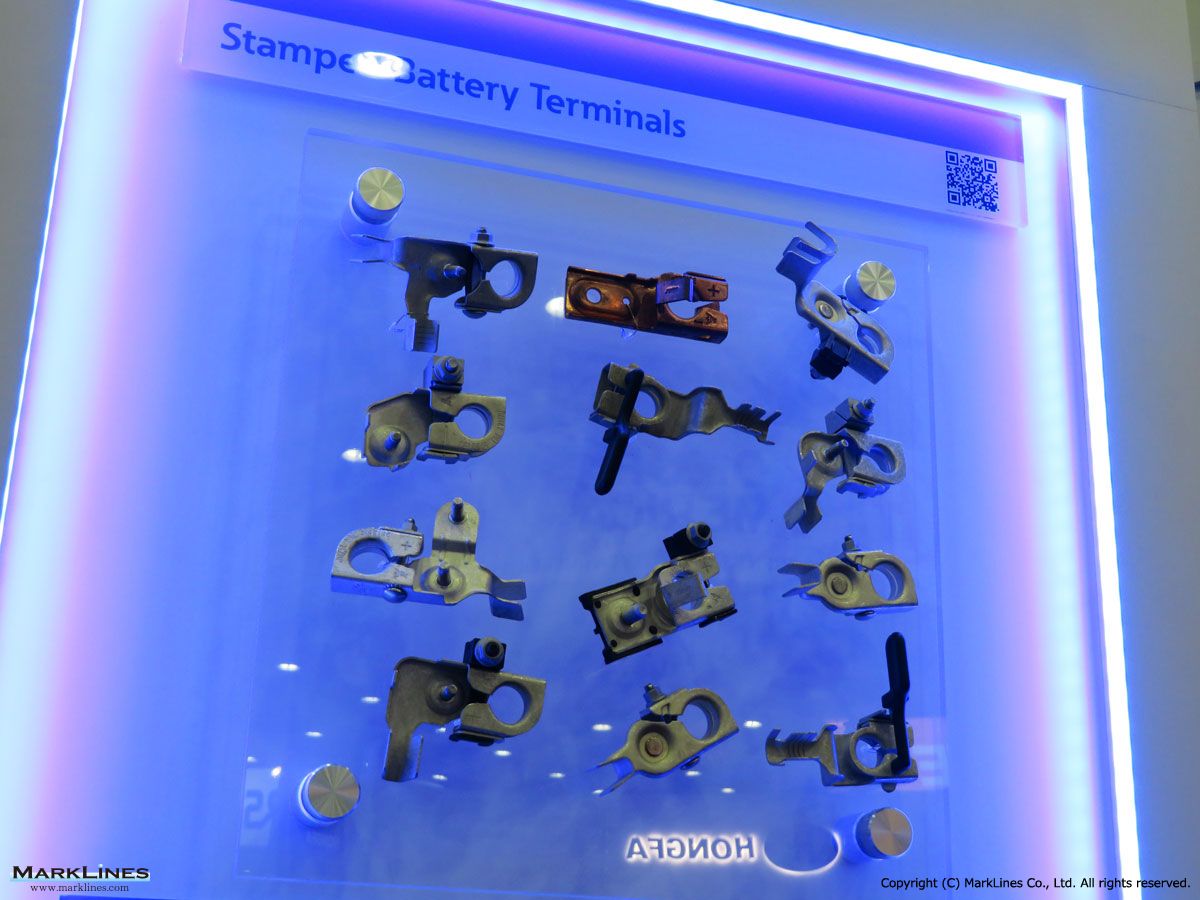
Stamped battery terminals
 1
1
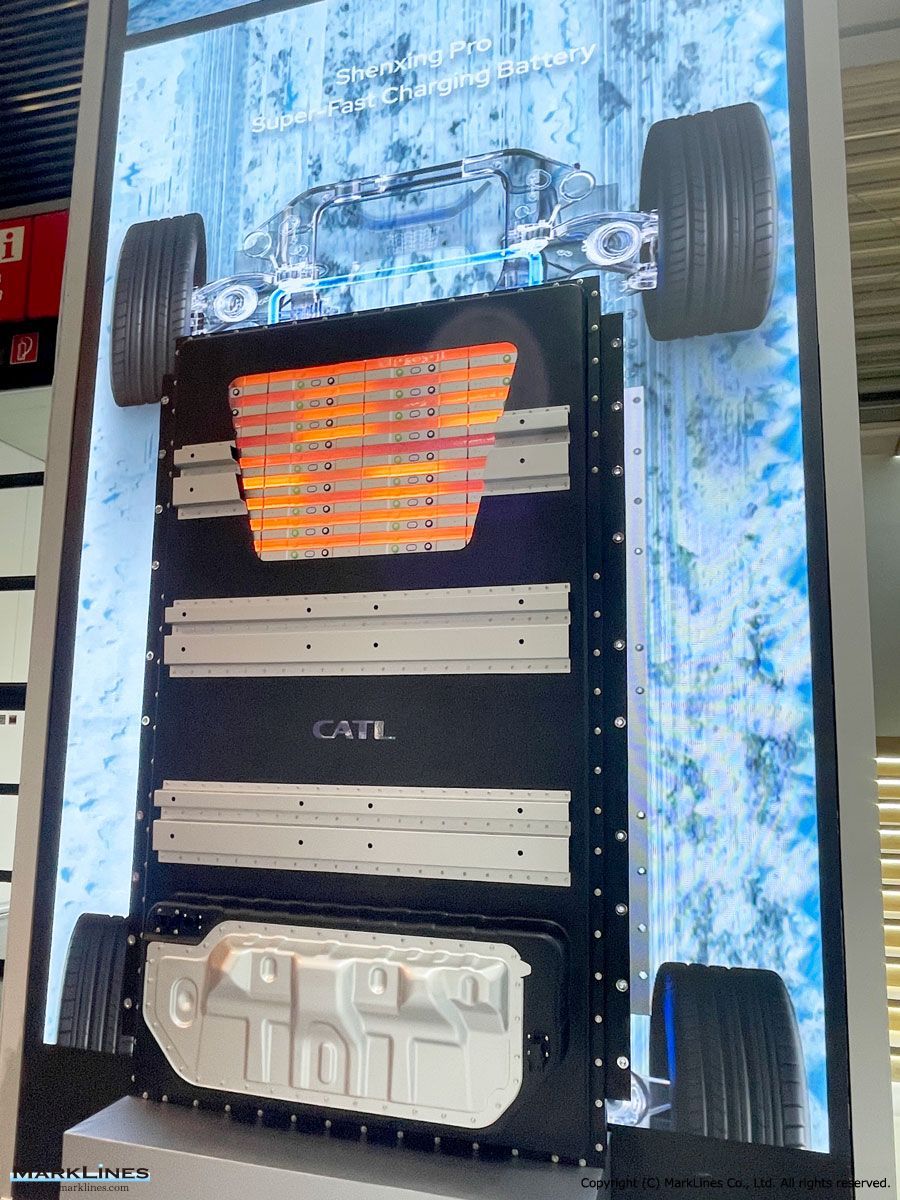
Shenxing Pro
 3
3
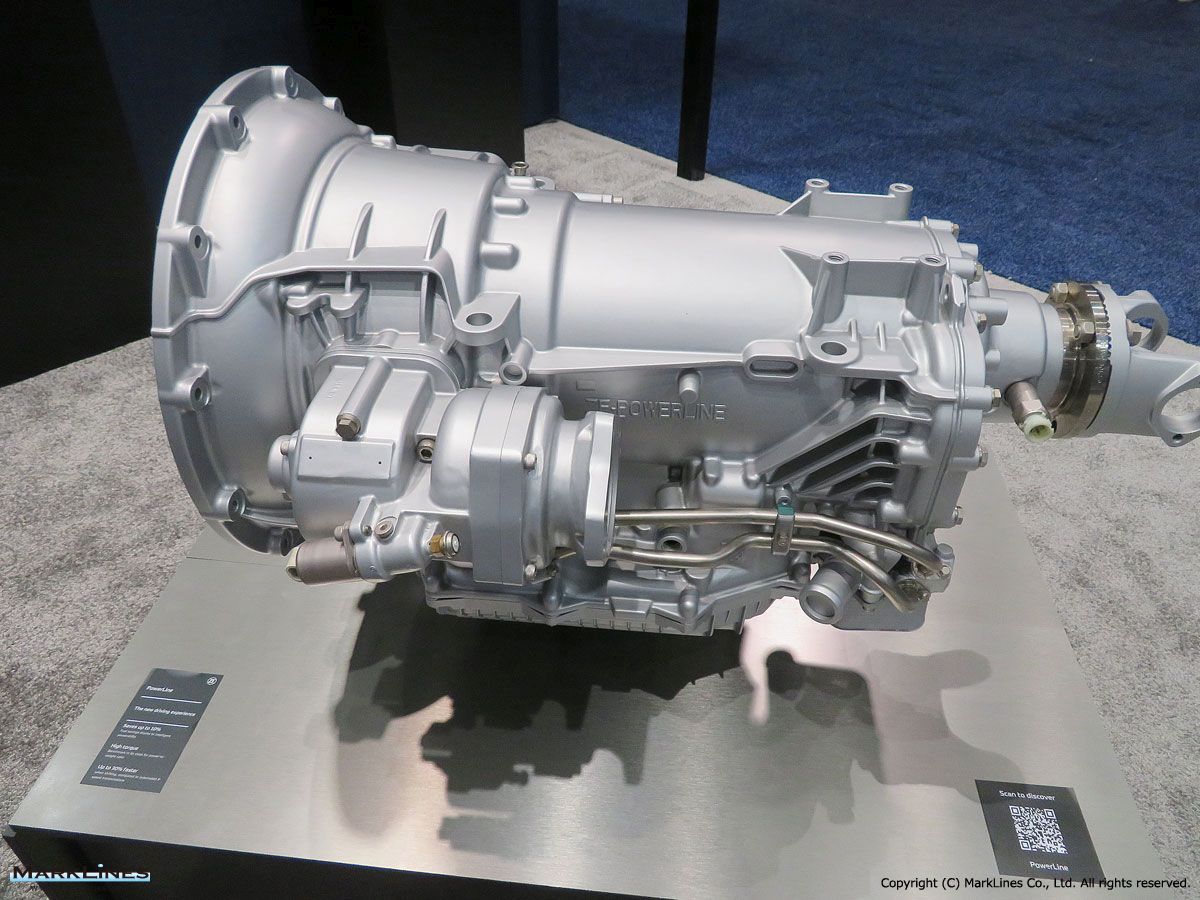
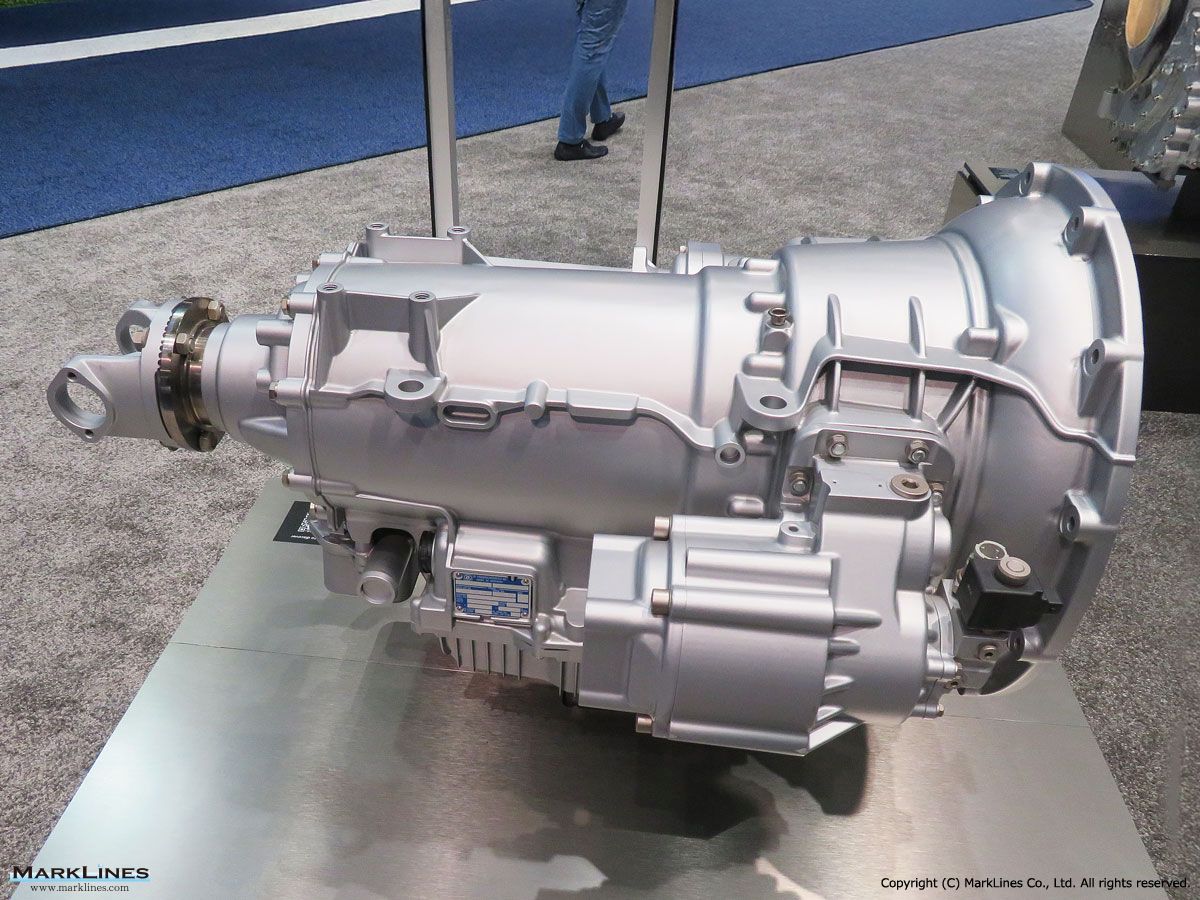
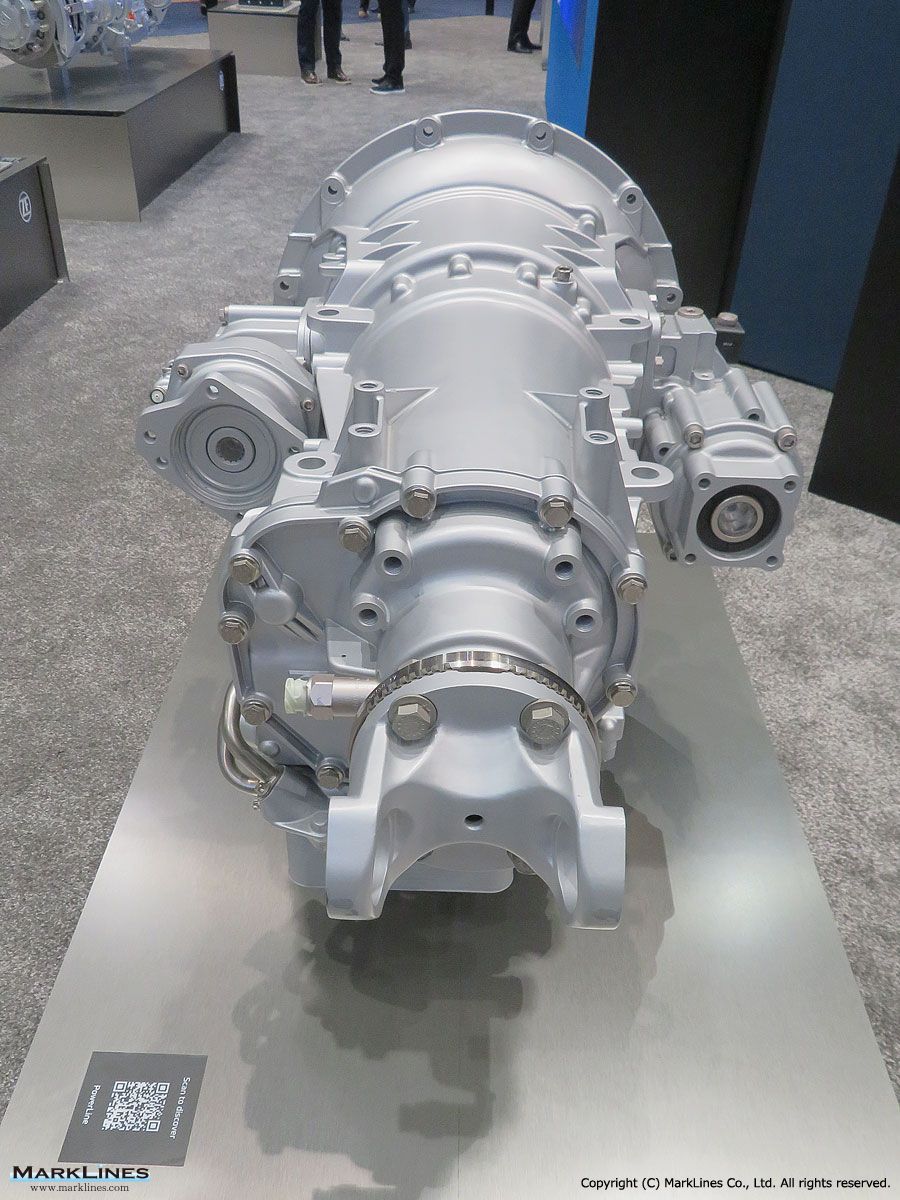
PowerLine 8-speed automatic transmission
Sort by :
1 - 20 of 132 results
Russia - New car sales in 2026 by OEM, vehicle type
170 100,390 15.7% 377,176 342,278 10.2% Light commercial vehicles 5,925 7,687 -22.9% 19,795 25,830 -23.4% Pickups 1,687 1,860 -9.3% 5,907 7,141 -17.3% Trucks 4,944 4,985 -0.8% 16,745 21,588 -22.4% Buses 795 938 -15.2% 2,707 2,929 -7.6% Total 129,521 115,860 11.8% 422,330 399,766 5.6% Top 10 best selling Makers/Brands Passenger Cars - Makers/Brands 2026 2025 Y-o-Y 2026 2025 Y-o-Y Apr. Share Apr. Share Jan.-Apr. Share Jan.-Apr....
Automotive Sales Data Updated at: 2026/05/15
China - New car sales in 2026 by OEM, model, vehicle type
.0 -3.2 Source:CAAM, Each maker's press releases *The below data may differ from the sales volume by make (shipped from the local plant) to be released later on our data for monthly sales volume.This is due to the difference in calculation methods. Passenger Car retail sales by Chinese Makers Top10 - Maker Apr. 2026 (10,000) Y-o-Y 1 BYD Auto 18.2 -32.3% 2 Geely Automobile 15.2 -27.4% 3 Changan Automobile 9.5 -11.0% 4 FAW-VW 7.5 -...
Automotive Sales Data Updated at: 2026/05/15
Mexico - New car sales in 2026 by OEM, vehicle type
as the best-selling brand with 19,230 units delivered in April, an increase of 0.1% from the previous year. General Motors ranked second with 15,807 units, posting an increase of 6.0%, followed by Volkswagen Group with 12,950 units, up 5.0%; Toyota sold 10,713 units, up 18.7%; and KIA completed the top five with 8,604 units sold, representing a 2.8% year-over-year increase.Regarding performance of Chinese brands, MG Motor led the group with 4,256...
Automotive Sales Data Updated at: 2026/05/12
Monthly Sales by Major Automakers and Groups, 2026
Monthly Sales by Major Automakers and Groups, 2026 Home Automotive Sales Data Sales of Major OEM and Group (ML aggregate value) Sales of Major OEM and Group (ML aggregate value) 2025 2026 Top 10 Monthly Sales Volume 2026 Top 10 Monthly Sales Volume 2026 (000 units) - Jan. Feb. Mar. Apr. May Jun. Jul. Aug. Sep. Oct. Nov. Dec. Group Units Share Group Units Share Group Units Share Group Units Share Group Units Share Group Uni...
Automotive Sales Data Updated at: 2026/05/11
Germany - New car sales in 2026 by OEM, model, vehicle type
ding Lexus, fell 1.4% to 7,283 units (2.5% share). Chinese makers’ sales continued to grow: BYD sales were up 327.1% to 3,438 units (1.2% share), Leapmotor sales were up 318.1% to 1,388 units (0.5% share) and XPeng sales were up 211.9% to 549 units (0.2% share). However, the combined sales of the top three Chinese brands are still below those of Toyota.Sales of gasoline vehicles were down 4.9% to 66,959 units (22.8% share), hybrid vehicles (HEV...
Automotive Sales Data Updated at: 2026/05/11
Japan - New car sales in 2026 by OEM, model, vehicle type
ta 263 17.7% 622 33.3% -57.7% 456 15.1% 1,071 29.8% -57.4% Nissan 75 5.0% 122 6.5% -38.5% 160 5.3% 228 6.3% -29.8% Others 2 0.1% 14 0.7% -85.7% 66 2.2% 79 2.2% -16.5% Total 1,489 100.0% 1,868 100.0% -20.3% 3,016 100.0% 3,599 100.0% -16.2% Source: Japan Automobile Dealers AssociationJapan - Top 10 best selling models - Maker/Brand Model Mar. 2026 Mar. 2025 Y-o-Y Jan.-Mar.2026 Jan.-Mar.2025 Y-o-Y 1 Honda N BOX 21,342 23,627 -9.7% 56...
Automotive Sales Data Updated at: 2026/05/11
USA - New car sales in 2026 by OEM, model, vehicle type
8 1,914 -23.8% 3,973 5,312 -25.2% Share 0.1% 0.1% 0.0 pt 0.1% 0.1% 0.0 pt Grand Total *2 Total 1,397,835 1,593,277 -12.3% 3,694,433 3,922,981 -5.8% Share 100.0% 100.0% 0.0 pt 100.0% 100.0% 0.0 pt Source: Releases by each company, MarkLines Data Center *1 Includes Sprinter *2 EstimatesUSA - Top 10 best selling models - Maker/Brand Model Mar. 2026 Mar. 2025 Y-o-Y Jan.-Mar.2026 Jan.-Mar.2025 Y-o-Y 1 Ford Ford F-Series 58,501 66,911 -...
Automotive Sales Data Updated at: 2026/05/11
UK - New car sales in 2026 by OEM, vehicle type
rmakers, Toyota sales declined 7.6% to 17,105 units (4.5% share), while sales of BYD soared 134.0% to 15,162 units (4.0% share).By model, the best-selling cars in March 2026 was Jaecoo 7 C segment SUV with 10,064 units. Chery’s premium brand Jaecoo became the first Chinese car brand that took the top spot in the UK. Ford Puma took the second place with 9,193 units, followed by Nissan Qashqai (8,718 units), Kia Sportage (7,310 units) and Vauxhal...
Automotive Sales Data Updated at: 2026/05/07
Australia - New car sales in 2026 by OEM, vehicle type
025 Y-o-Y Passenger Cars 11,005 12,573 -12.5% 50,113 52,306 -4.2% SUV 61,191 54,179 12.9% 234,659 230,095 2.0% Commercial Vehicles 17,408 20,436 -14.8% 78,584 84,786 -7.3% Heavy Commercial Vehicles 2,987 3,426 -12.8% 12,097 13,830 -12.5% Total 92,591 90,614 2.2% 375,453 381,017 -1.5% Top 10 best selling Makers/Brands - Maker/Brand 2026 2025 Y-o-Y 2026 2025 Y-o-Y Apr. Share Apr. Share Jan.-Apr. Share Jan.-Apr. Share 1 Toyota ...
Automotive Sales Data Updated at: 2026/05/07
Argentina - New car sales in 2026 by OEM, vehicle type
14 15,549 -20.2% 54,751 61,360 -10.8% Heavy Commercial Vehicles 2,031 2,035 -0.2% 7,381 7,501 -1.6% Other 1,189 1,036 14.8% 4,288 3,797 12.9% Total 47,564 55,025 -13.6% 205,114 217,500 -5.7% Source: Asociacion de Concesionarios de Automotores de la Republica Argentina (ACARA) Argentina - Top 10 best selling Makers/Brands - Maker/Brand Apr. 2026 Apr. 2025 Y-o-Y 2026 2025 Y-o-Y 1 TOYOTA 6,691 9,759 -31.4% 25,937 35,073 -26.0% 2 VO...
Automotive Sales Data Updated at: 2026/05/01
Thailand - New car sales in 2026 by OEM, model, vehicle type
,193 18.9% Export (CBU) 80,394 80,914 -0.6% 219,994 224,471 -2.0% Source: FTI (Federation of Thai Industries), various media reports * Data is updated regularly, these figures may change.* Sales data by make have not been updated. They will be updated as soon as we obtain the data. Thailand - Top 10 best selling models - Maker/Brand Model Mar. 2026 Mar. 2025 Y-o-Y Jan.-Mar.2026 Jan.-Mar.2025 Y-o-Y 1 Toyota Hilux 7,147 5,965 19.8% 18...
Automotive Sales Data Updated at: 2026/04/27
Monthly Sales by Major Automakers and Groups, 2025
Monthly Sales by Major Automakers and Groups, 2025 Home Automotive Sales Data Sales of Major OEM and Group (ML aggregate value) Sales of Major OEM and Group (ML aggregate value) 2025 2026 Top 10 Monthly Sales Volume 2025 Top 10 Monthly Sales Volume 2025 (000 units) - Jan. Feb. Mar. Apr. May Jun. Jul. Aug. Sep. Oct. Nov. Dec. Group Units Share Group Units Share Group Units Share Group Units Share Group Units Share Group Units ...
Automotive Sales Data Updated at: 2026/03/10
Russia - New car sales in 2025 by OEM, vehicle type
6,299 1,550,249 -15.7% Light commercial vehicles 8,816 11,207 -21.3% 82,988 108,535 -23.5% Pickups 2,447 2,643 -7.4% 21,992 29,199 -24.7% Trucks 6,721 8,686 -22.6% 61,556 126,165 -51.2% Buses 2,501 2,209 13.2% 12,836 19,704 -34.9% Total 154,736 145,661 6.2% 1,485,671 1,833,852 -19.0% Top 10 best selling Makers/Brands Passenger Cars - Makers/Brands 2025 2024 Y-o-Y 2025 2024 Y-o-Y Dec. Share Dec. Share Jan.-Dec. Share Jan.-Dec....
Automotive Sales Data Updated at: 2026/03/03
Philippines - New car sales in 2025 by vehicle type
6.8% YoY increase. Commercial vehicles continued to dominate with 92,742 units sold, while passenger car sales reached 24,332 units.Sales of electrified vehicles reached 5,311 units in Q1/2025, comprising 4,544 HEVs, 692 BEVs, and 75 PHEVs.Toyota, Mitsubishi, Nissan, Suzuki, and Ford emerged as the top-performing automotive brands in the market during the period. Philippines - Sales of new vehicles Type Mar. 2025 Mar. 2024 Y-o-Y Jan. -Mar. 202...
Automotive Sales Data Updated at: 2026/02/26
Thailand - New car sales in 2025 by OEM, model, vehicle type
-% Neta N/A -% N/A -% -% N/A -% N/A -% -% Xpeng N/A -% N/A -% -% N/A -% N/A -% -% Total 25,295 100.0% 11,334 100.0% 123.2% 166,622 100.0% 117,413 100.0% 41.9% Source: Toyota Motor Thailand Co., Ltd. (TMT) *1 Data announced by TMT. * Y-o-Y is based on MarkLines' own calculation. Thailand - Top 10 best selling models - Maker/Brand Model Dec. 2025 Dec. 2024 Y-o-Y Jan.-Dec. 2025 Jan.-Dec. 2024 Y-o-Y 1 Toyota Hilux 3,917 3,712 5.5% 61,...
Automotive Sales Data Updated at: 2026/02/24
China - New car sales in 2025 by OEM, model, vehicle type
c. 2025 Jan.-Dec. 2025 Units (10,000) Share(%) Y-o-Y(%) Units (10,000) Share(%) Y-o-Y(%) EV 112.0 65.2 18.9 1073.7 64.6 38.4 PHV 59.5 34.6 1.2 588.1 35.4 14.8 FCV 0.3 0.17 952.6 0.8 0.05 49.6 Total 171.8 100.0 12.3 1662.6 100.0 29.0 Source:CAAM, Each maker's press releasesChina - Top 10 best selling models - Maker/Brand Model Dec. 2025 Dec. 2024 Y-o-Y Jan.- Dec. 2025 Jan.- Dec. 2024 Y-o-Y 1 Tesla Model Y 66,189 61,984 6.8...
Automotive Sales Data Updated at: 2026/02/10
UK - New car sales in 2025 by OEM, vehicle type
sales increased 2.1% to 19,250 units (13.3% share), plug-in hybrid electric (PHEV) car sales surged 27.2% to 17,601 units (12.1% share) and diesel-engine car sales dropped 22.9% to 6,907 units (4.8% share).The latest quarterly industry outlook forecasts that the overall new car market for 2025 will top two million units (2.012 million) for the first time since pre-pandemic 2019, with BEVs expected to account for 23.3% of uptake. For 2026, the ove...
Automotive Sales Data Updated at: 2026/02/06
Germany - New car sales in 2025 by OEM, model, vehicle type
- -% 148 - -% Share 0.0% -% -% 0.0% -% -% Others Total 1,201 969 23.9% 12,890 12,193 5.7% Share 0.5% 0.4% 0.1 pt 0.5% 0.4% 0.0 pt Grand Total Total 246,439 224,721 9.7% 2,857,591 2,817,331 1.4% Share 100.0% 100.0% 0.0 pt 100.0% 100.0% 0.0 pt Source: Kraftfahrt-Bundesamt (KBA)Germany - Top 10 best selling models - Maker/Brand Model Dec. 2025 Dec. 2024 Y-o-Y Jan.-Dec. 2025 Jan.-Dec. 2024 Y-o-Y 1 VW Golf 7,244 7,922 -8.6% 85,023 1...
Automotive Sales Data Updated at: 2026/02/05
Australia - New car sales in 2025 by OEM, vehicle type
its represented a 11.6% decrease.Among the companies, in December, Toyota sales decreased 0.6% to 18,541 units, Ford sales increased 2.8% to 8,541 units, Mazda sales increased 4.2% to 7,562 units, Kia sales decreased 3.2% to 6,101 units and Hyundai sales increased 12.2% to 5,640 units. In 2025, the top three manufacturers, Toyota, Ford, and Mazda, saw decreases of 0.6%, 5.8%, and 4.2% respectively compared to the previous year, while Great Wall M...
Automotive Sales Data Updated at: 2026/02/04
USA - New car sales in 2025 by OEM, model, vehicle type
N/A -% Share -% -% -% -% -% -% Others Total 1,570 2,532 -38.0% 19,683 21,520 -8.5% Share 0.1% 0.2% -0.1 pt 0.1% 0.1% 0.0 pt Grand Total *2 1,476,588 1,499,627 -1.5% 16,390,701 15,960,890 2.7% Source: Releases by each company, MarkLines Data Center *1 Includes Sprinter *2 Estimates USA - Top 10 best selling models - Maker/Brand Model Dec. 2025 Dec. 2024 Y-o-Y Jan.-Dec. 2025 Jan.-Dec. 2024 Y-o-Y 1 Ford Ford F-Series 73,623 74,35...
Automotive Sales Data Updated at: 2026/02/04


 Japan
Japan USA
USA Mexico
 Germany
 China (Shanghai)
 Thailand
 India
India