


Search Results by Category
All information related to {{ key_word }}.
AI Navigator will guide you. Click here for information about {{ key_word }}.
Images
 4
4
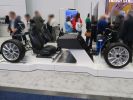
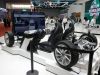
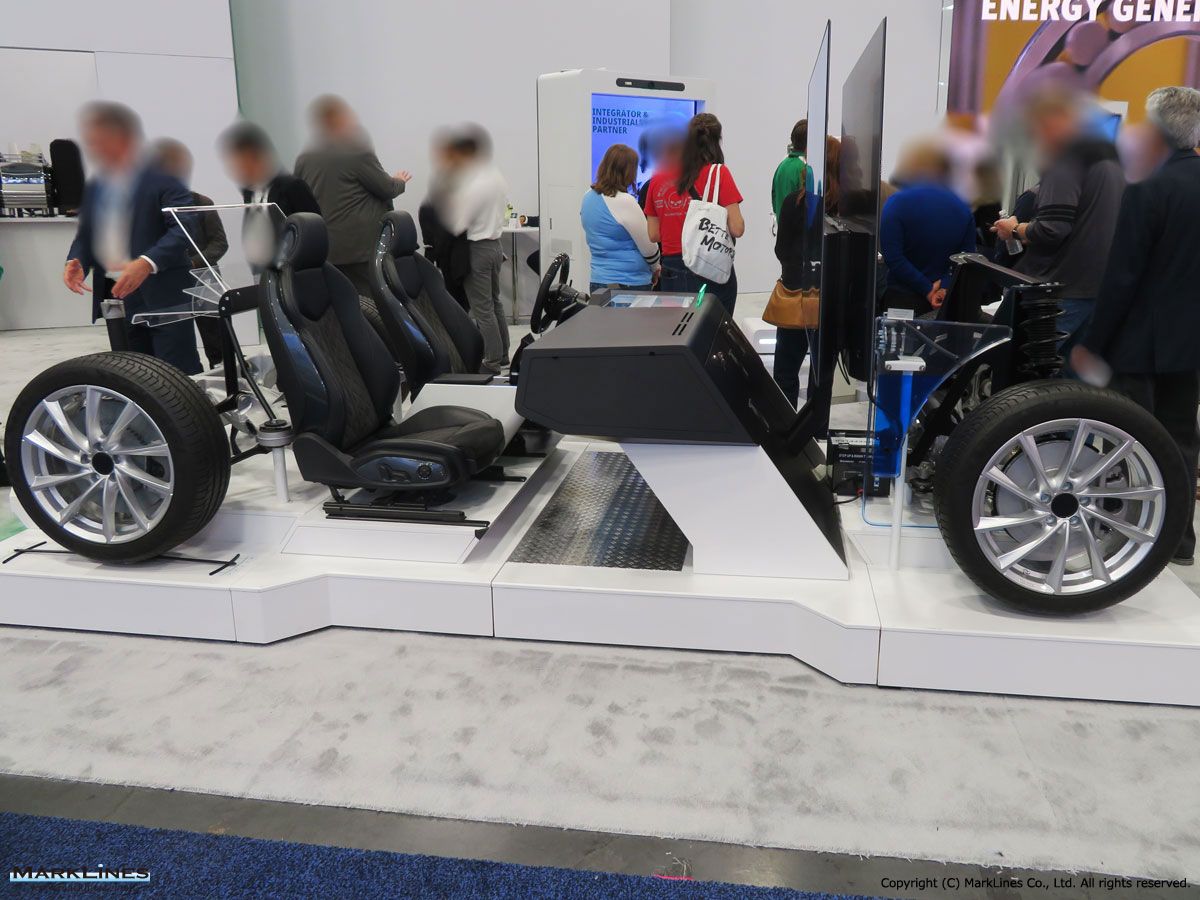
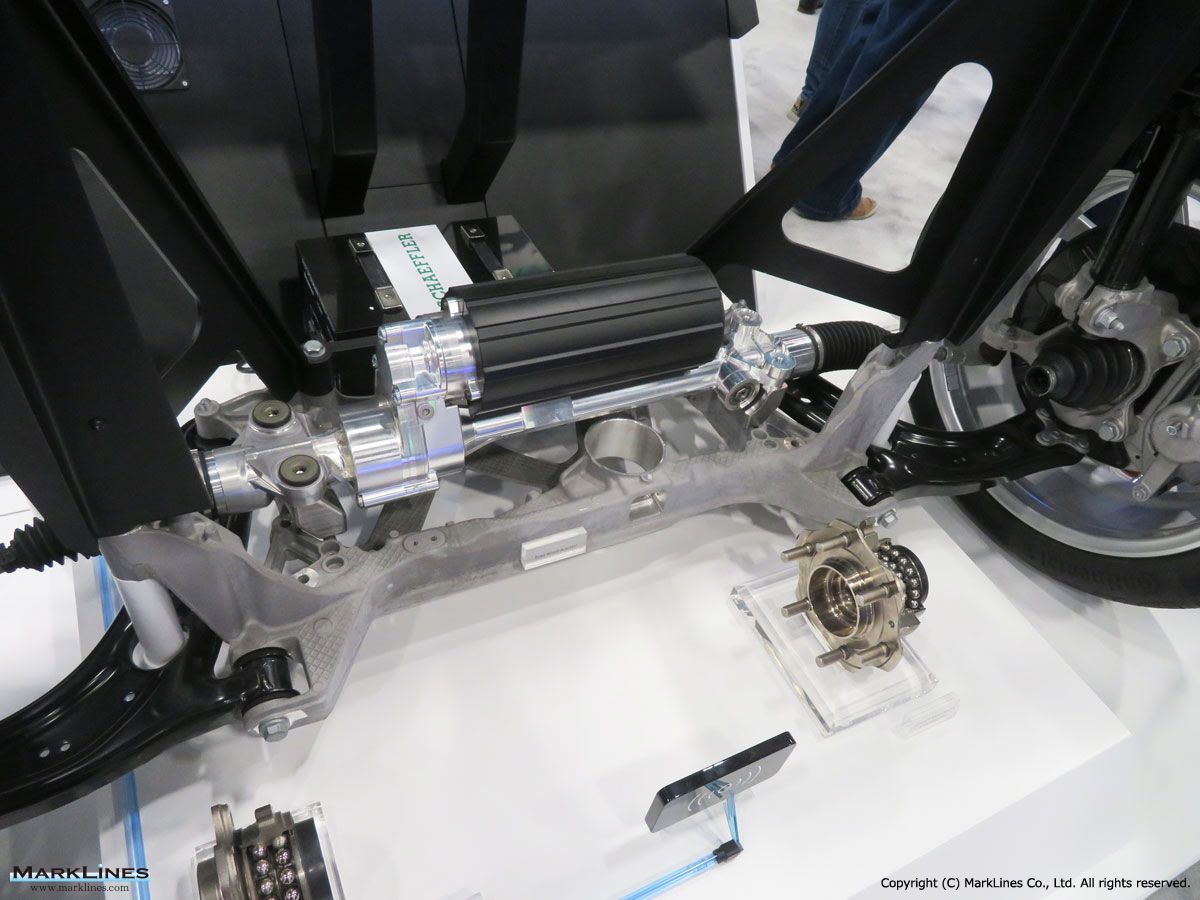
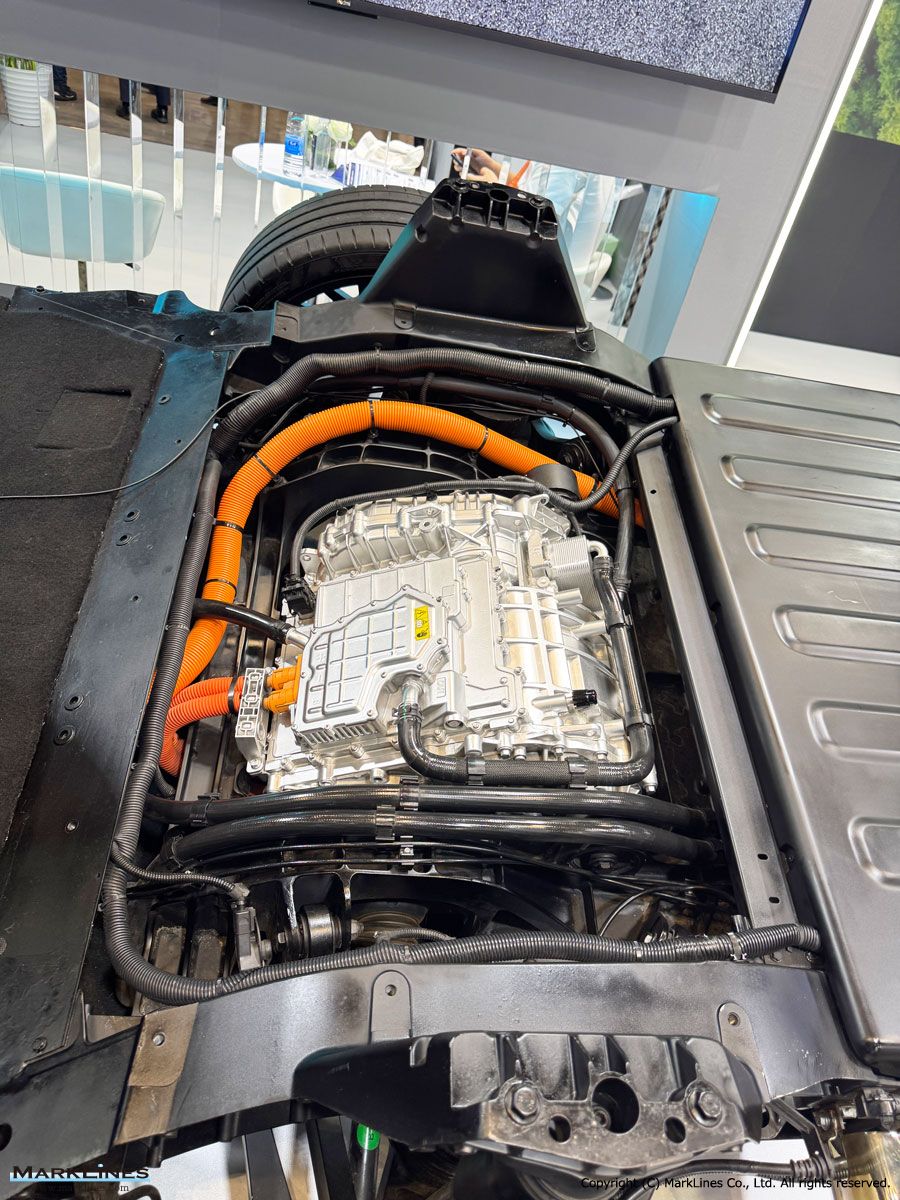
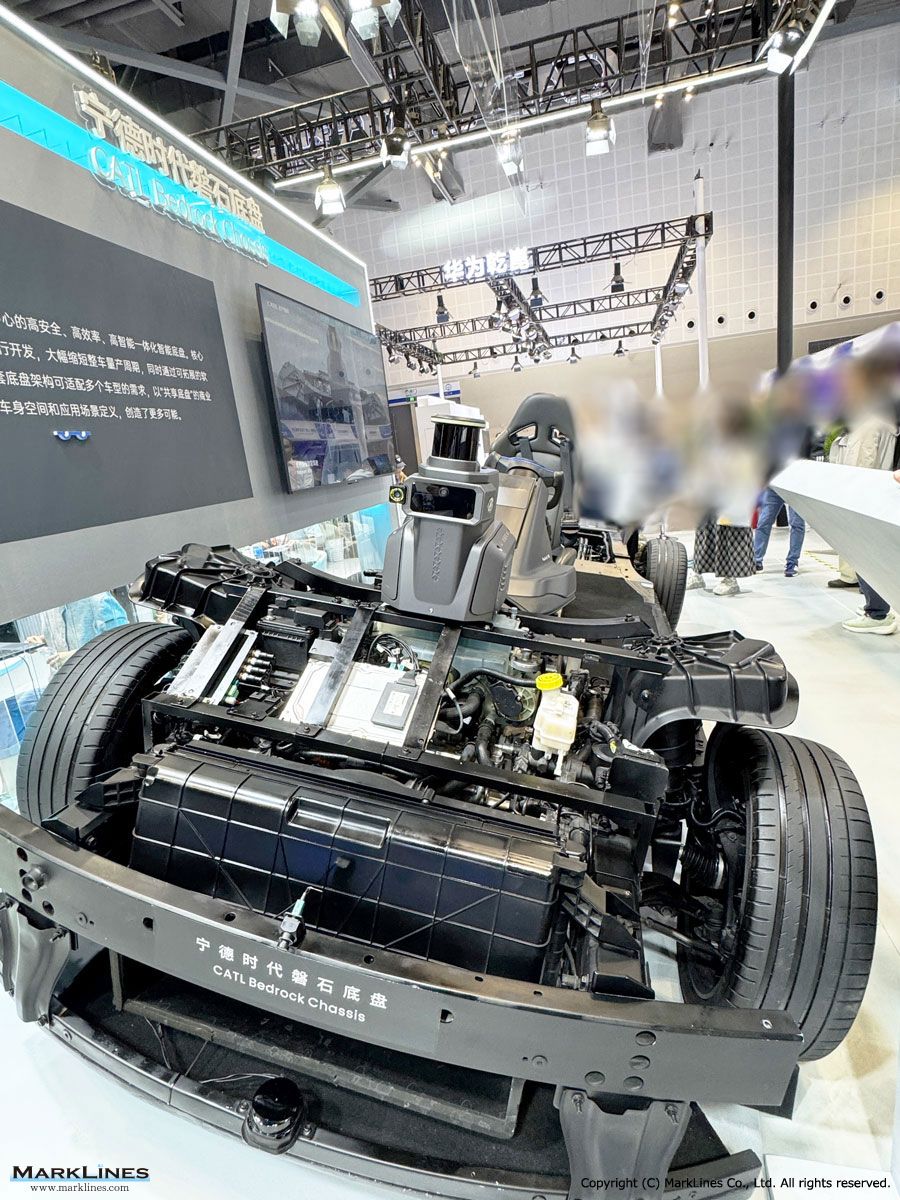
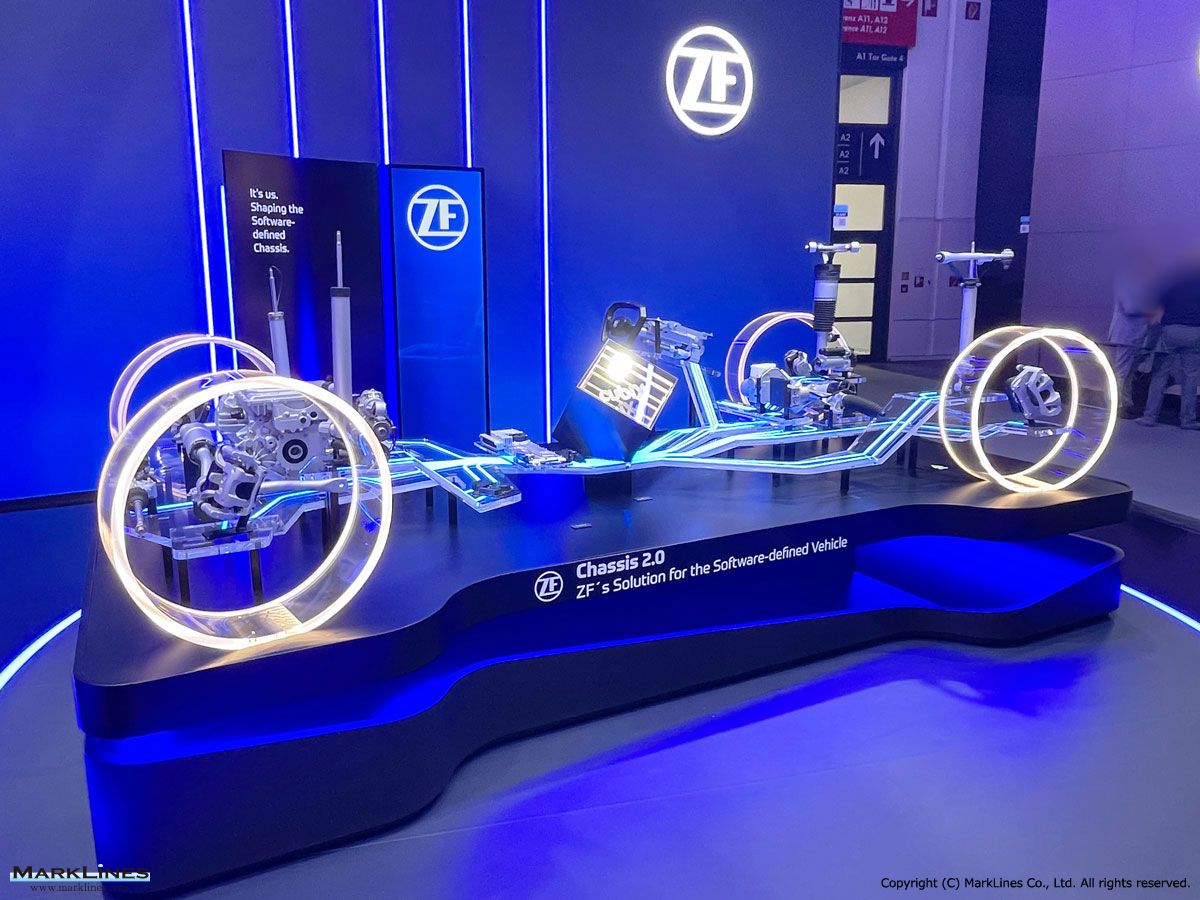
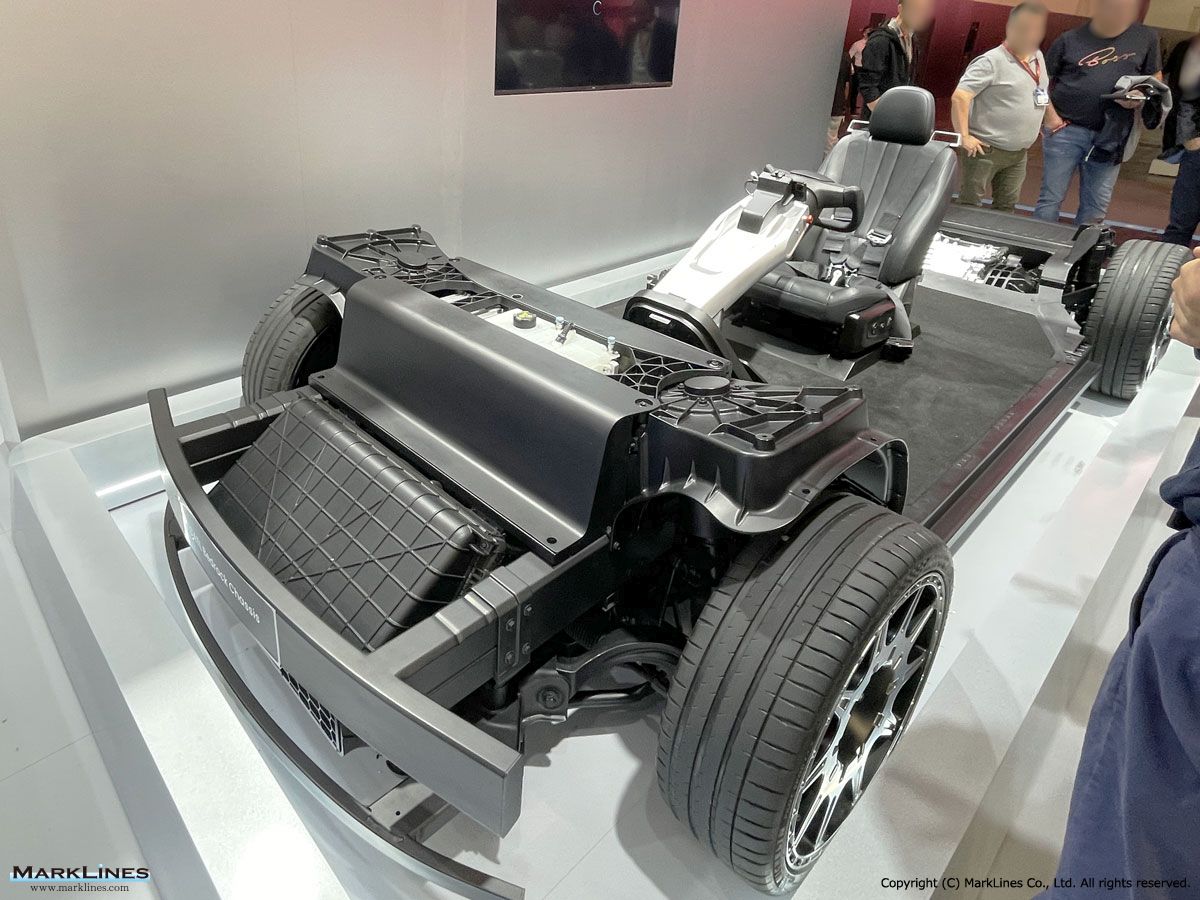
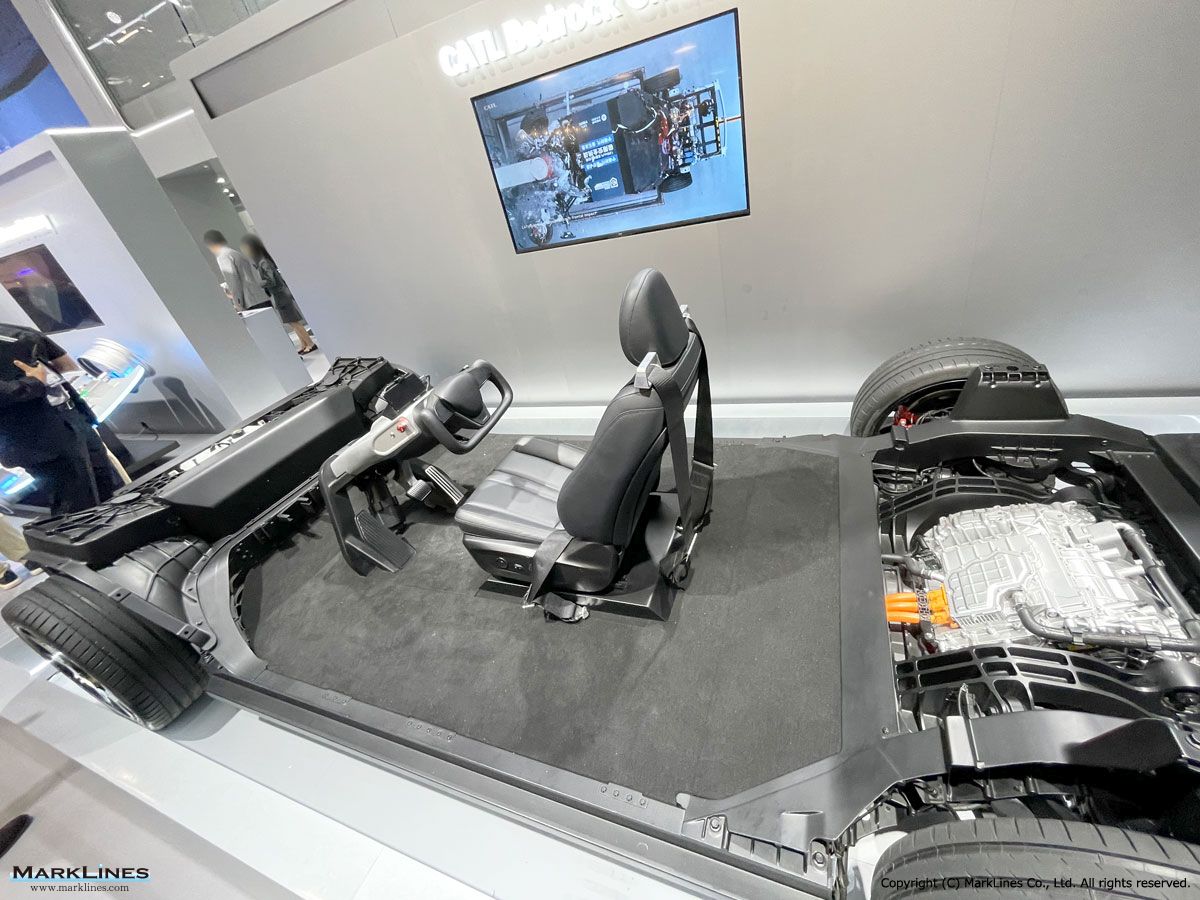
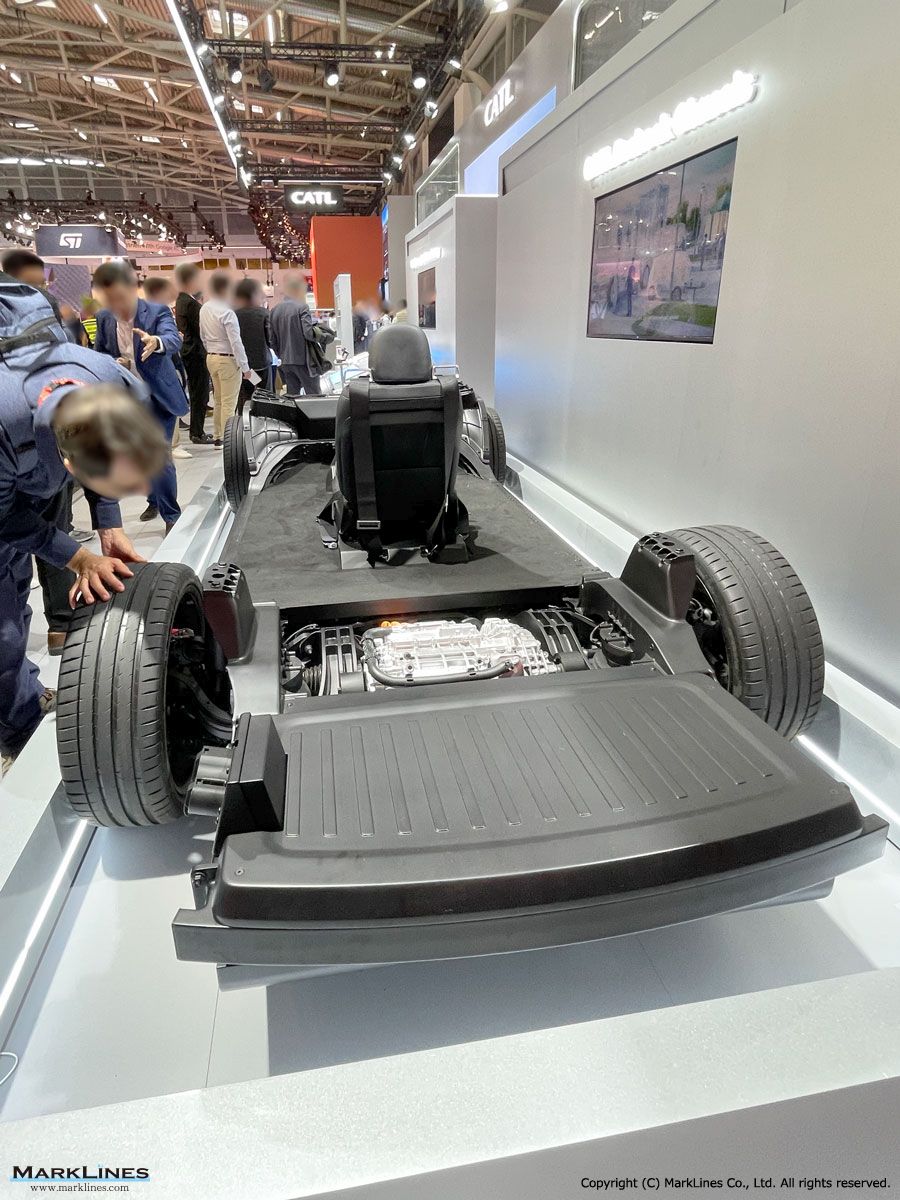
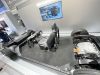
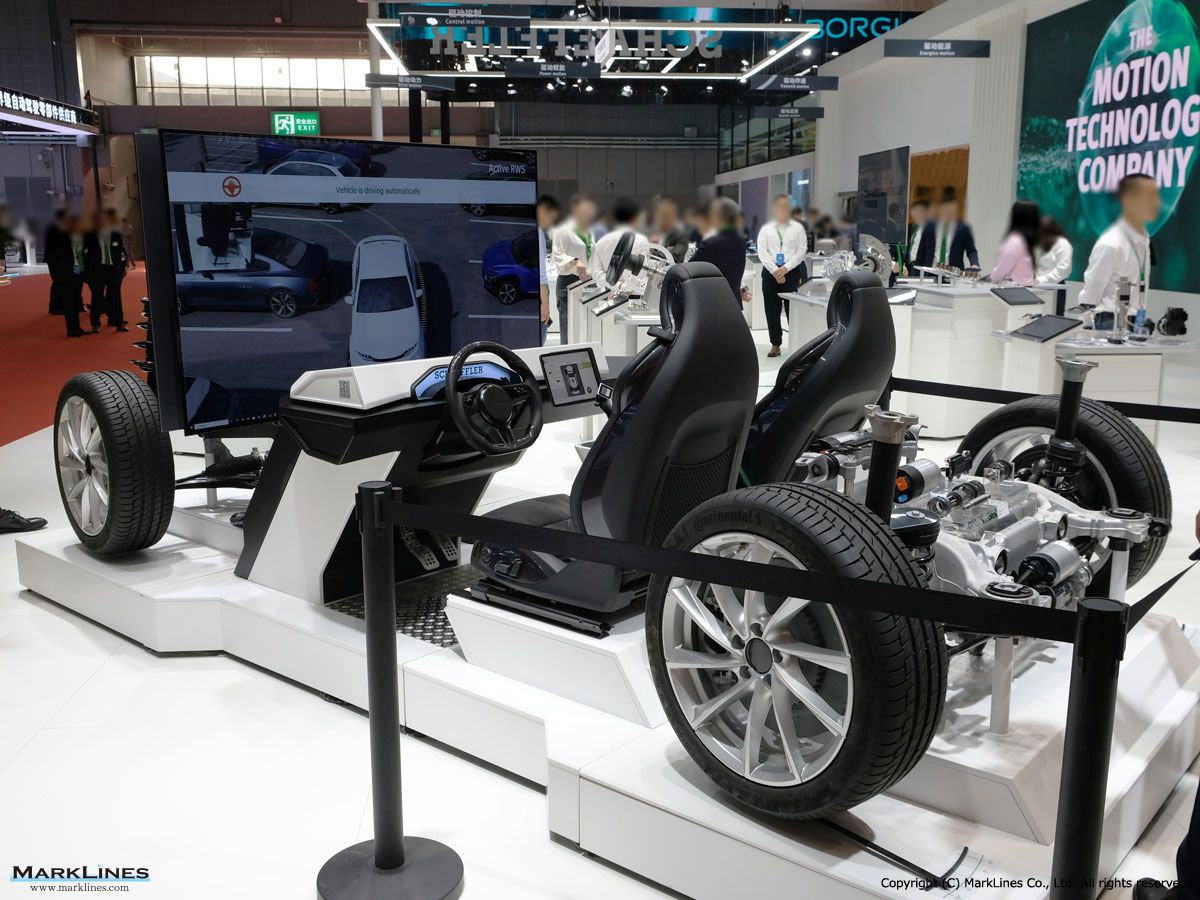
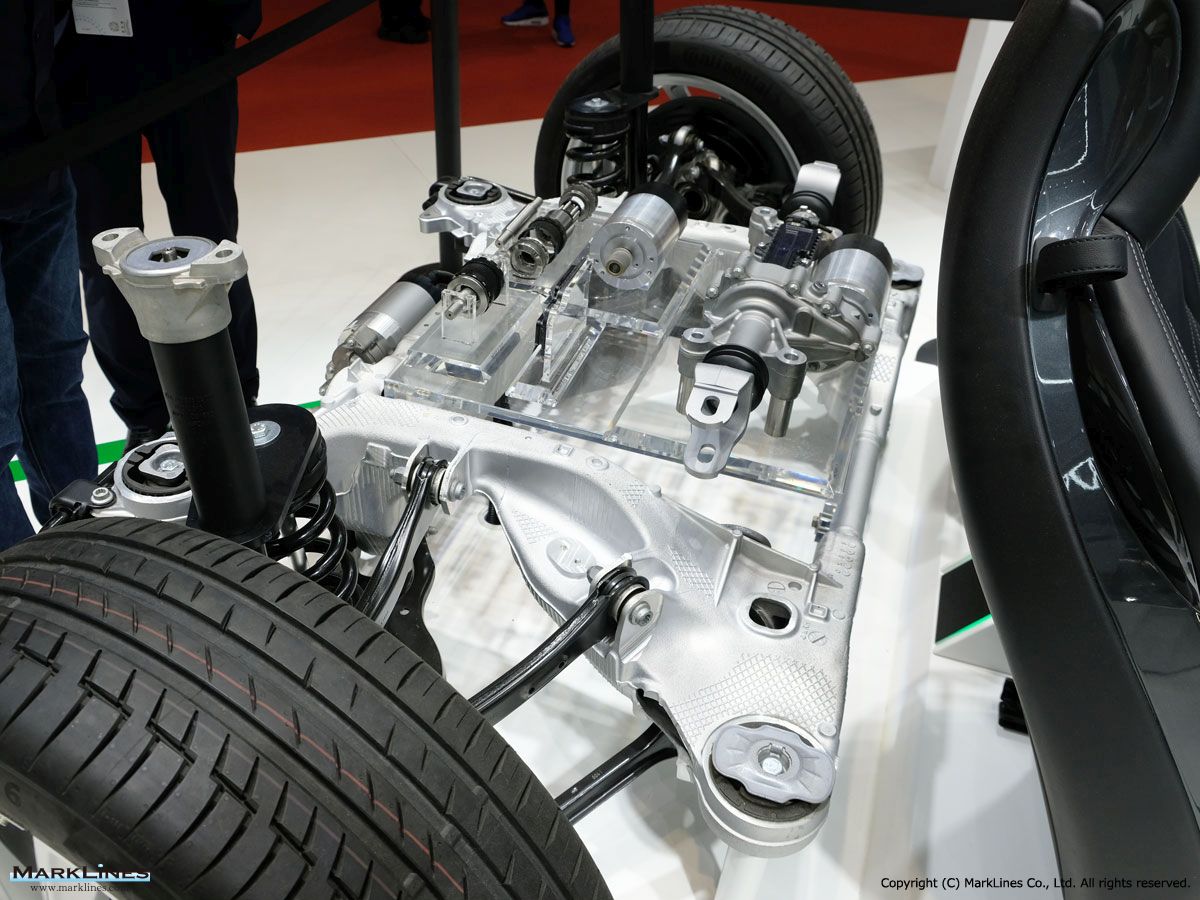
Chassis demonstrator display
 1
1
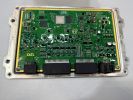
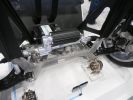
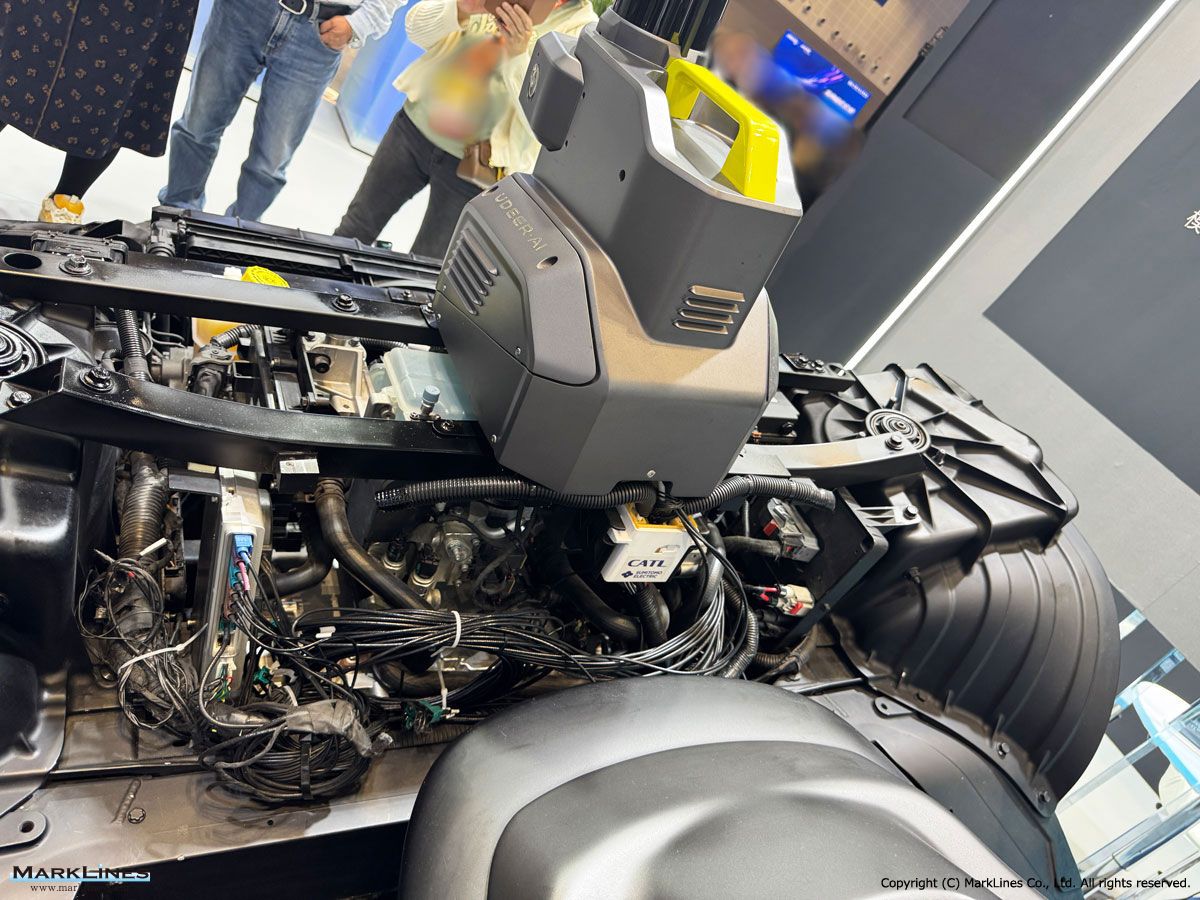
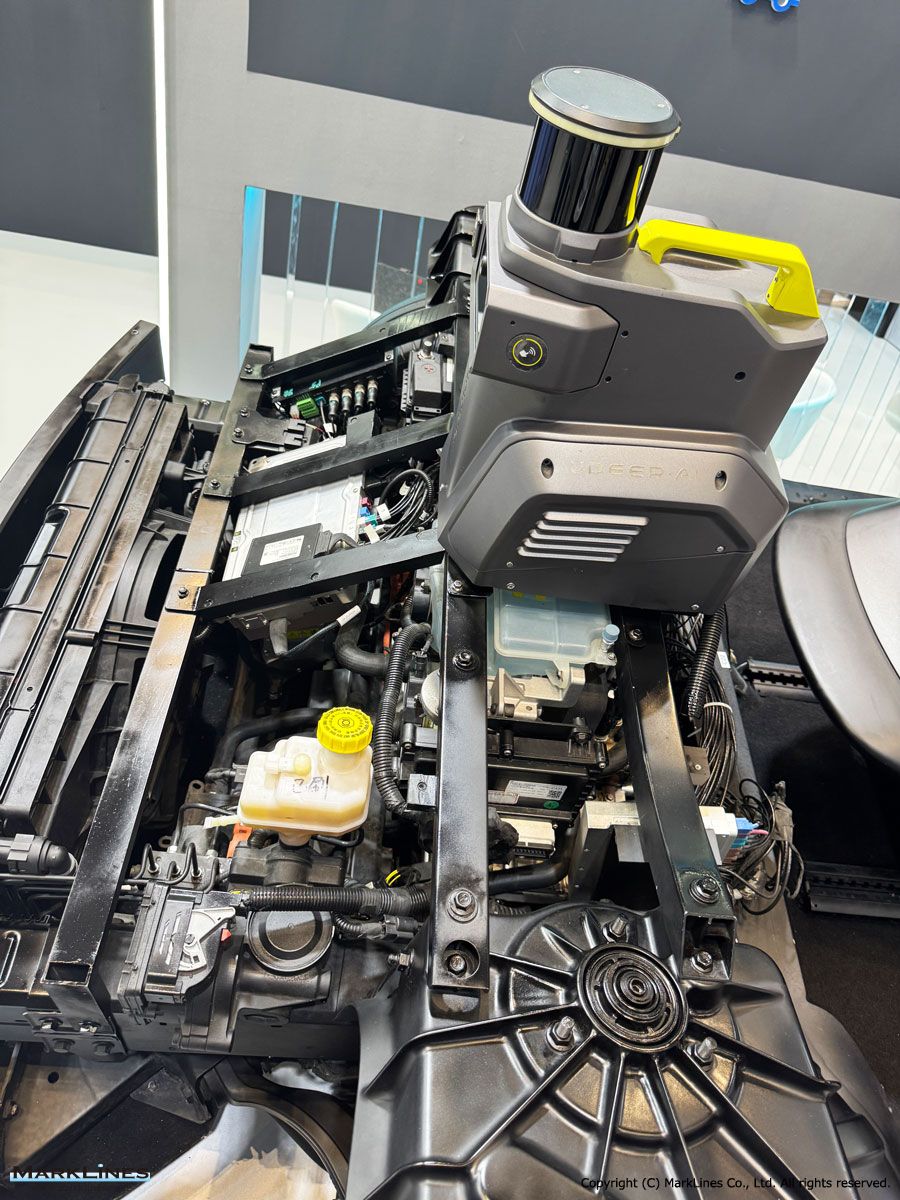
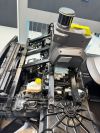
Chassis and Safety System Sensors
 6
6
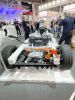
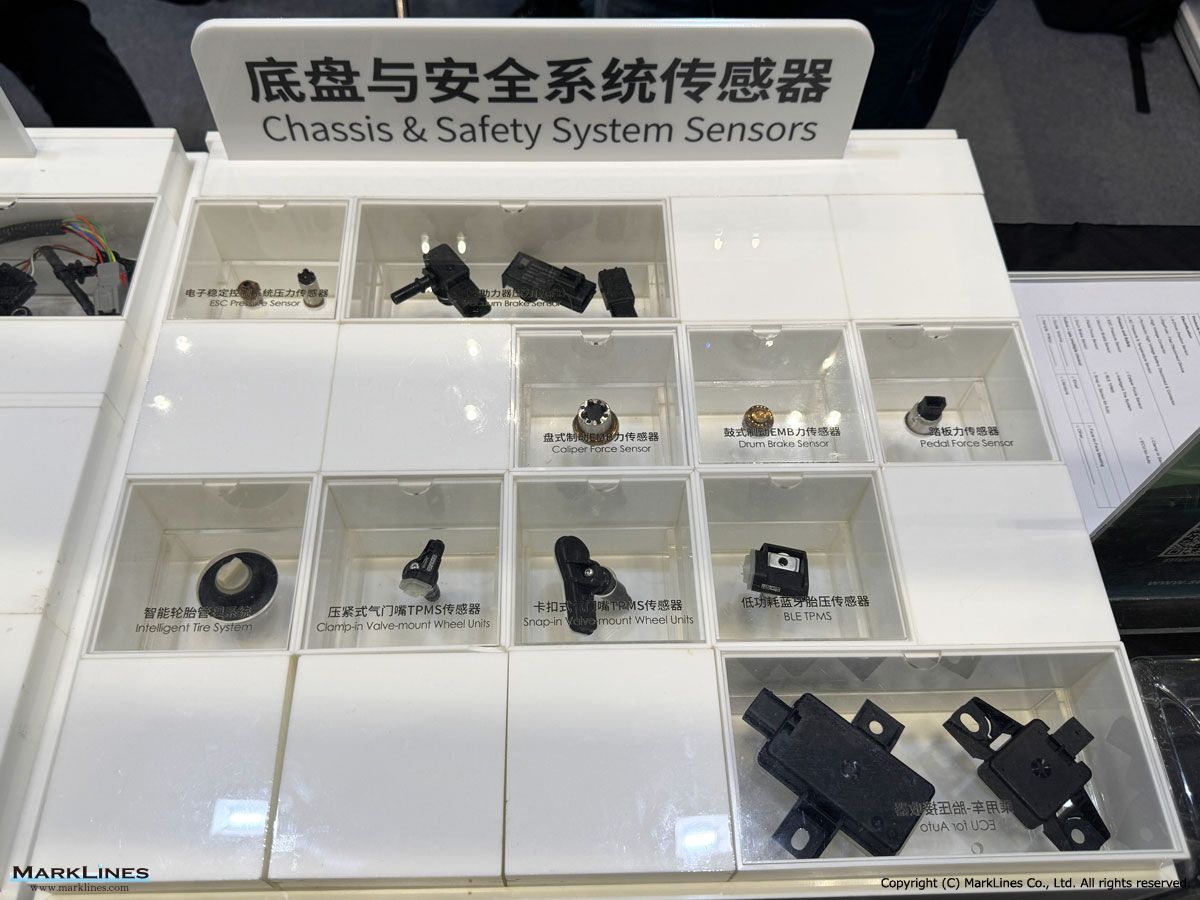
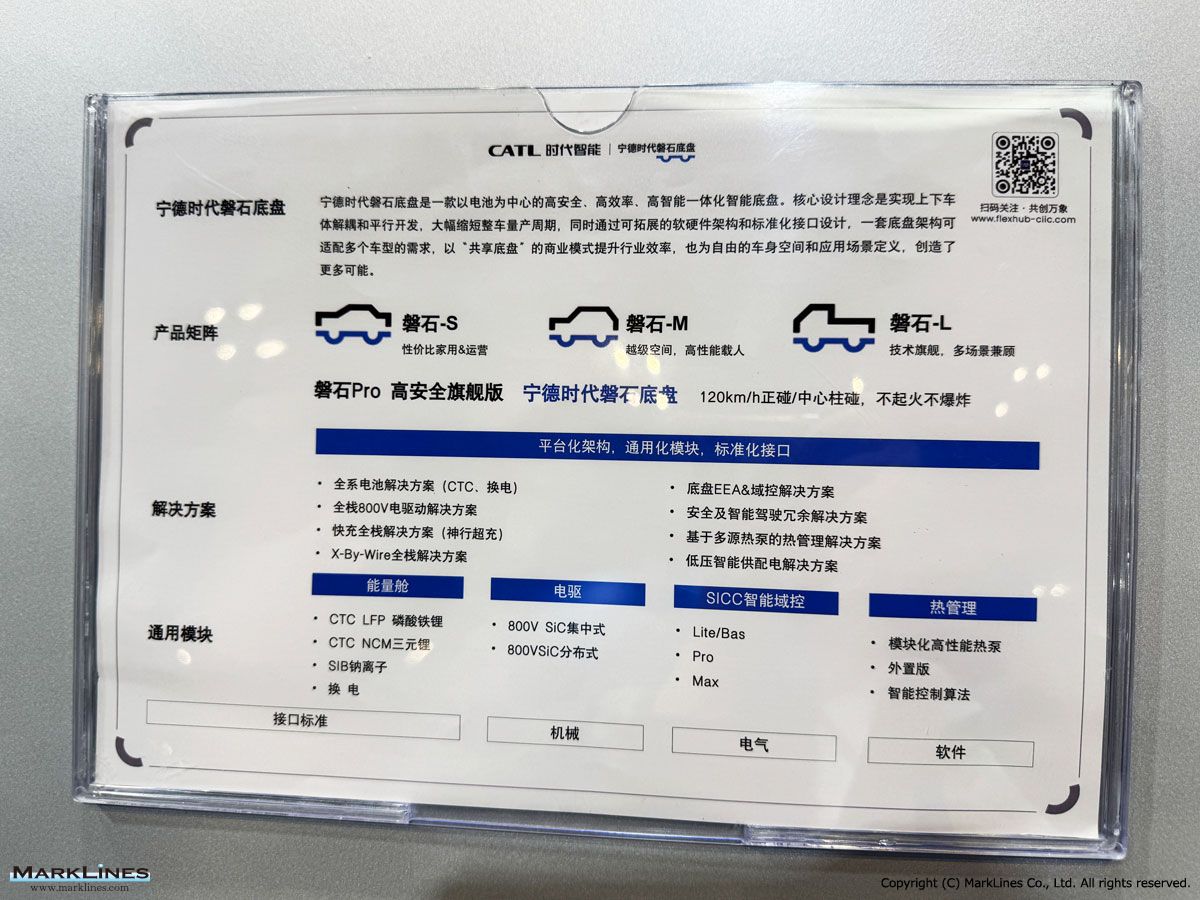
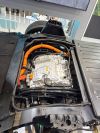
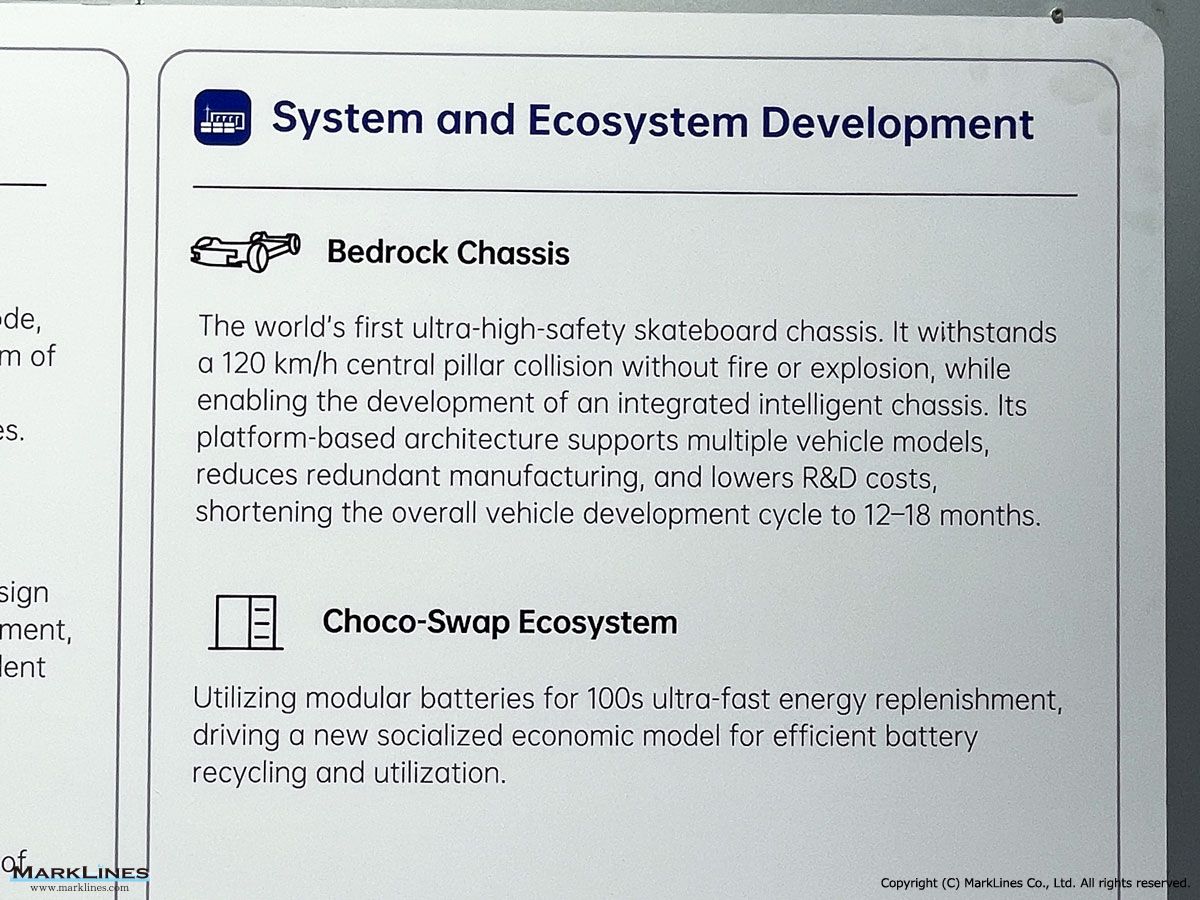
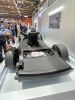
Bedrock chassis
 2
2
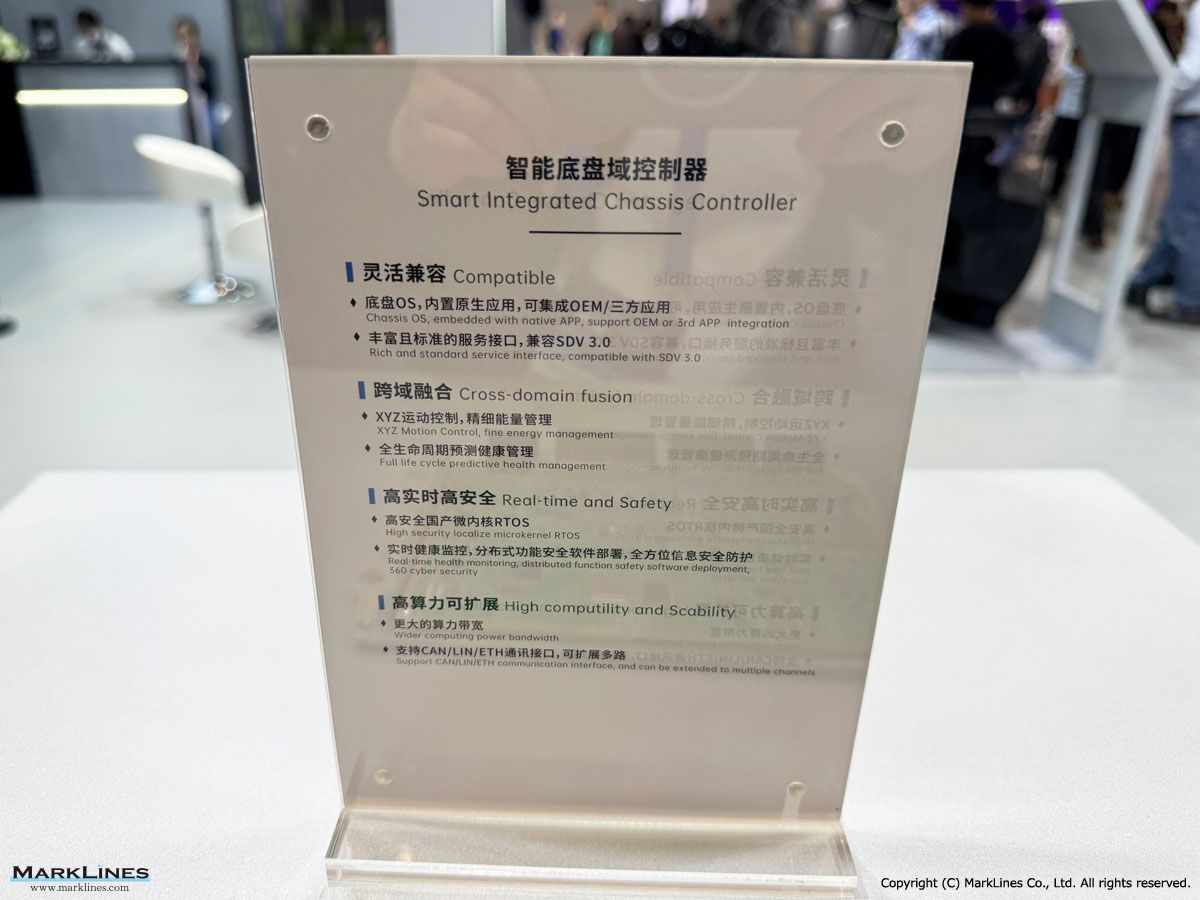
Smart integrated Chassis Controller
 1
1
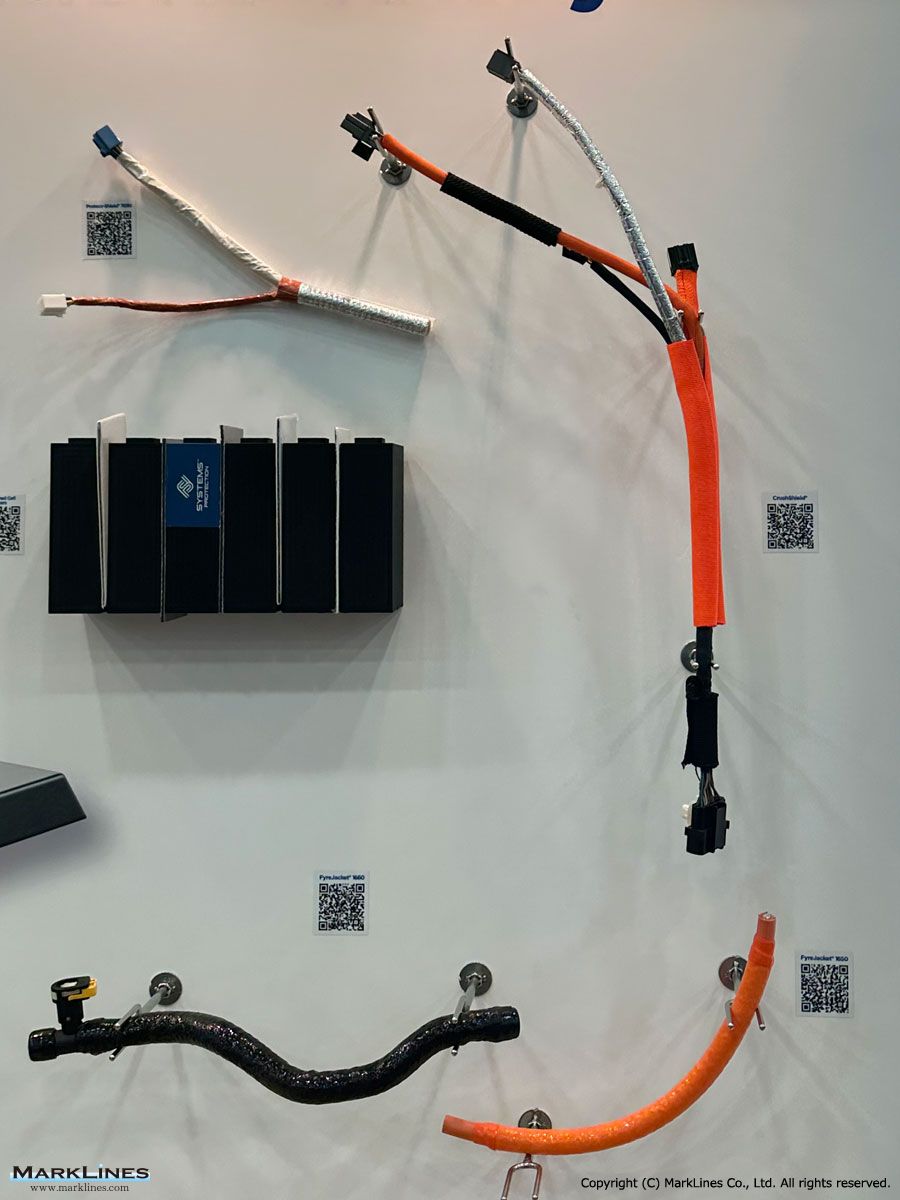
CrushShield
 1
1
Chassis 2.0
 3
3
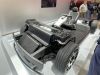
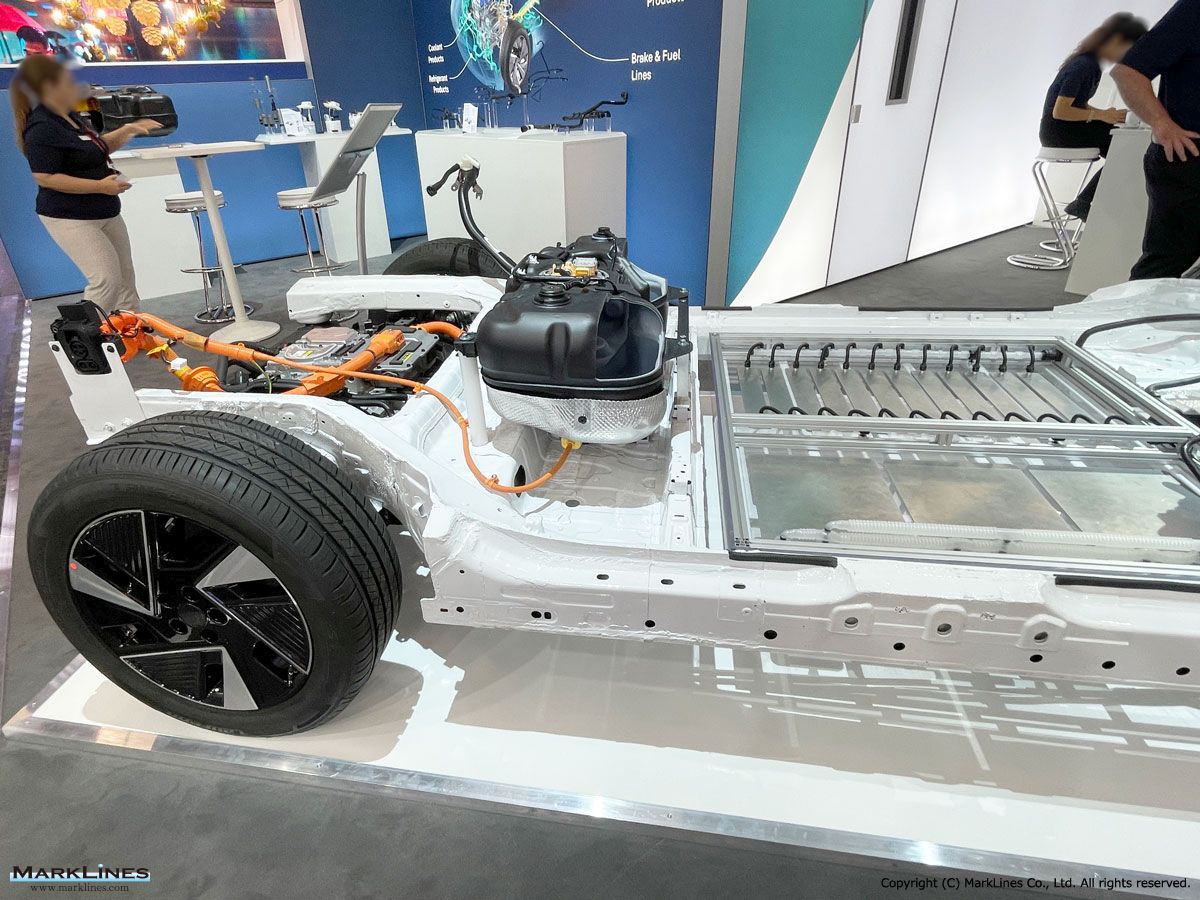
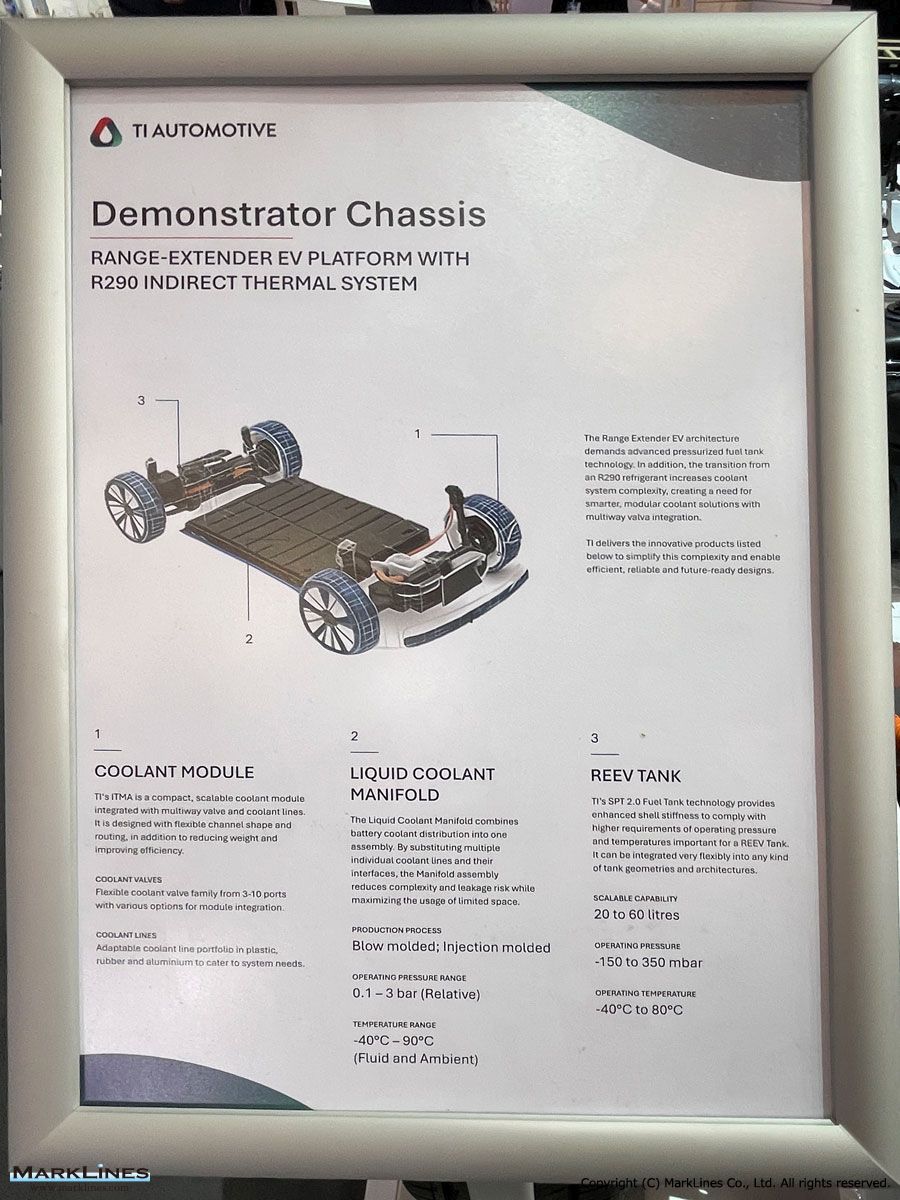
Demonstrator Chassis
 5
5
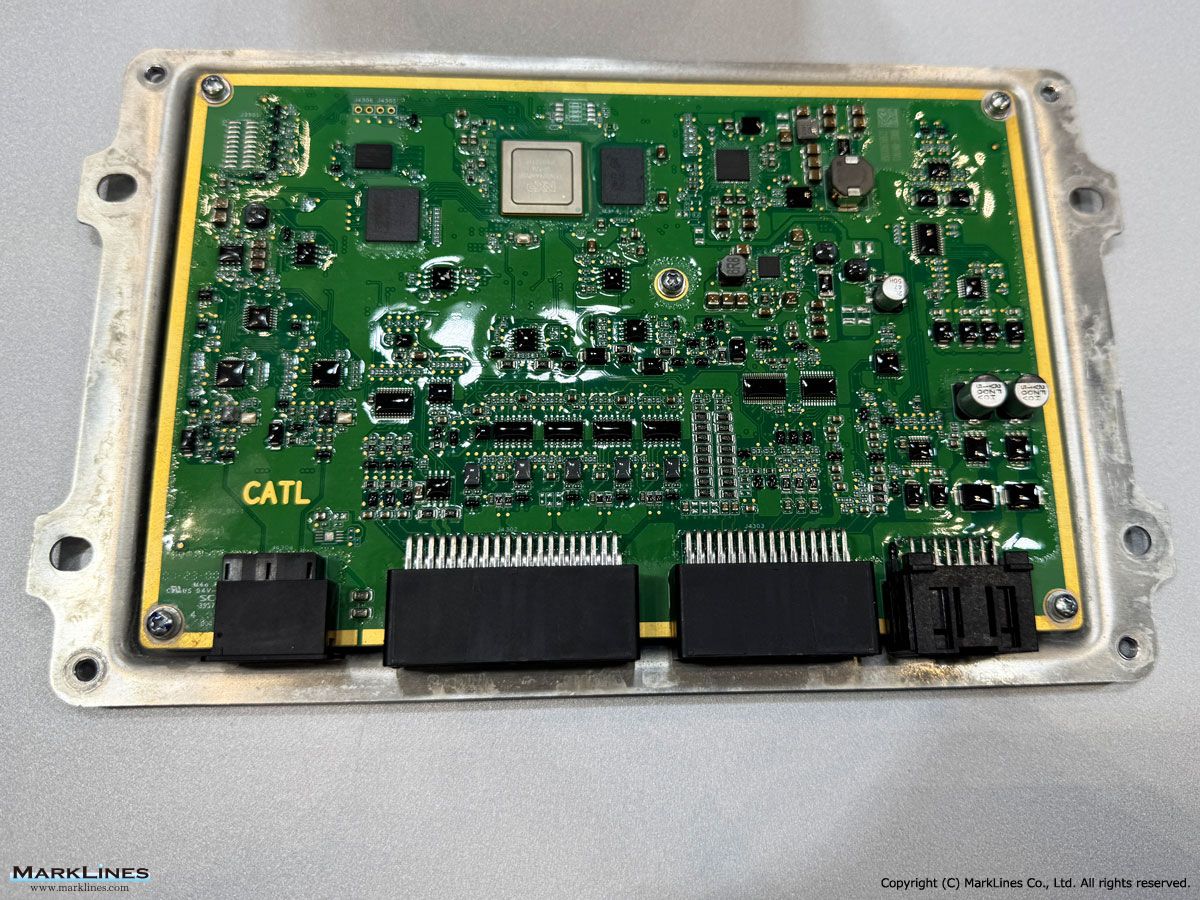
CATL Bedrock Chassis
 1
1
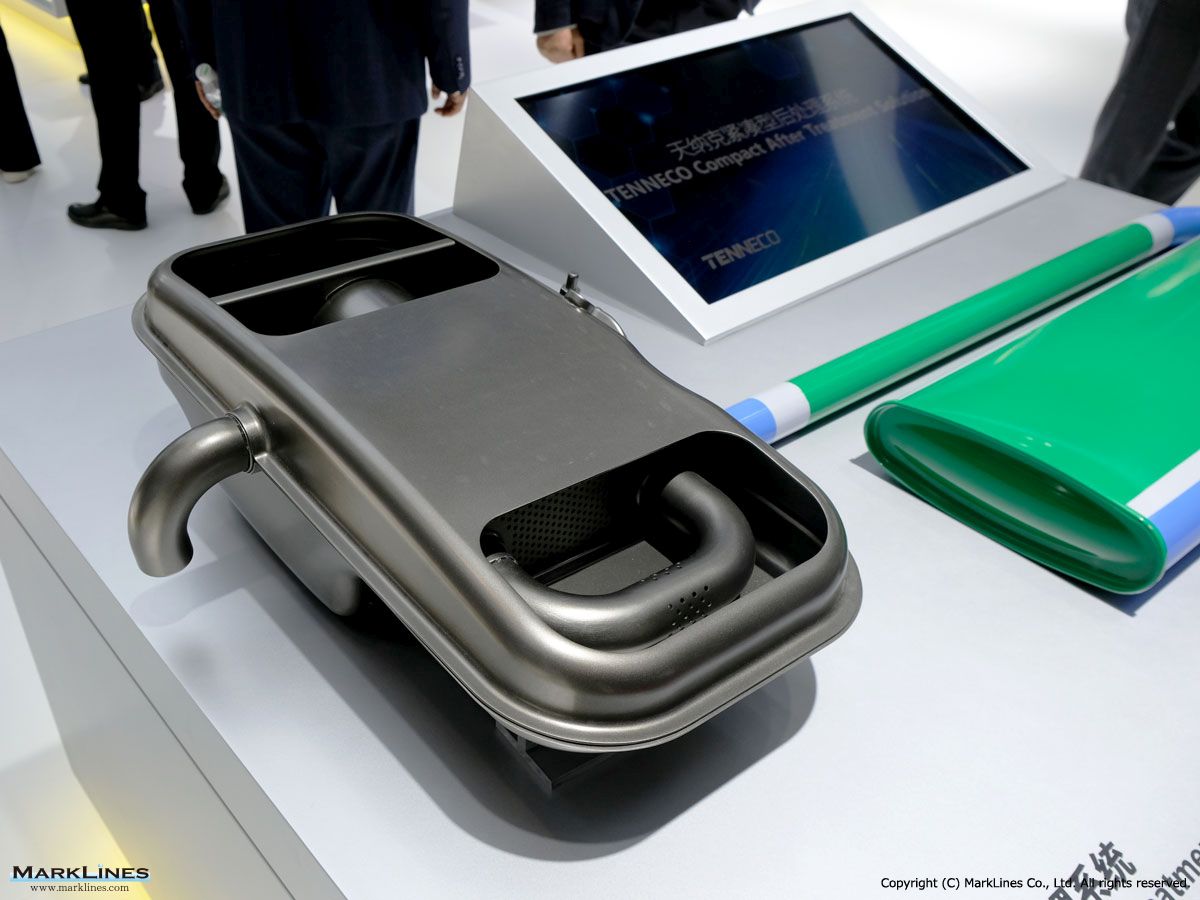
Compact After Treatment Solution (CATS)
 3
3
Chassis demonstration
Sort by :
1 - 16 of 16 results
Data changes for Sales Statistics
Monthly sales data is available since January 2017. January 19, 2017 Croatia The data source has been changed since October 2016.Accordingly, the total sales volume in Croatia has also been corrected. December 22, 2016 China The brand name of SAIC-GM-Wuling Automotive mini trucks, mini trucks (chassis), and mini buses has been changed to Wuling. December 21, 2016 Taiwan The sales volume of the following models are updated: - 2004-2005: Hyu...
Automotive Sales Data Updated at: 2026/05/20
Vietnam - New car sales in 2026 by OEM, vehicle type
66 -92.4% 7 413 -98.3% BEV 49 0 -% 50 - -% Hybrid 1,723 1,124 53.3% 6,848 3,686 85.8% VAMA Total 24,479 23,186 5.6% 101,269 82,122 23.3% Total (Incl. non-VAMA member import) 31,937 29,585 7.9% 126,794 101,834 24.5% Source: VAMA(Vietnam Automobile Manufacturers' Association) * exclude bus chassis *BEV, Hybrid (All segment) Vietnam - Sales of locally assembled vehicles Make 2026 2025 Y-o-Y 2026 2025 Y-o-Y Apr. Share Apr. Share Jan....
Automotive Sales Data Updated at: 2026/05/14
Vietnam - New car sales in 2025 by OEM, vehicle type
.1% 778 1,036 -24.9% BEV 1 0 -% 22 - -% Hybrid 1,649 1,479 11.5% 14,171 9,866 43.6% VAMA Total 42,701 27,403 55.8% 313,359 295,979 5.9% Total (Incl. non-VAMA member import) 47,067 31,598 49.0% 375,736 340,142 10.5% Source: VAMA(Vietnam Automobile Manufacturers' Association) * exclude bus chassis *BEV, Hybrid (All segment) Vietnam - Sales of locally assembled vehicles Make Dec. 2025 Share Dec. 2024 Share Y-o-Y Jan. -Dec. 2025 Share...
Automotive Sales Data Updated at: 2026/02/12
Vietnam - New car sales in 2024 by OEM, vehicle type
64,782 60,729 6.7% SPV 90 59 52.5% 1,036 1,029 0.7% Hybrid 1,479 - -% 9,866 - -% VAMA Total 27,403 36,350 -24.6% 295,979 276,377 7.1% Total (Incl. non-VAMA member import) 31,598 38,740 -18.4% 340,142 301,989 12.6% Source: VAMA(Vietnam Automobile Manufacturers' Association) * exclude bus chassis * Hybrid (All segment) Vietnam - Sales of locally assembled vehicles Make Dec. 2024 Share Dec. 2023 Share Y-o-Y Jan. -Dec. 2024 Share Jan...
Automotive Sales Data Updated at: 2025/07/03
Vietnam - Flash report, Automotive sales volume, 2023
.7% SPV 59 125 -52.8% 1,029 3,337 -69.2% VAMA Total 36,350 30,303 20.0% 276,377 358,063 -22.8% Total (Incl. non-VAMA member import) 38,740 35,301 9.7% 301,989 404,635 -25.4% Source: VAMA(Vietnam Automobile Manufacturers' Association) * exclude bus chassis Vietnam - Sales of locally assembled vehicles Make Dec. 2023 Share Dec. 2022 Share Y-o-Y Jan. -Dec. 2023 Share Jan. -Dec. 2022 Share Y-o...
Automotive Sales Data Updated at: 2025/06/04
Vietnam - Flash report, Automotive sales volume, 2022
es 6,353 7,306 -13.0% 70,409 70,173 0.3% SPV 125 161 -22.4% 3,337 3,264 2.2% VAMA Total 30,303 43,526 -30.4% 358,063 277,203 29.2% Total (Incl. non-VAMA member import) 35,301 46,759 -24.5% 404,635 304,150 33.0% Source: VAMA(Vietnam Automobile Manufacturers' Association) * exclude bus chassis Vietnam - Sales of locally assembled vehicles Make Dec. 2022 Share Dec. 2021 Share Y-o-Y Jan. -Dec. 2022 Share Jan. -Dec. 2021 Share Y-o...
Automotive Sales Data Updated at: 2025/06/04
Vietnam - Flash report, Automotive sales volume, 2021
cles 7,306 8,643 -15.5% 70,173 65,632 6.9% SPV 161 212 -24.1% 3,264 2,443 33.6% VAMA Total 43,526 44,978 -3.2% 277,203 283,983 -2.4% Total (Incl. non-VAMA member import) 46,759 47,865 -2.3% 304,149 296,634 2.5% Source: VAMA(Vietnam Automobile Manufacturers' Association) * exclude bus chassis Vietnam - Sales of locally assembled vehicles Make Dec. 2021 Share Dec. 2020 Share Y-o-Y Jan. -Dec. 2021 Share Jan. -Dec. 2020 Share Y-o...
Automotive Sales Data Updated at: 2025/06/04
Vietnam - Flash report, Sales volume, 2020
les 8,643 6,938 24.6% 65,632 72,832 -9.9% SPV 212 182 16.5% 2,443 3,191 -23.4% VAMA Total 44,978 31,255 43.9% 283,983 305,562 -7.1% Total (Incl. non-VAMA member import) 47,865 33,159 44.3% 296,634 321,811 -7.8% Source: VAMA(Vietnam Automobile Manufacturers' Association) * exclude bus chassis Vietnam - Sales of locally assembled vehicles Make Dec. 2020 Share Dec. 2019 Share Y-o-Y Jan. -Dec. 2020 Share Jan. -Dec. 2019 Share Y-o...
Automotive Sales Data Updated at: 2025/06/04
Vietnam - Flash report, Sales volume, 2019
s 7,049 9,250 -23.8% 73,176 78,982 -7.4% SPV 182 229 -20.5% 3,191 5,751 -44.5% VAMA Total 31,425 32,511 -3.3% 306,073 276,817 10.6% Total (Incl. non-VAMA member import) 33,159 34,234 -3.1% 322,322 288,683 11.7% Source: VAMA(Vietnam Automobile Manufacturers' Association) * exclude bus chassis Vietnam - Sales of locally assembled vehicles Make Dec. 2019 Share Dec. 2018 Share Y-o-Y Jan. -Dec. 2019 Share Jan. -Dec. 2018 Share Y-o...
Automotive Sales Data Updated at: 2020/07/16
Vietnam - Flash report, Sales volume, 2016
CVs 8,734 9,174 -4.8% 98,958 81,310 21.7% SPV 847 822 3.0% 13,374 9,968 34.2% VAMA Total 28,164 23,775 18.5% 271,833 208,566 30.3% Total (Incl. import/VAMA non-member) 33,295 29,397 13.3% 304,427 244,914 24.3% Source: VAMA(Vietnam Automobile Manufacturers' Association) * exclude bus chassis Vietnam - Sales of locally assembled vehicles Make Dec. 2016 Share Dec. 2015 Share Y-o-Y Jan. -Dec. 2016 Share Jan. -Dec. 2015 Share Y-o...
Automotive Sales Data Updated at: 2019/10/11
Vietnam - Flash report, Sales volume, 2017
,427 8,734 7.9% 93,459 99,027 -5.6% SPV 676 847 -20.2% 10,166 13,307 -23.6% VAMA Total 23,963 28,164 -14.9% 250,619 271,834 -7.8% Total (Incl. import/VAMA non-member) 27,882 33,295 -16.3% 272,750 304,427 -10.4% Source: VAMA(Vietnam Automobile Manufacturers' Association) * exclude bus chassis Vietnam - Sales of locally assembled vehicles Make Dec. 2017 Share Dec. 2016 Share Y-o-Y Jan. -Dec. 2017 Share Jan. -Dec. 2016 Share Y-o...
Automotive Sales Data Updated at: 2019/10/11
Vietnam - Flash report, Sales volume, 2018
s 9,250 9,427 -1.9% 78,946 93,459 -15.5% SPV 229 676 -66.1% 5,787 10,166 -43.1% VAMA Total 32,511 23,963 35.7% 276,817 250,619 10.5% Total (Incl. import/VAMA non-member) 34,234 27,882 22.8% 288,683 272,750 5.8% Source: VAMA(Vietnam Automobile Manufacturers' Association) * exclude bus chassis Vietnam - Sales of locally assembled vehicles Make Dec. 2018 Share Dec. 2017 Share Y-o-Y Jan. -Dec. 2018 Share Jan. -Dec. 2017 Share Y-o...
Automotive Sales Data Updated at: 2019/10/11
Vietnam - Flash report, Sales volume, 2015
CVs 9,174 6,099 50.4% 81,312 48,945 66.1% SPV 822 581 41.5% 9,968 4,807 107.4% VAMA Total 23,775 16,413 44.9% 208,568 133,565 56.2% Total(Incl. import/VAMA non-member) 29,397 20,208 45.5% 244,914 157,810 55.2% Source: VAMA(Vietnam Automobile Manufacturers' Association)* exclude bus chassis** Data announced by VAMA Vietnam - Sales of locally assembled vehicles Make Dec. 2015 Share Dec. 2014** Share Y-o-Y Jan. -Dec. 2015 Share J...
Automotive Sales Data Updated at: 2016/04/28
Mexico - Flash report, Sales volume, 2014
y 2014.Source: Asociacion Mexicana de la Industria Automotriz A.C. (AMIA)Sales of new vehicles by model Cars 2014Jan.-Dec. 2013Jan.-Dec. Y-o-Y Light Trucks 2014Jan.-Dec. 2013Jan.-Dec. Y-o-Y Chevrolet Aveo 65,394 65,331 0.1% Honda CR-V 25,216 24,021 5.0% Nissan Versa 53,777 49,004 9.7% Nissan Chasis Largo 24,762 24,994 -0.9% Nissan Tsuru 45,524 46,298 -1.7% Chevrolet Trax 19,571 16,613 17.8% VW Vento* 38,474 5,190 641.3% Renault Duster*...
Automotive Sales Data Updated at: 2015/01/14
Mexico - Flash report, Sales volume, 2013
Asociacion Mexicana de la Industria Automotriz A.C. (AMIA)* The figure of Mercedes-Benz do not include Light trucks since November 2012.Sales of new vehicles by model Cars 2013Jan.-Dec. 2012Jan.-Dec. Y-o-Y Light Trucks 2013Jan.-Dec. 2012Jan.-Dec. Y-o-Y Chevrolet Aveo 65,331 66,152 -1.2% Nissan Chasis Largo 24,994 25,220 -0.9% VW Clasico 4 ptas 54,603 45,069 21.2% Honda CR-V 24,021 24,723 -2.8% Nissan Versa 49,004 47,506 3.2% Chevrolet Tr...
Automotive Sales Data Updated at: 2014/04/24
Vietnam - Flash report, Sales volume, 2013
3 0.0% 13 0.1% -76.9% 36 62 -41.9% VMC 2 0.0% 4 0.0% -50.0% 63 470 -86.6% Vinaxuki 0 0.0% 246 2.5% -100.0% 1,200 4,453 -73.1% VAMA Total 11,631 88.1% 8,709 87.2% 33.6% 96,692 80,652 19.9% Total(Incl. import/VAMA non-member) 13,205 9,983 32.3% 110,519 92,584 19.4% * exclude bus chassis Source: VAMA(Vietnam Automobile Manufacturers' Association) Flash report, November 2013 16 Dec. 2013 *Data in the flash report may from time ...
Automotive Sales Data Updated at: 2014/01/19


 Japan
Japan USA
USA Mexico
 Germany
 China (Shanghai)
 Thailand
 India
India