
 AI Navigator


Search Results by Category
 AI Navigator
All information related to {{ key_word }}.
AI Navigation will guide you. Click here for information about {{ key_word }}.
Images
 5
5
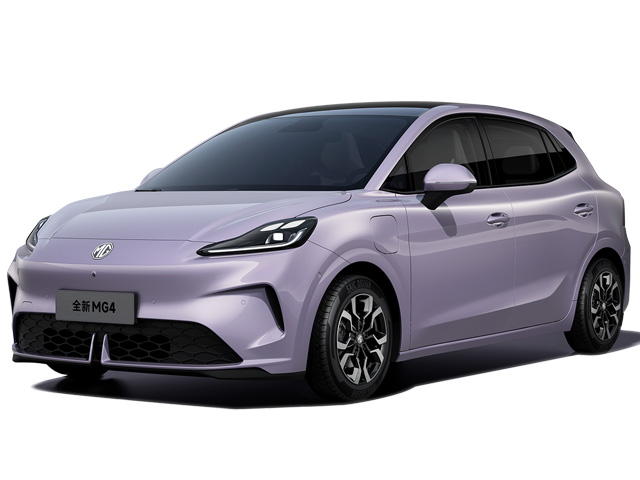
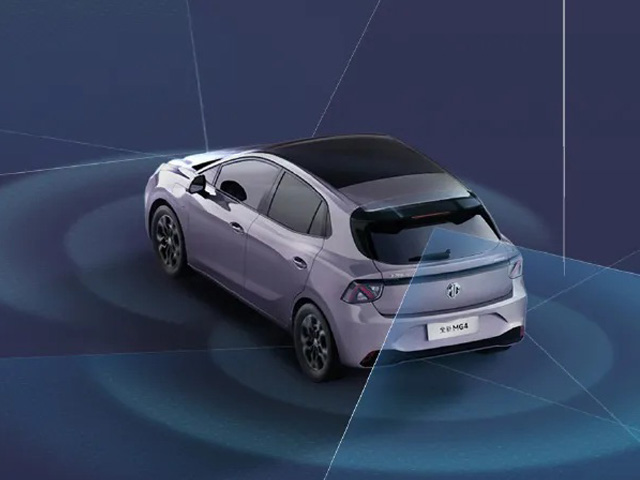
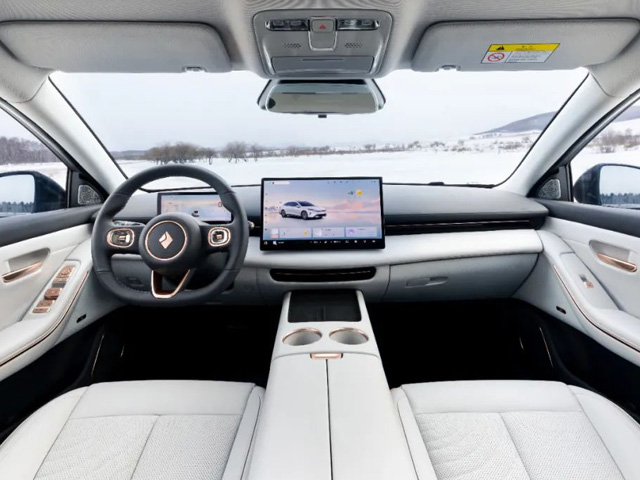
MG4 EV (New model)
 1
1
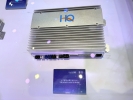
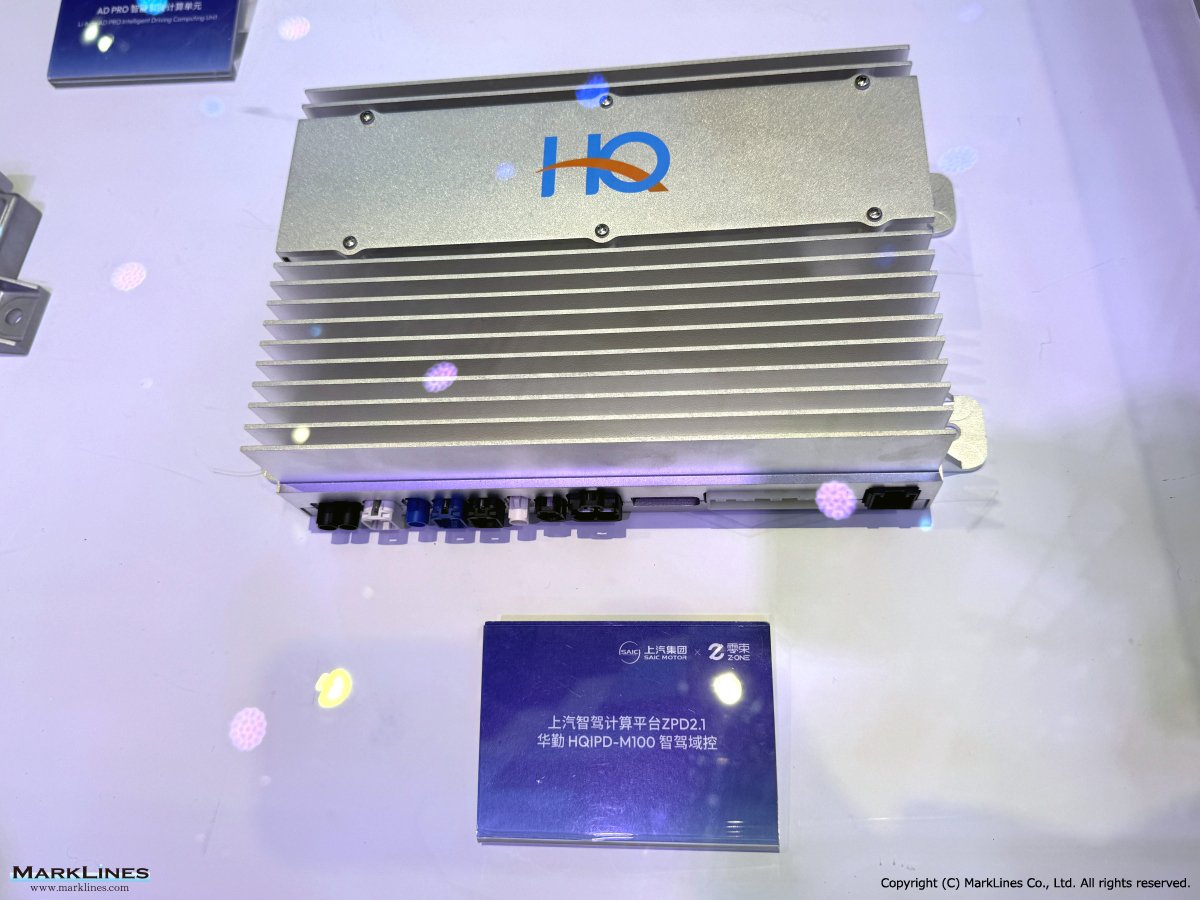
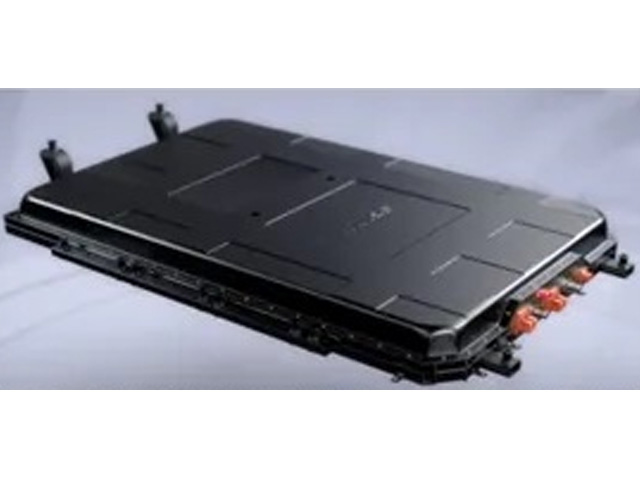
SAIC intelligent driving computing platform ZPD2.1 Huaqin HQIPD-M100 intelligent driving domain controller
 1
1
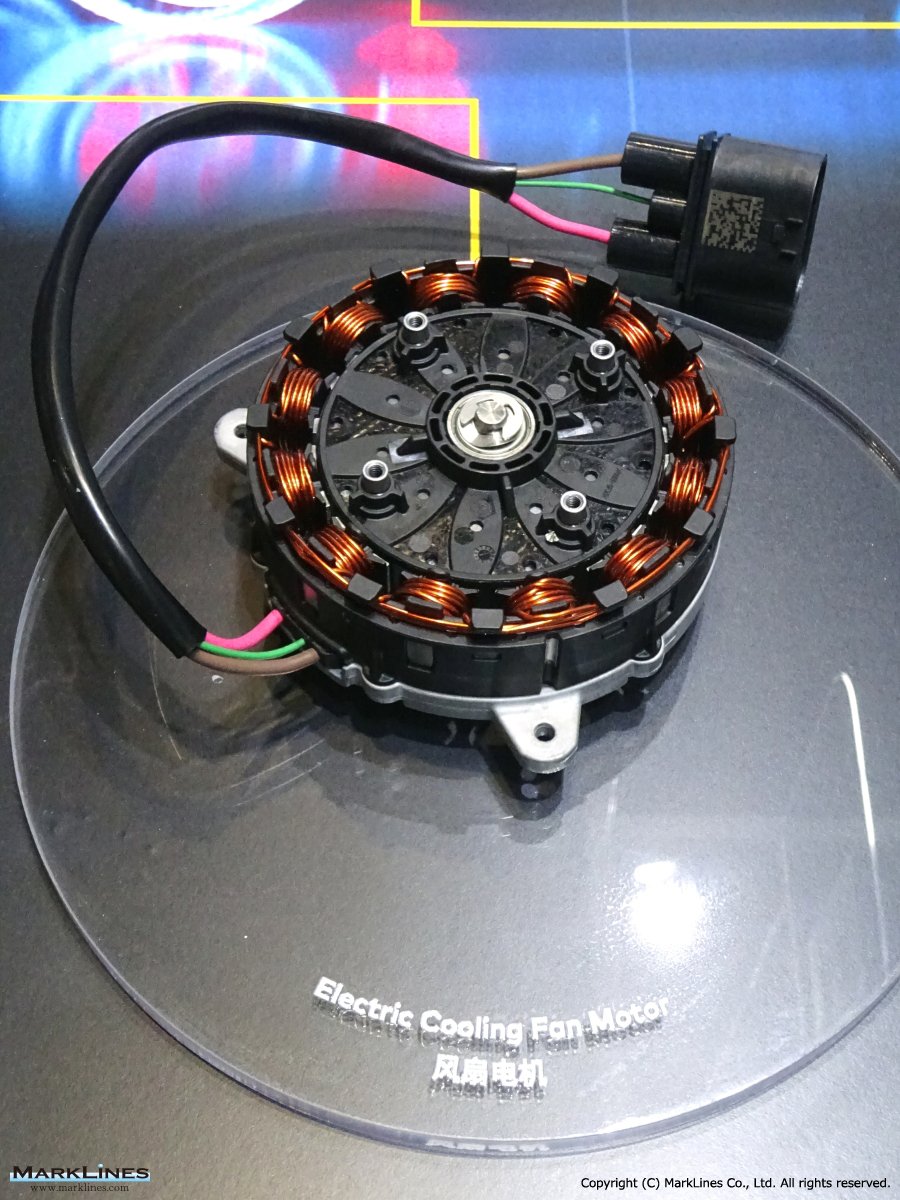
Electric Cooling Fan Motor
 4
4
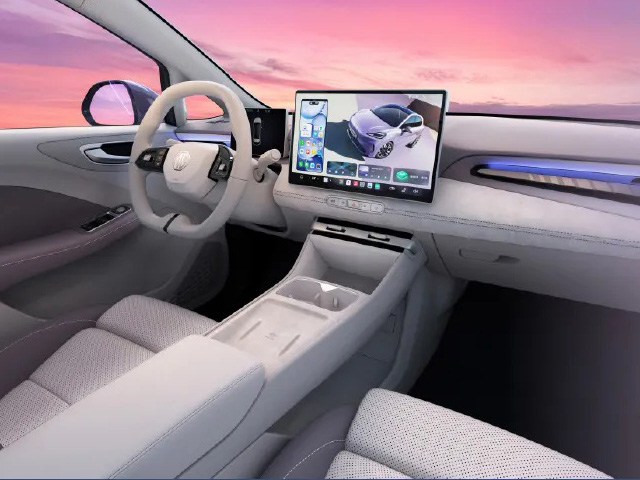
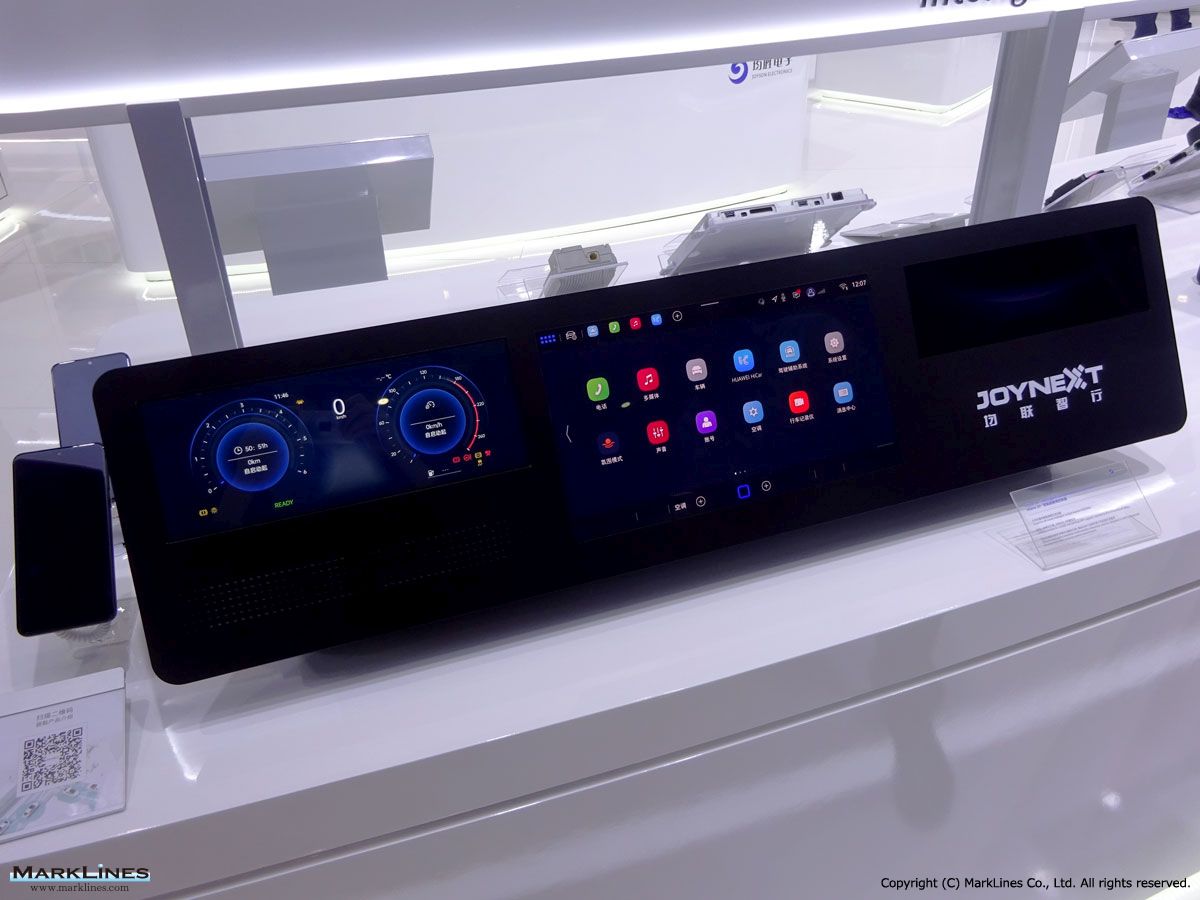
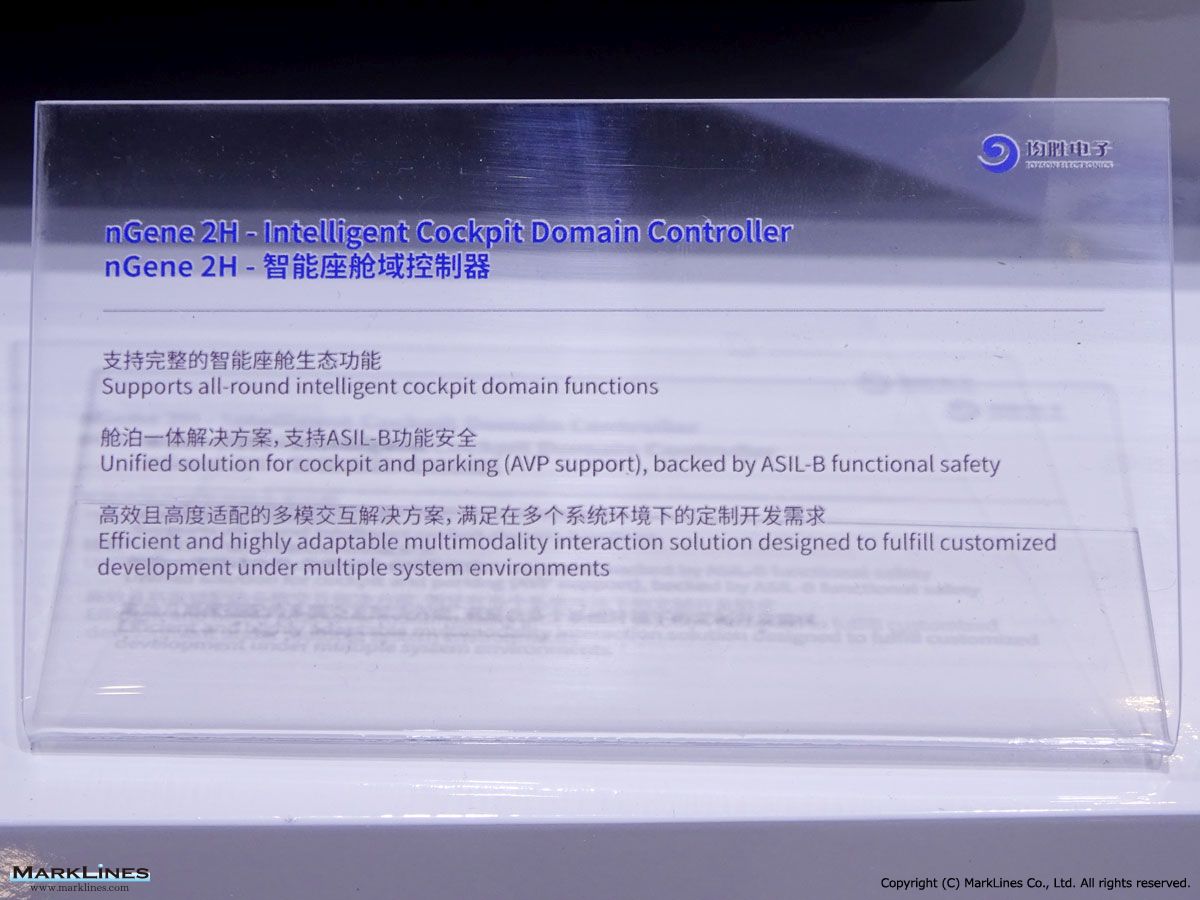
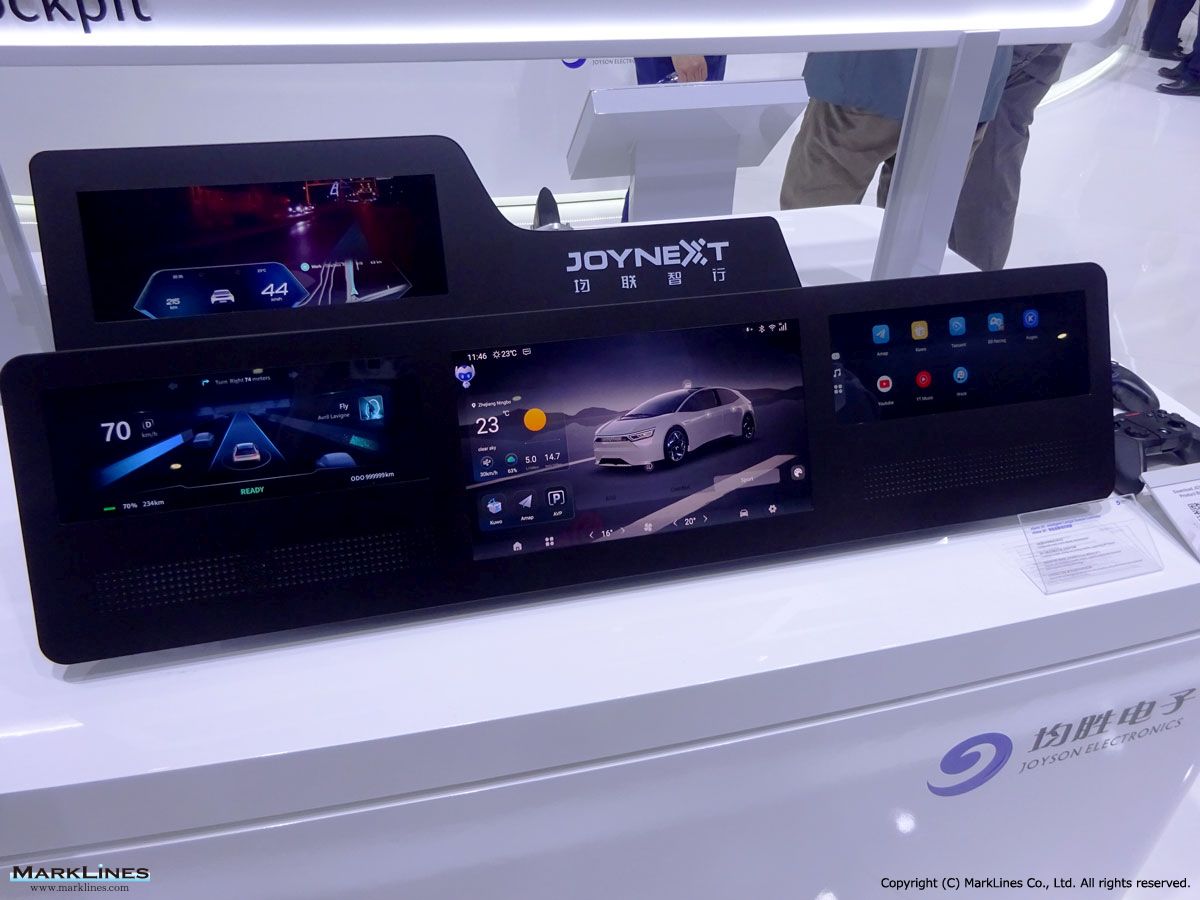
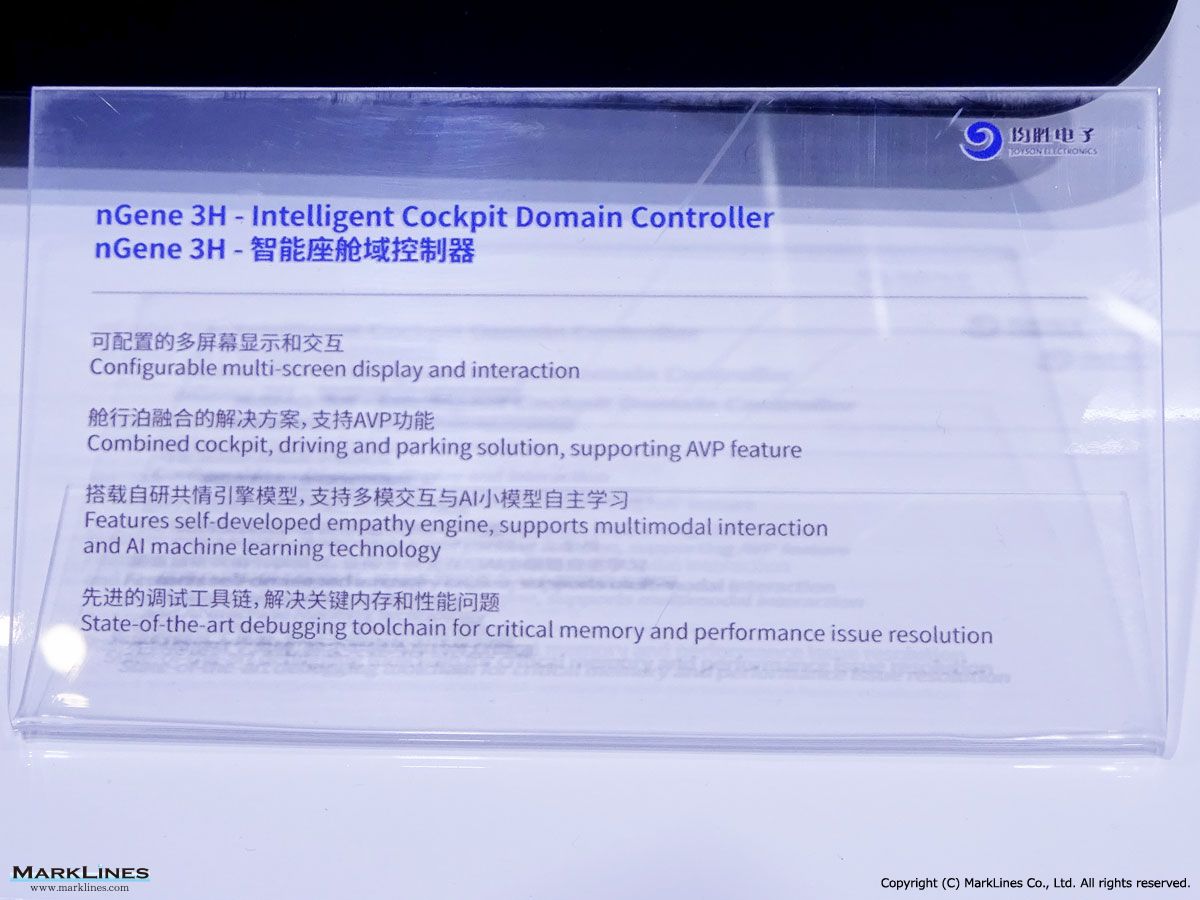
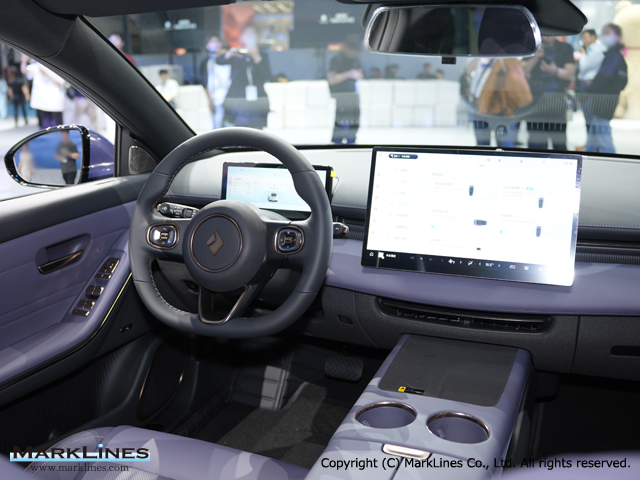
Intelligent cockpit products
 1
1
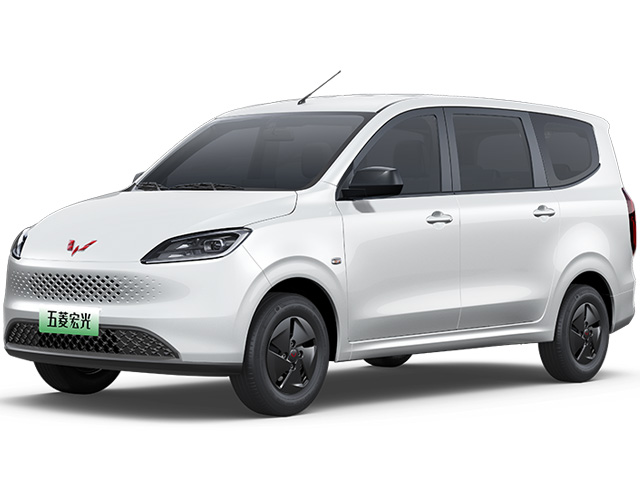
Wuling Hongguang REEV
 5
5
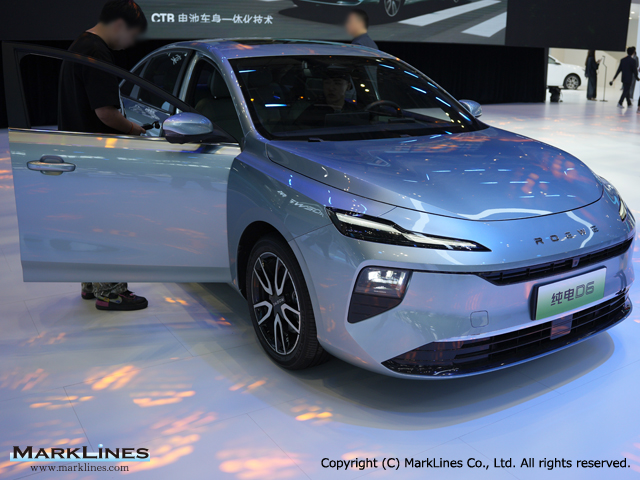
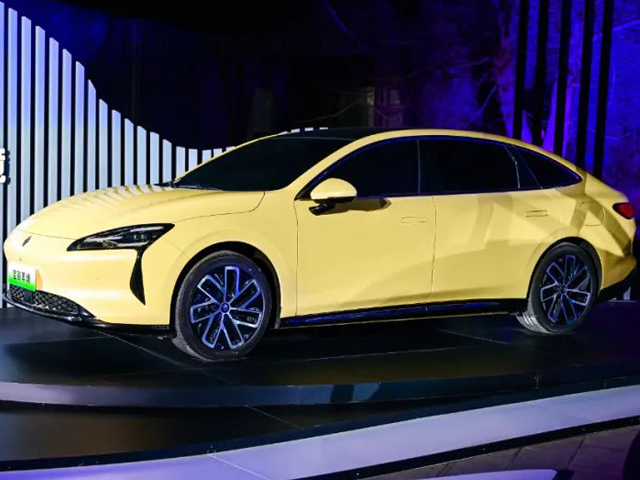
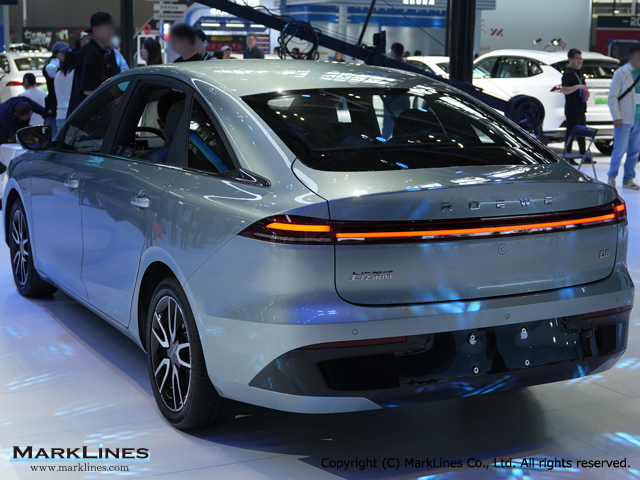
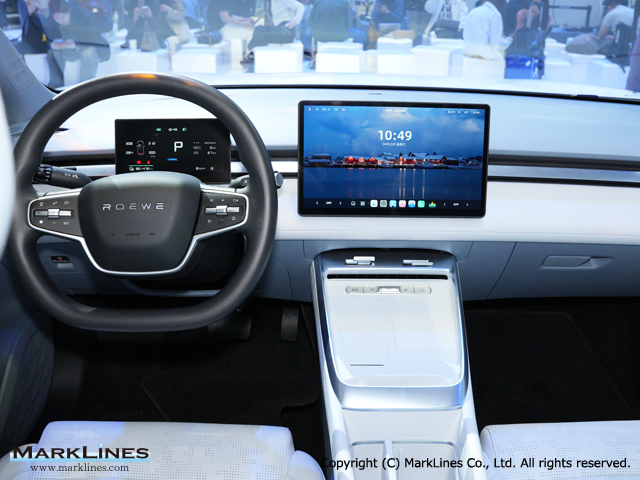
Roewe D6
 4
4
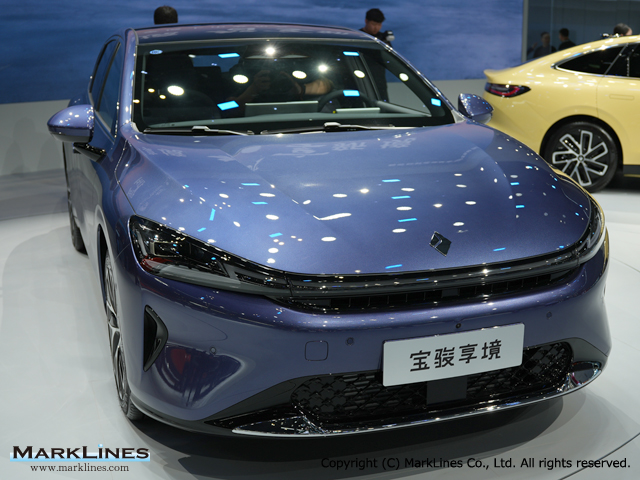
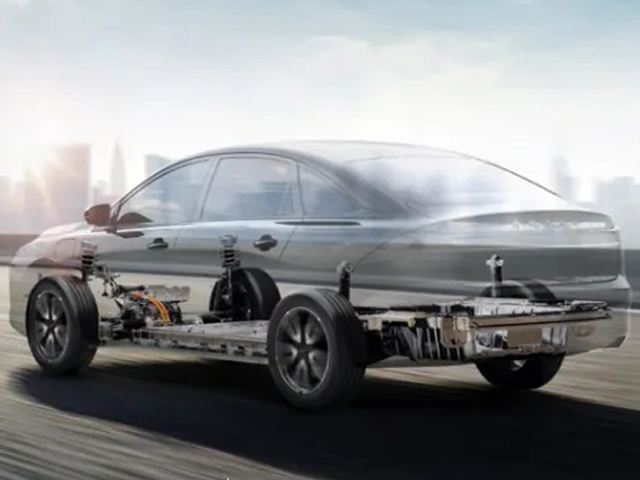
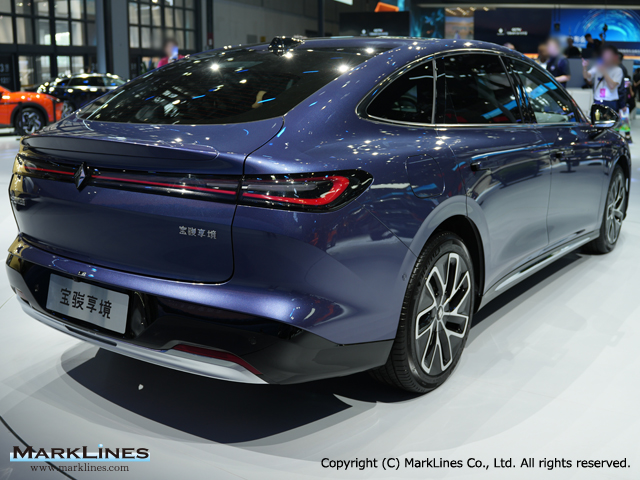
Baojun Xiangjing EV
 2
2
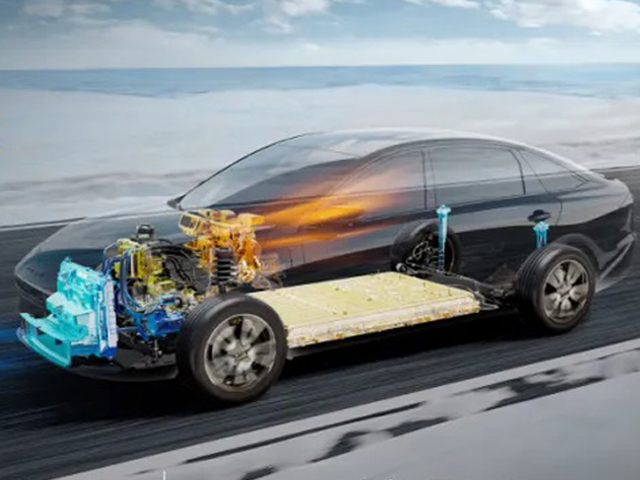
Baojun Xiangjing PHEV
 3
3
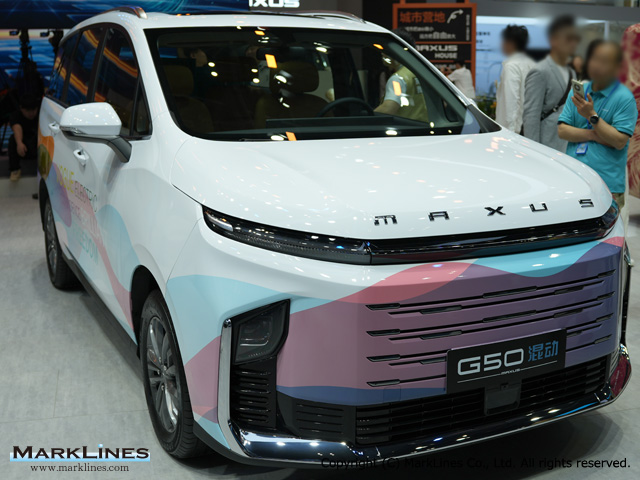
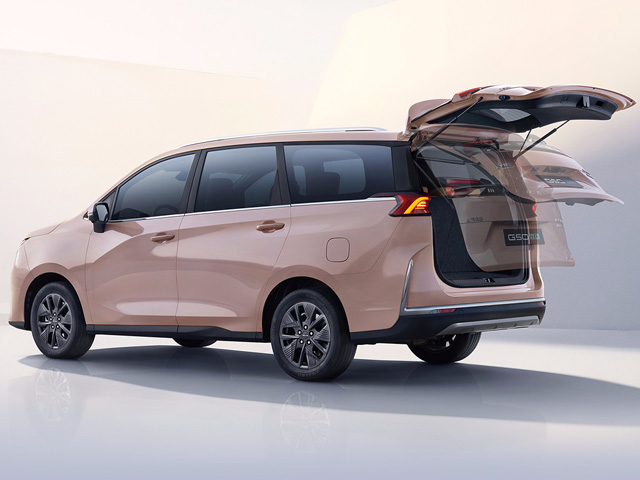
G50
 5
5
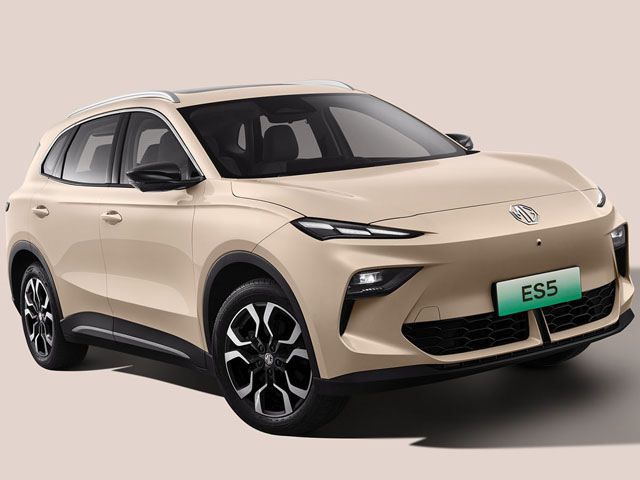
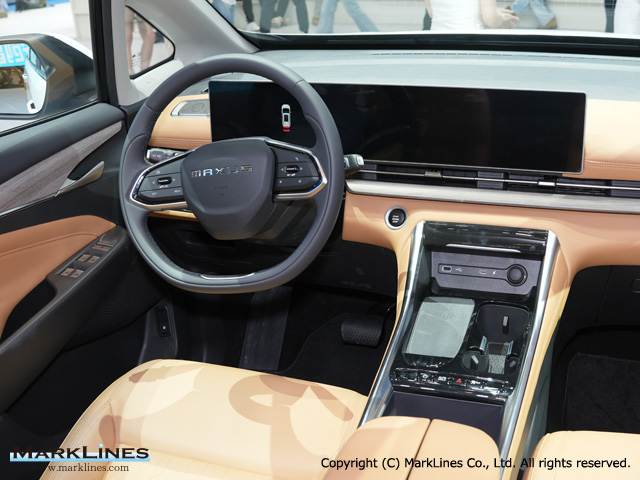
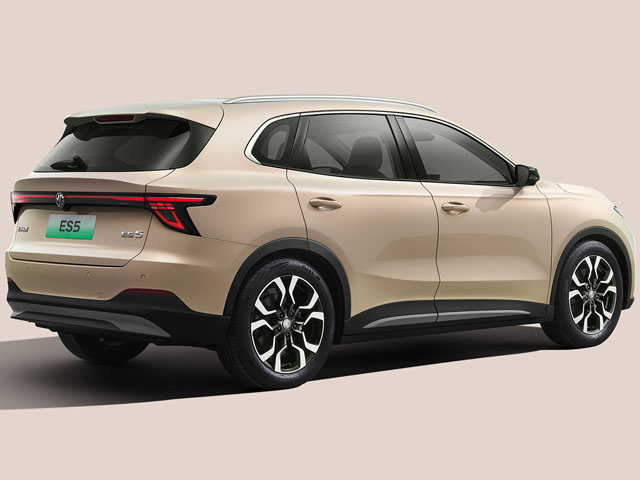
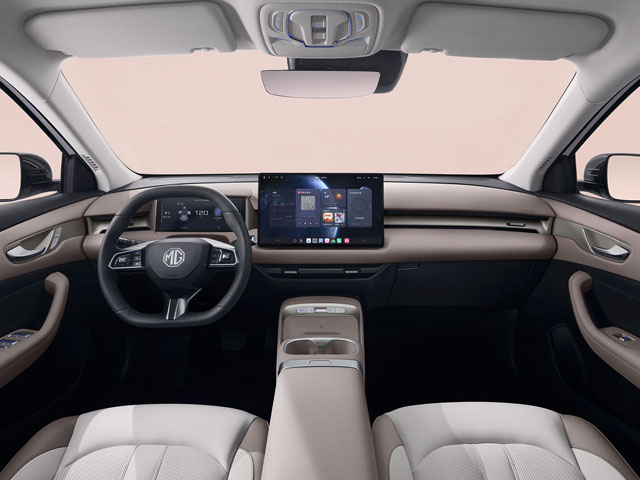
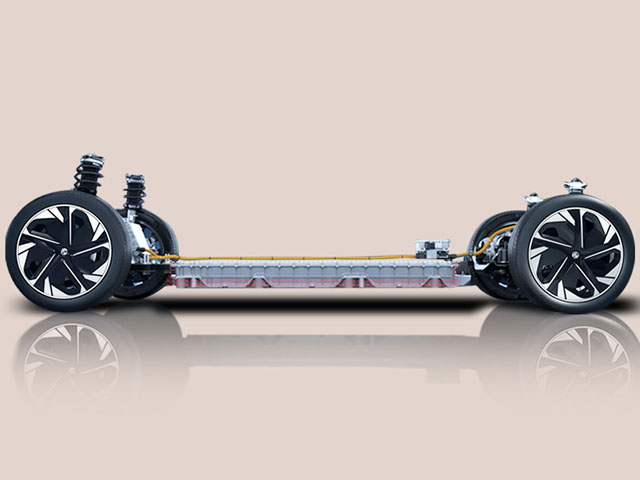
MG ES5/S5 EV
Sort by :
1 - 20 of 25 results
Data changes for Sales Statistics
s been registered as an independent brand and the data has been corrected retroactively to January 2020. July 13, 2016 The groups of some makers and brands have been changed.Because of this, by-group figures will also change. See here for details.- Baojun, Wuling, Shouwang, Everus, Zinoro, Denza, SAIC-GM-Wuling Automotive November 18, 2015 The maker/brand registered by "Foton" in some countries up to now was corrected and unified in "Beiqi F...
Automotive Sales Data Updated at: 2025/08/07
Israel - Flash report, Automotive sales volume ranking, 2025 (By maker)
ai 2,810 11.4% 22,395 12.2% 18,832 10.5% 18.9% Toyota 2,795 11.4% 22,534 12.3% 21,207 11.8% 6.3% Kia 2,671 10.9% 16,109 8.8% 19,008 10.6% -15.3% Skoda 1,859 7.6% 13,776 7.5% 11,682 6.5% 17.9% BYD Auto 1,790 7.3% 7,367 4.0% 11,871 6.6% -37.9% Jaecoo 1,057 4.3% 9,516 5.2% 22 0.0% 43154.5% SAIC/MG 784 3.2% 6,060 3.3% 5,866 3.3% 3.3% Tesla 575 2.3% 2,146 1.2% 3,211 1.8% -33.2% Citroen 525 2.1% 3,078 1.7% 4,010 2.2% -23.2% Mitsubishi...
Automotive Sales Data Updated at: 2025/08/06
China - Flash report, Automotive sales volume ranking, 2025 (By maker, model, vehicle type)
es volume.This is due to the difference in calculation methods. Passenger Car retail sales by Chinese Makers Top10 - Maker Jun. 2025 (10,000) Y-o-Y 1 BYD Auto 35.2 25.7% 2 Geely Automobile 19.6 49.6% 3 FAW-VW 14.3 7.3% 4 Changan Automobile 13.2 48.7% 5 Chery Automobile 11.7 25.8% 6 SAIC VW 9.6 15.1% 7 SAIC-GM-Wuling 7.7 54.0% 8 FAW Toyota 7.2 13.8% 9 GAC Toyota 6.8 -2.3% 10 Great Wall 6.3 26.1% Source: CPCA Three Japan...
Automotive Sales Data Updated at: 2025/07/24
Israel - Flash report, Automotive sales volume ranking, 2024 (By maker)
15,145 5.7% 10.3% Mazda 157 1.2% 13,715 5.1% 13,778 5.1% -0.5% Chery 731 5.7% 12,945 4.8% 11,162 4.2% 16.0% Mitsubishi 173 1.4% 10,572 3.9% 10,299 3.8% 2.7% Suzuki 869 6.8% 9,256 3.4% 8,851 3.3% 4.6% SEAT 8 0.1% 8,729 3.2% 5,647 2.1% 54.6% Tesla 1,941 15.3% 8,202 3.0% 6,767 2.5% 21.2% SAIC/MG 123 1.0% 6,613 2.4% 5,412 2.0% 22.2% Citroen 169 1.3% 5,081 1.9% 6,501 2.4% -21.8% VW 148 1.2% 4,889 1.8% 4,224 1.6% 15.7% Xpeng 1,245 9...
Automotive Sales Data Updated at: 2025/07/02
France - Flash report, Automotive sales volume ranking, 2024 (By maker, vehicle type)
FORD Total 2,839 4,346 -34.7% 40,206 46,562 -13.7% Share 2.1% 2.8% -0.7 pt 2.6% 2.9% -0.3 pt GROUP SUZUKI Total 1,959 1,922 1.9% 22,043 19,420 13.5% Share 1.5% 1.3% 0.2 pt 1.4% 1.2% 0.2 pt - SUZUKI Total 1,959 1,922 1.9% 22,043 19,420 13.5% Share 1.5% 1.3% 0.2 pt 1.4% 1.2% 0.2 pt GROUP SAIC Total 1,756 2,679 -34.5% 16,907 25,479 -33.6% Share 1.3% 1.8% -0.4 pt 1.1% 1.6% -0.5 pt - M.G. Total 1,756 2,679 -34.5% 16,907 25,479 -33.6%...
Automotive Sales Data Updated at: 2025/07/02
China - Flash report, Automotive sales volume ranking, 2024 (By maker, model, vehicle type)
volume. This is due to the difference in calculation methods. Passenger Car retail sales by Chinese Makers Top10 - Maker Dec. 2024 (10,000) Y-o-Y 1 BYD Auto 40.3 34.3% 2 Chery Automobile 19.9 77.3% 3 Geely Automobile 18.6 46.9% 4 FAW-VW 16.1 -24.8% 5 Changan Automobile 15.7 25.0% 6 SAIC VW 15.1 2.8% 7 SAIC-GM-Wuling 12.8 22.2% 8 FAW Toyota 9.7 13.2% 9 Great Wall 8.6 22.3% 10 Tesla 8.3 9.4% Source: CPCA Three Japanese ...
Automotive Sales Data Updated at: 2025/07/02
Israel - Flash report, Automotive sales volume, 2023
0,299 3.8% 11,690 4.4% -11.9% Suzuki 207 4.4% 8,851 3.3% 8,683 3.3% 1.9% Geely 245 5.2% 7,129 2.7% 6,816 2.6% 4.6% Peugeot 67 1.4% 6,844 2.6% 5,642 2.1% 21.3% Tesla 433 9.2% 6,767 2.5% 6,047 2.3% 11.9% Citroen 82 1.7% 6,501 2.4% 7,995 3.0% -18.7% SEAT 9 0.2% 5,647 2.1% 5,555 2.1% 1.7% SAIC/MG 220 4.7% 5,412 2.0% 5,081 1.9% 6.5% Subaru 88 1.9% 4,481 1.7% 4,363 1.6% 2.7% Renault 64 1.4% 4,474 1.7% 3,576 1.4% 25.1% VW 121 2.6% 4,...
Automotive Sales Data Updated at: 2025/06/04
China - Flash report, Automotive sales volume, 2023
s volume by make (shipped from the local plant) to be released later on our data for monthly sales volume.This is due to the difference in calculation methods. Passenger Car retail sales by Chinese Makers Top10 - Maker Dec. 2023 (10,000) Y-o-Y 1 BYD Auto 30.0 34.2% 2 FAW-VW 21.3 18.3% 3 SAIC VW 14.7 2.2% 4 Geely Automobile 12.9 2.1% 5 Changan Automobile 12.4 -26.8% 6 Chery Automobile 11.2 36.6% 7 SAIC-GM-Wuling 10.5 16.0% 8 ...
Automotive Sales Data Updated at: 2025/06/04
Israel - Flash report, Automotive sales volume, 2022
12,836 4.5% -8.9% Suzuki 993 8.8% 8,683 3.3% 10,565 3.7% -17.8% Citroen 333 2.9% 7,995 3.0% 7,061 2.5% 13.2% Geely 774 6.8% 6,816 2.6% 163 0.1% 4081.6% Tesla 1,118 9.9% 6,047 2.3% 6,299 2.2% -4.0% Peugeot 73 0.6% 5,642 2.1% 7,577 2.6% -25.5% SEAT 137 1.2% 5,555 2.1% 11,453 4.0% -51.5% SAIC/MG 86 0.8% 5,081 1.9% 2,955 1.0% 71.9% Chevrolet 40 0.4% 4,721 1.8% 8,265 2.9% -42.9% Subaru 103 0.9% 4,363 1.6% 5,496 1.9% -20.6% Mercedes...
Automotive Sales Data Updated at: 2025/06/04
China - Flash report, Automotive sales volume, 2022
local plant) to be released later on our data for monthly sales volume This is due to the difference in calculation methods. Passenger Car retail sales by Chinese Makers Top10 - Maker Dec. 2022 (10,000) Y-o-Y 1 BYD Auto 22.4 128.6% 2 FAW-VW 18.0 15.5% 3 Changan Automobile 16.9 130.0% 4 SAIC VW 14.4 2.4% 5 Geely Automobile 12.6 -10.7% 6 SAIC GM 11.1 7.7% 7 FAW Toyota 10.2 -3.5% 8 GAC Toyota 10.0 0.2% 9 SAIC-GM-Wuling 9.1 -31...
Automotive Sales Data Updated at: 2025/06/04
Israel - Flash report, Automotive sales volume, 2021
225 3.7% 7,061 2.4% 5,901 2.8% 19.7% Tesla 950 15.5% 6,299 2.2% 0 0.0% -% Subaru 49 0.8% 5,495 1.9% 3,763 1.8% 46.0% VW 12 0.2% 4,392 1.5% 4,464 2.1% -1.6% Audi 3 0.0% 3,763 1.3% 3,180 1.5% 18.3% Mercedes-Benz 15 0.2% 3,609 1.2% 2,957 1.4% 22.0% BMW 3 0.0% 3,484 1.2% 2,047 1.0% 70.2% SAIC/MG 232 3.8% 3,111 1.1% 1,494 0.7% 108.2% Honda 28 0.5% 3,066 1.1% 2,542 1.2% 20.6% Jeep * 5 0.1% 2,517 0.9% 1,300 0.6% 93.6% Volvo 62 1.0% ...
Automotive Sales Data Updated at: 2025/06/04
China - Flash report, Automotive sales volume, 2021
by make (shipped from the local plant) to be released later on our data for monthly sales volume.This is due to the difference in calculation methods. Passenger Car retail sales by Chinese Makers Top10 - Maker Dec. 2021 (10,000) Y-o-Y 1 FAW-VW 15.6 -34.9% 2 Geely Automobile 14.2 -0.5% 3 SAIC VW 14.1 -13.3% 4 SAIC-GM-Wuling 13.3 -12.7% 5 Great Wall 12.5 2.5% 6 Dongfeng Nissan 11.4 -20.9% 7 FAW Toyota 10.6 27.3% 8 SAIC GM 10.3...
Automotive Sales Data Updated at: 2025/06/04
Israel - Flash report, Sales volume, 2020
63 1.8% 4,515 1.8% -16.7% Audi 6 0.1% 3,180 1.5% 3,827 1.5% -16.9% Mercedes-Benz 27 0.6% 2,957 1.4% 3,115 1.2% -5.1% Honda 62 1.4% 2,542 1.2% 5,206 2.1% -51.2% Dacia 123 2.8% 2,052 1.0% 3,162 1.2% -35.1% BMW 8 0.2% 2,047 1.0% 2,958 1.2% -30.8% Volvo 58 1.3% 1,739 0.8% 1,743 0.7% -0.2% SAIC/MG 90 2.0% 1,494 0.7% 1,112 0.4% 34.4% Lexus 66 1.5% 1,482 0.7% 1,618 0.6% -8.4% Jeep * 10 0.2% 1,300 0.6% 1,329 0.5% -2.2% Opel 64 1.4% 1,...
Automotive Sales Data Updated at: 2025/06/04
China - Flash report, Sales volume, 2020
may differ from the sales volume by make (shipped from the local plant) to be released later on our data for monthly sales volume. This is due to the difference in calculation methods. Passenger Car retail sales by Chinese Makers Top10 - Maker Dec. 2020 (10,000) Y-o-Y 1 FAW-VW 24.0 5.3% 2 SAIC GM 16.2 30.3% 3 SAIC VW 16.2 -26.7% 4 SAIC-GM-Wuling 15.2 9.6% 5 Dongfeng Nissan 14.4 0.5% 6 Geely Automobile 14.2 12.3% 7 Great Wall 1...
Automotive Sales Data Updated at: 2025/06/04
Global Sales of Major Automakers and Groups
Groups 2024 (units in thousands) 2023 (units in thousands) Y-o-Y 1 Toyota Group 10,821 11,233 -3.7% 2 VW Group 9,027 9,240 -2.3% 3 Hyundai-Kia Group * 7,231 7,304 -1.0% 4 GM 6,001 6,189 -3.0% 5 Stellantis * 5,526 6,393 -13.6% 6 Ford 4,470 4,413 1% 7 BYD 4,272 3,024 41.3% 8 SAIC * 4,013 5,020 -20.1% 9 Honda 3,812 4,061 -6.1% 10 Nissan 3,349 3,374 -0.8% Sources: Annual reports and financial statements issued by each...
Automotive Sales Data Updated at: 2025/04/14
Global Sales of Major Automakers and Groups
1 Toyota Group 10,483 10,496 -0.1% 2 VW Group 8,263 8,882 -7.0% 3 Hyundai-Kia Group 6,845 6,667 2.7% 4 Renault-Nissan-Mitsubishi 6,157 7,216 -14.7% 5 Stellantis 6,003 6,142 -2.3% 6 GM 5,939 6,296 -5.7% 7 Ford 4,000 4,200 -4.8% 8 Honda 3,814 4,121 -7.4% 9 Suzuki 2,968 2,764 7.4% 10 SAIC Group 2,785 2,860 -2.6% Sources: Annual reports and financial statements issued by each company, news releases etc. ...
Automotive Sales Data Updated at: 2025/04/14
Israel - Flash report, Sales volume, 2019
77 3.2% 2,958 1.2% 3,312 1.2% -10.7% Volvo 36 0.6% 1,743 0.7% 1,628 0.6% 7.1% Lexus 61 1.1% 1,618 0.6% 1,515 0.6% 6.8% Isuzu 21 0.4% 1,518 0.6% 1,384 0.5% 9.7% Fiat 76 1.4% 1,493 0.6% 2,864 1.1% -47.9% Jeep * 26 0.5% 1,329 0.5% 1,011 0.4% 31.5% Opel 6 0.1% 1,151 0.5% 3,060 1.1% -62.4% SAIC/MG 15 0.3% 1,112 0.4% 515 0.2% 115.9% Ford 15 0.3% 1,071 0.4% 1,701 0.6% -37.0% MINI 29 0.5% 553 0.2% 561 0.2% -1.4% Land Rover 33 0.6% 485...
Automotive Sales Data Updated at: 2020/03/13
Israel - Flash report, Sales volume, 2018
vo 40 0.8% 1,628 0.6% 1,284 0.5% 26.8% Lexus 62 1.2% 1,515 0.6% 1,227 0.4% 23.5% Isuzu 30 0.6% 1,384 0.5% 1,597 0.6% -13.3% Jeep * 48 0.9% 1,011 0.4% 977 0.3% 3.5% Alfa Romeo 57 1.1% 635 0.2% 718 0.3% -11.6% MINI 9 0.2% 561 0.2% 659 0.2% -14.9% Infiniti 64 1.3% 558 0.2% 414 0.1% 34.8% SAIC/MG 15 0.3% 515 0.2% 257 0.1% 100.4% Cadillac 0 0.0% 461 0.2% 525 0.2% -12.2% Ssangyong 11 0.2% 385 0.1% 305 0.1% 26.2% Land Rover 8 0.2% 31...
Automotive Sales Data Updated at: 2019/01/07
Israel - Flash report, Sales volume, 2017
Jeep * 61 1.1% 977 0.3% 744 0.3% 31.3% Alfa Romeo 19 0.3% 718 0.3% 510 0.2% 40.8% MINI 22 0.4% 659 0.2% 658 0.2% 0.2% Cadillac 3 0.1% 525 0.2% 285 0.1% 84.2% Infiniti 7 0.1% 414 0.1% 348 0.1% 19.0% Ssangyong 4 0.1% 305 0.1% 435 0.2% -29.9% Land Rover 10 0.2% 294 0.1% 339 0.1% -13.3% SAIC/MG 0 0.0% 257 0.1% 289 0.1% -11.1% Porsche 0 0.0% 165 0.1% 92 0.0% 79.3% Maserati 0 0.0% 121 0.0% 53 0.0% 128.3% Jaguar 1 0.0% 112 0.0% 172...
Automotive Sales Data Updated at: 2018/07/24
Israel - Flash report, Sales volume, 2016
% Volvo 26 0.4% 1,261 0.4% 1,020 0.4% 23.6% Jeep * 41 0.6% 744 0.3% 728 0.3% 2.2% MINI 46 0.7% 658 0.2% 611 0.2% 7.7% Alfa Romeo 37 0.5% 510 0.2% 522 0.2% -2.3% Ssangyong 8 0.1% 435 0.2% 225 0.1% 93.3% Infiniti 2 0.0% 348 0.1% 385 0.2% -9.6% Land Rover 7 0.1% 339 0.1% 188 0.1% 80.3% SAIC/MG 40 0.6% 289 0.1% 873 0.3% -66.9% Cadillac 14 0.2% 285 0.1% 362 0.1% -21.3% Chrysler * 22 0.3% 192 0.1% 142 0.1% 35.2% smart 2 0.0% 175 0...
Automotive Sales Data Updated at: 2017/01/06

 Japan
Japan USA
USA Mexico
 Germany
 China (Shanghai)
 Thailand
 India
India