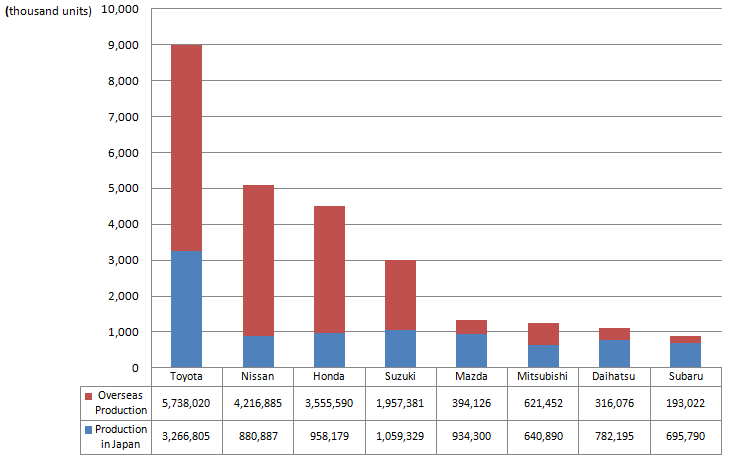
2014 global production volume by Japanese OEMs (Preliminary)

| Global Production |
Production in Japan | Overseas Production |
||||||
|---|---|---|---|---|---|---|---|---|
| Total | Pct.chg. | Total | Pct.chg. | PCs | CVs | Total | Pct.chg. | |
| Toyota * | 9,004,825 | 1.3% | 3,266,805 | -2.7% | 2,915,185 | 351,620 | 5,738,020 | 3.7% |
| Nissan | 5,097,772 | 3.0% | 880,887 | -8.7% | 764,230 | 116,657 | 4,216,885 | 5.8% |
| Honda | 4,513,769 | 5.0% | 958,179 | 14.0% | - | - | 3,555,590 | 2.8% |
| Suzuki | 3,016,710 | 6.0% | 1,059,329 | 8.6% | - | - | 1,957,381 | 4.6% |
| Mazda | 1,328,426 | 5.0% | 934,300 | -3.3% | 918,502 | 15,798 | 394,126 | 32.2% |
| Mitsubishi | 1,262,342 | 1.8% | 640,890 | 8.3% | 637,897 | 2,993 | 621,452 | -4.0% |
| Daihatsu | 1,098,271 | 5.0% | 782,195 | 0.9% | 597,043 | 185,152 | 316,076 | 16.6% |
| Subaru | 888,812 | 9.9% | 695,790 | 8.8% | - | - | 193,022 | 14.1% |
| Total | 26,210,927 | 3.4% | 9,218,375 | 1.2% | - | - | 16,992,552 | 4.7% |
- Mark "-" in the table denotes "No production" or "No detailed information available."
- The year-over-year ratio of the 8 automakers' total production volume was calculated by MarkLines using the total 2013 figure obtained from each automaker's press releases.
*Toyota Group: 10,285,546 units, including Daihatsu: 1,098,271 units and Hino: 182,450 units)
Source: Compiled from domestic and overseas production figures published in press releases by each automaker.
(As of Jan. 28, 2015)


