


Search Results by Category
All information related to {{ key_word }}.
AI Navigator will guide you. Click here for information about {{ key_word }}.
Tata AutoComp Systems Ltd.
-An affiliated company of Tata Group.
Images
 2
2
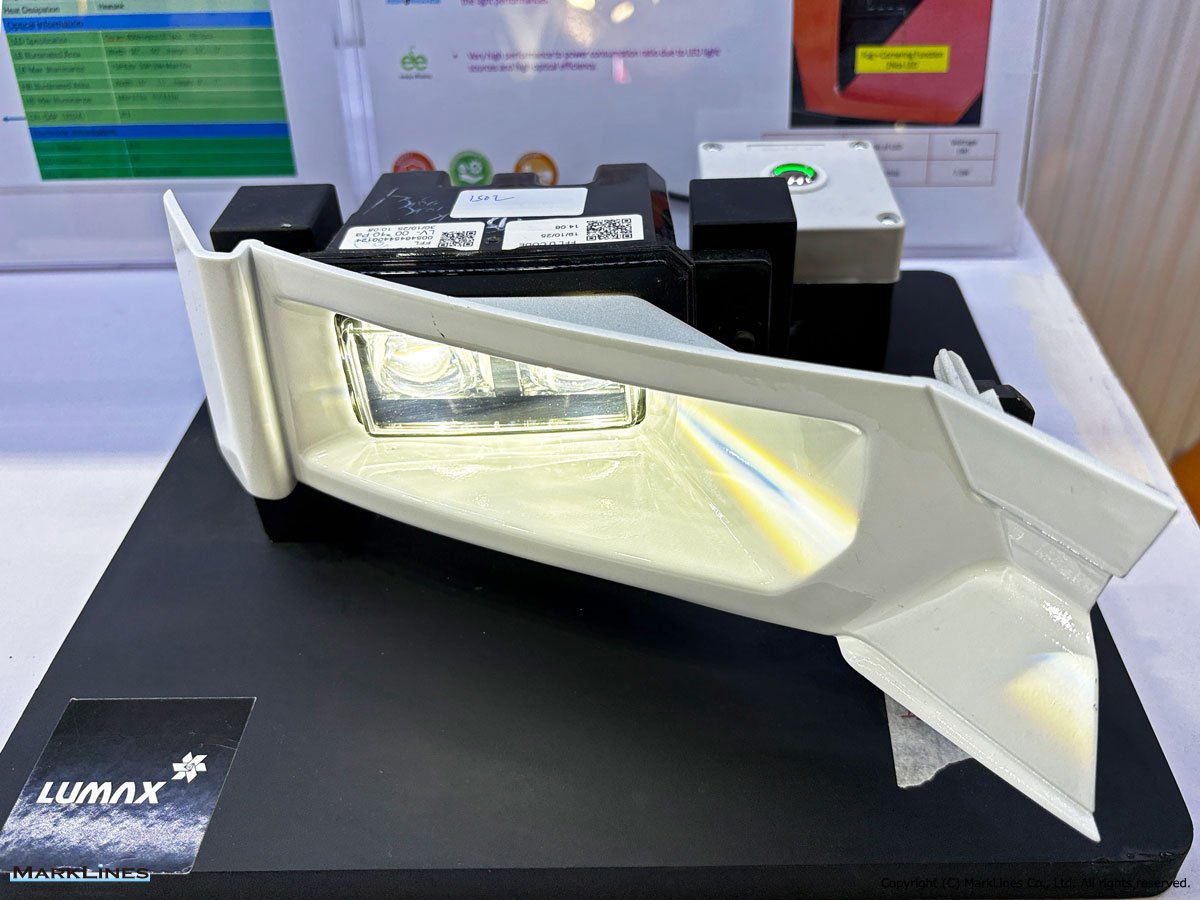
Nexon front fog lamp
 1
1
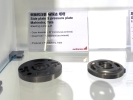
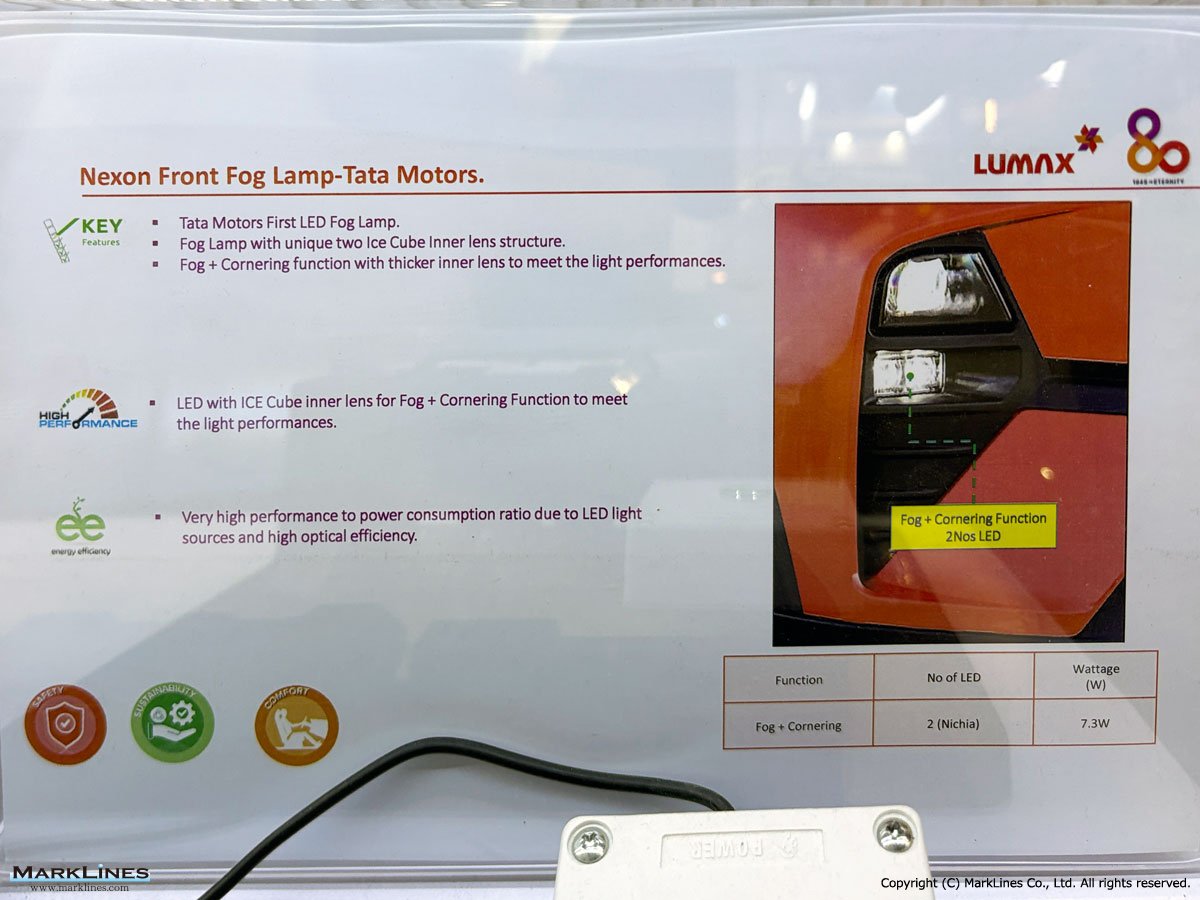
Side plate and pressure plate (Mahindra, Tata)
 2
2
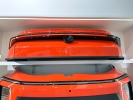
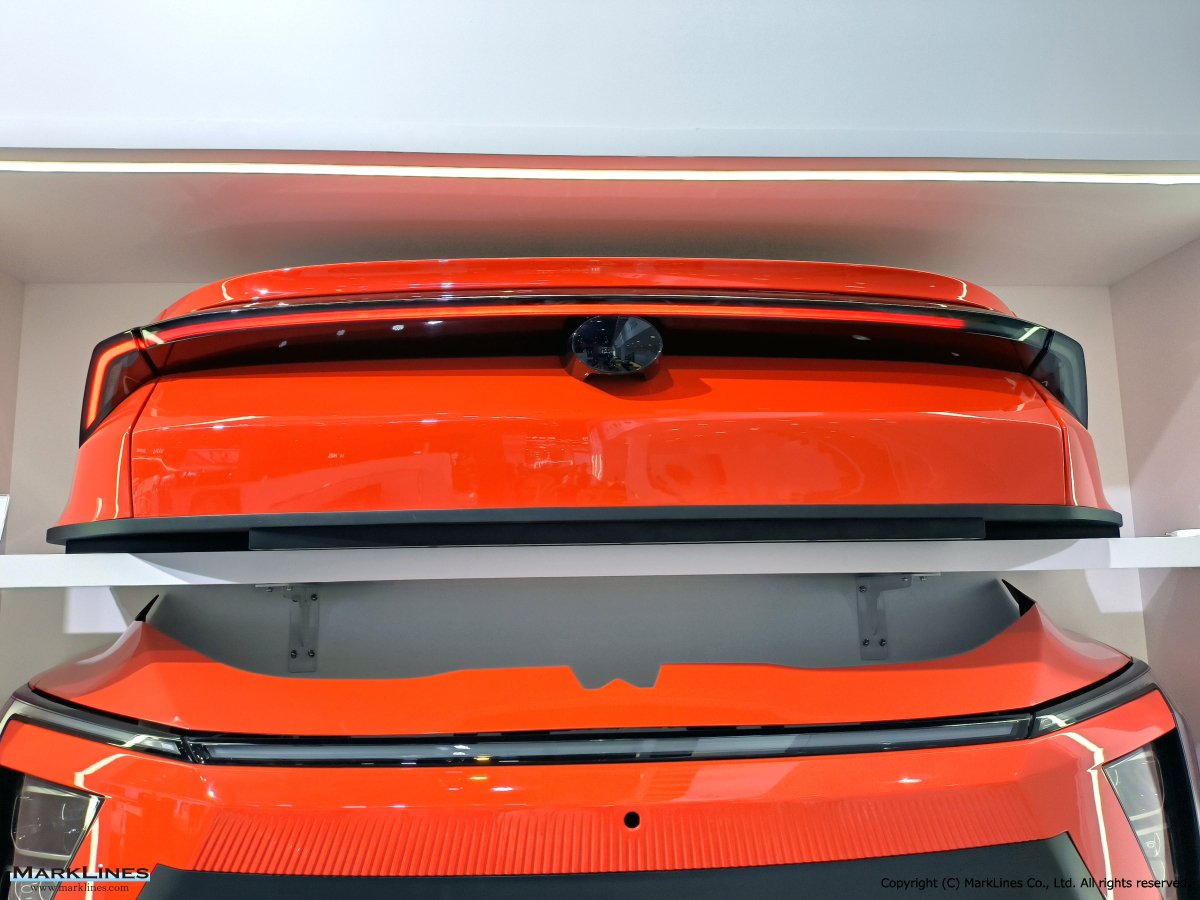
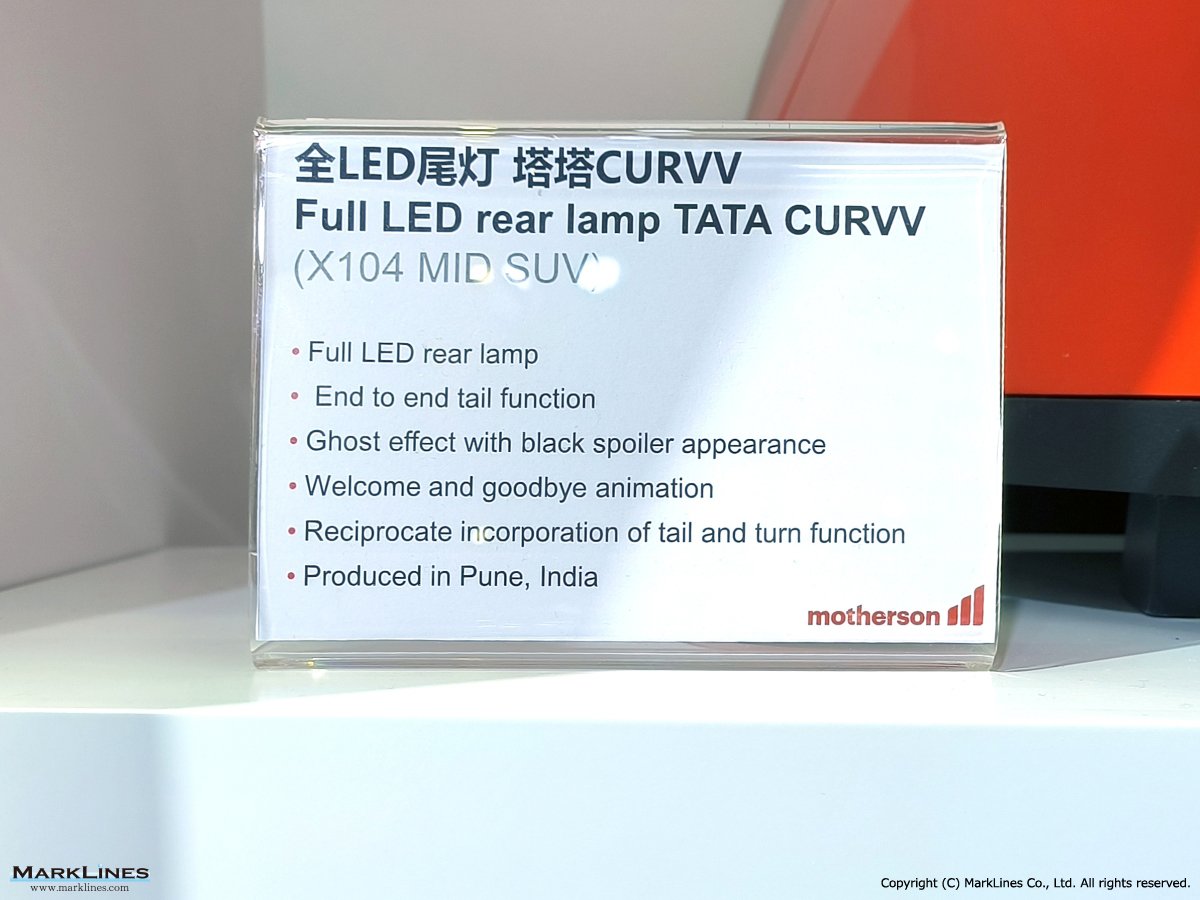
Full LED rear lamp (Tata CURVV)
 1
1
Silent block bush (Tata)
 7
7
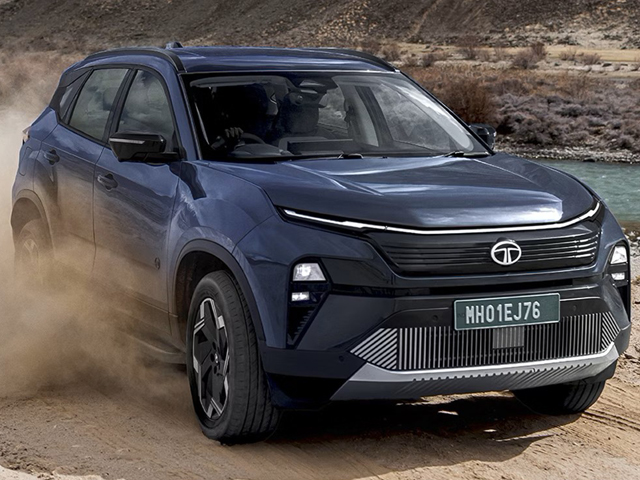
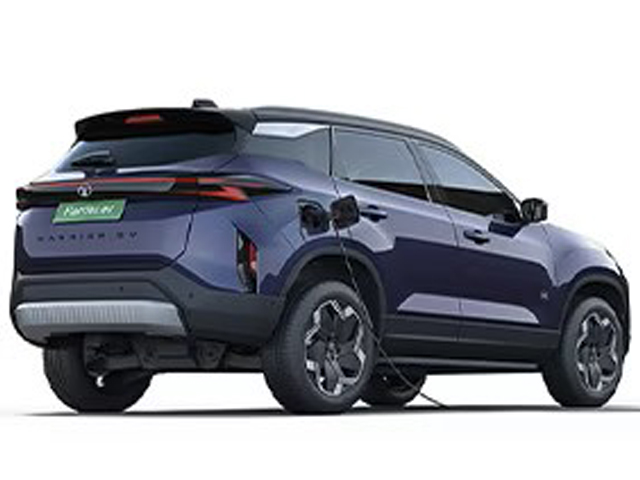
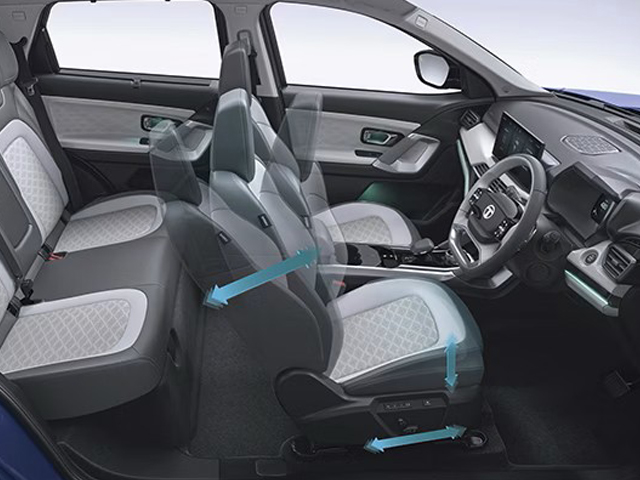
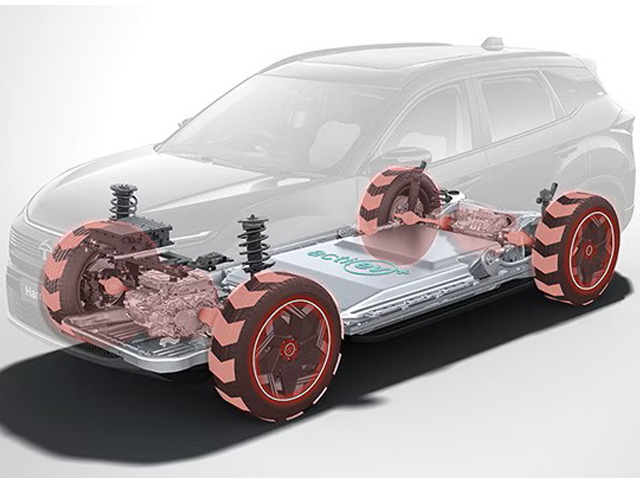
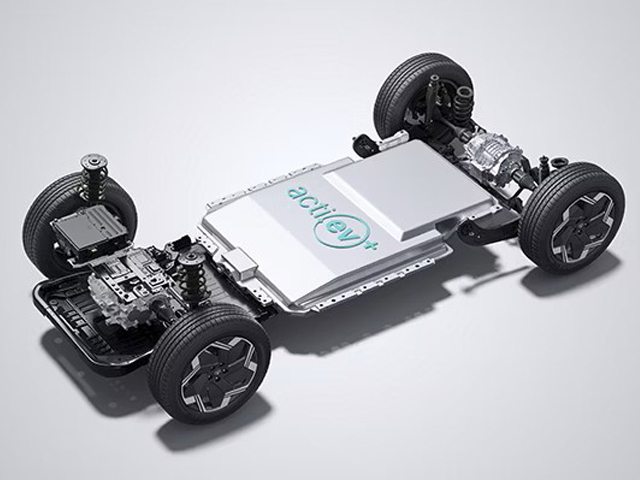
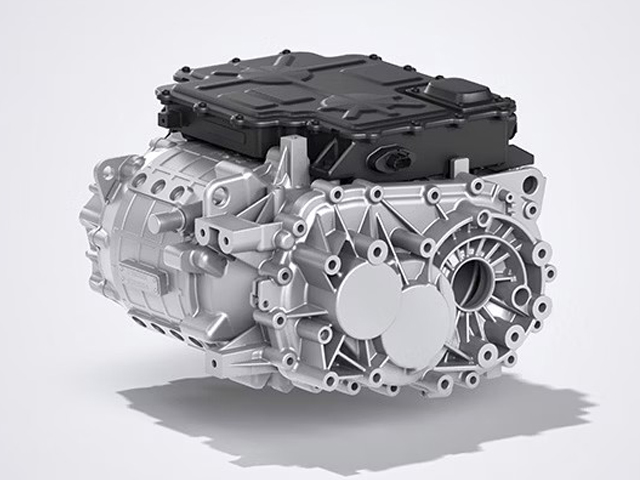
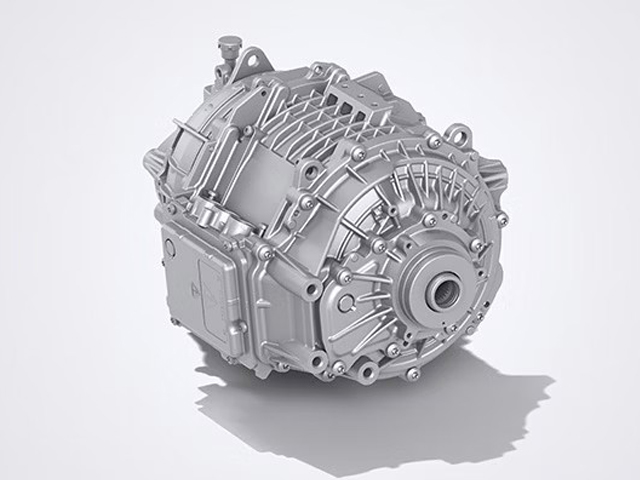
Harrier.ev
 1
1
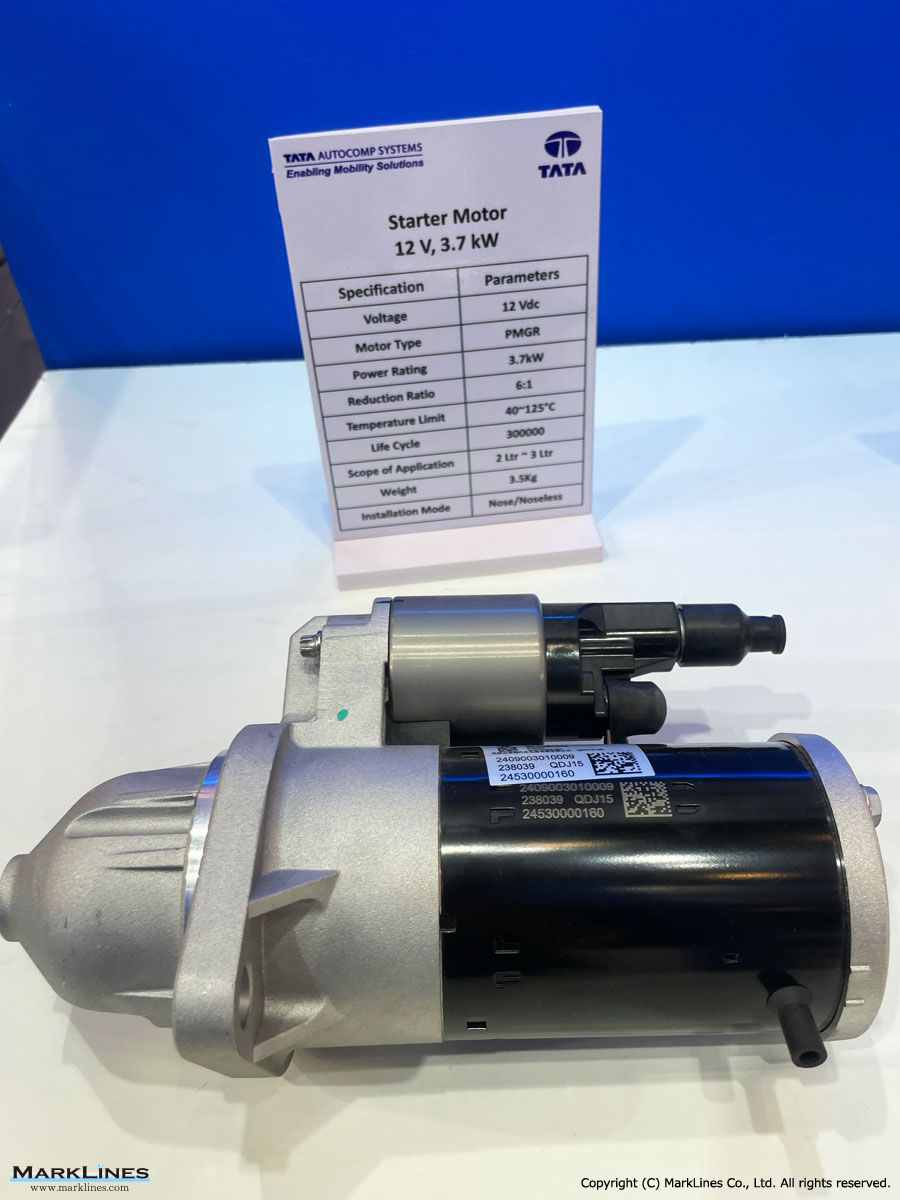
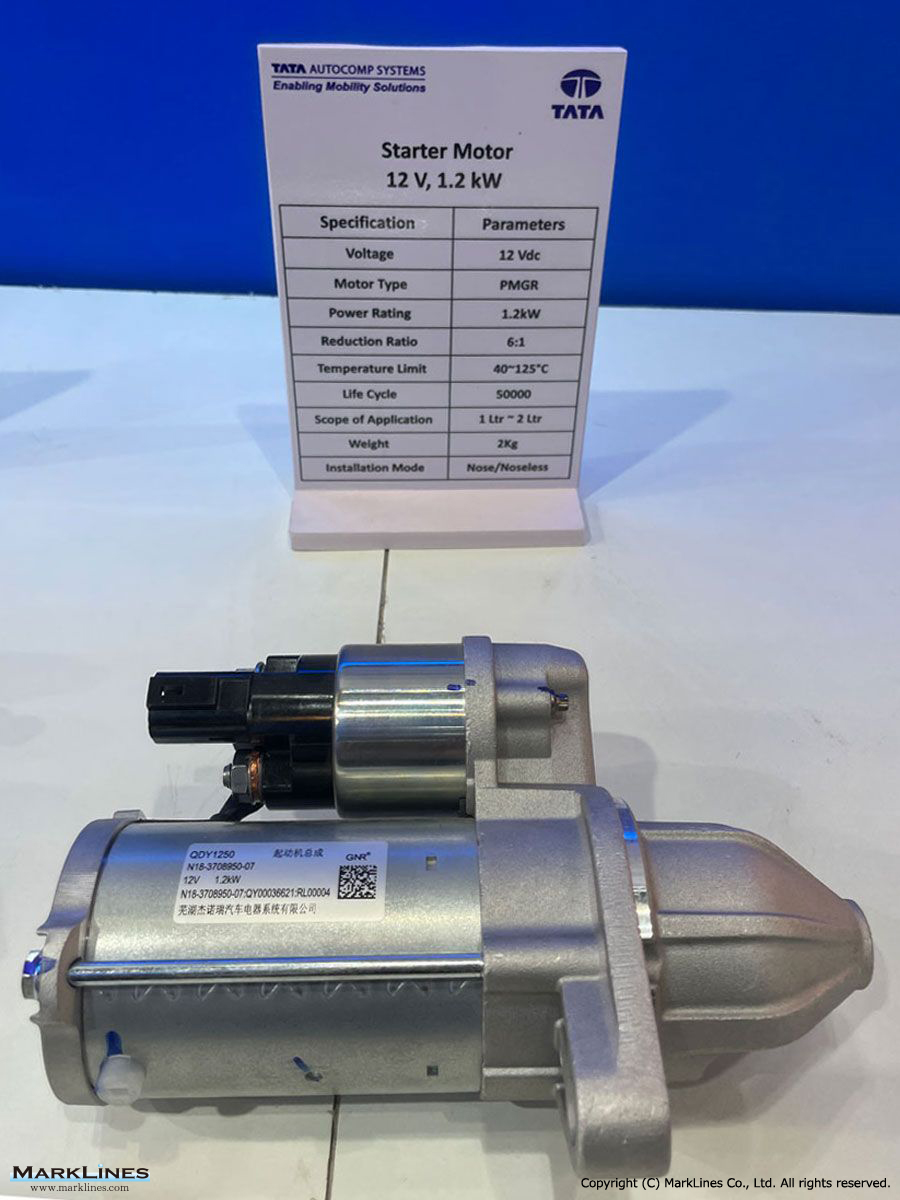
Starter motor
 1
1
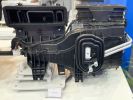
Dual zone HVAC Unit
 1
1
HVAC Unit
 1
1
Starter motor
 1
1
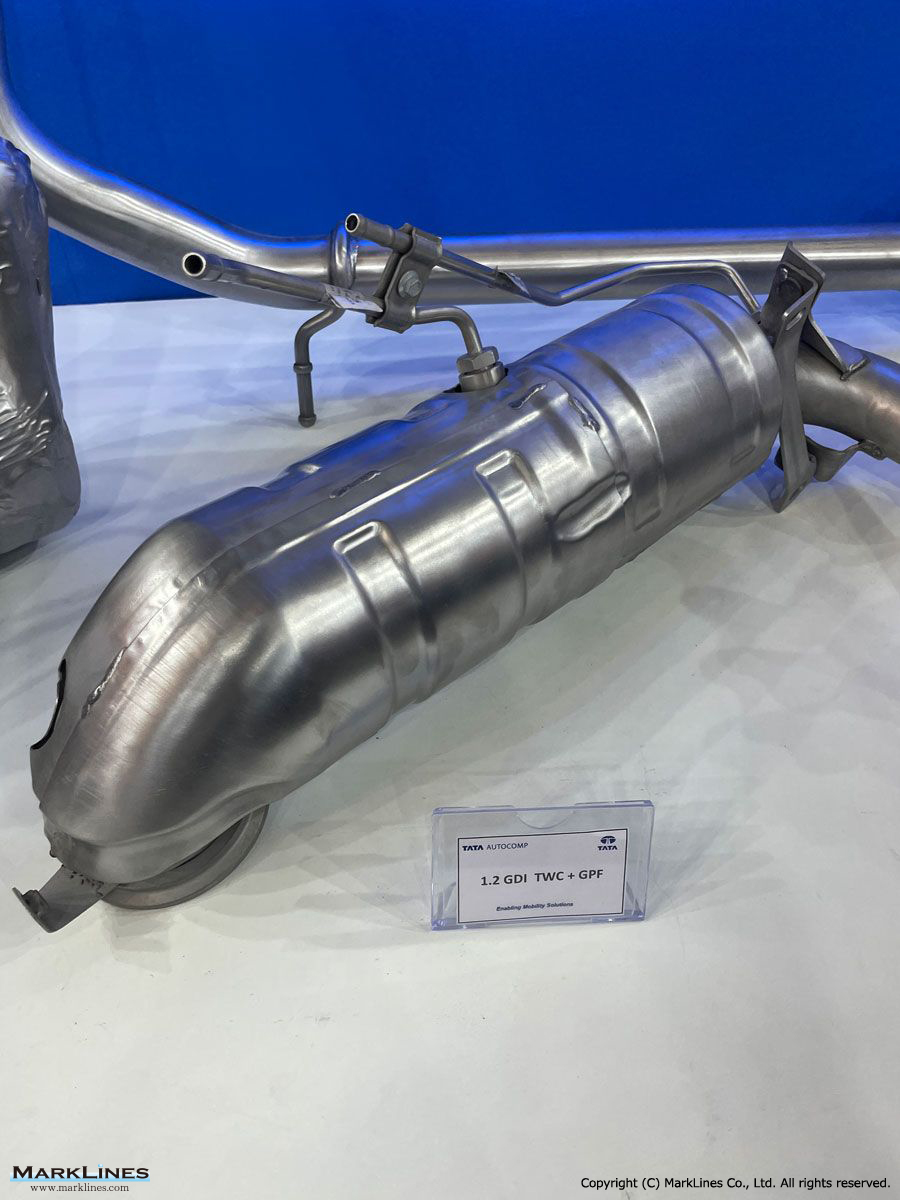
Three-way catalytic converter with Gas Particulate Filter
Sort by :
1 - 20 of 28 results
Korea - Automotive production in 2026 by OEM
0% Hyundai 144,399 39.9% 172,268 44.7% -16.2% 582,212 42.0% 625,917 44.7% -7.0% GM Korea 50,373 13.9% 43,669 11.3% 15.4% 184,793 13.3% 156,381 11.2% 18.2% KGM 9,789 2.7% 9,013 2.3% 8.6% 35,261 2.5% 33,019 2.4% 6.8% Renault Korea 7,821 2.2% 11,545 3.0% -32.3% 27,795 2.0% 31,506 2.3% -11.8% Tata Daewoo 544 0.2% 832 0.2% -34.6% 1,884 0.1% 2,639 0.2% -28.6% Total 361,926 100.0% 385,624 100.0% -6.1% 1,387,043 100.0% 1,398,902 100.0% -0...
Automotive Production Data Updated at: 2026/05/20
India - Automotive production in 2026 by OEM, vehicle type
ia Pvt Ltd 6,961 1.6% 7,962 2.0% -12.6% JSW MG Motor India Pvt Ltd 1,467 0.3% 992 0.3% 47.9% Stellantis India Pvt Ltd 590 0.1% 490 0.1% 20.4% FCA India Automobiles Pvt Ltd 334 0.1% 451 0.1% -25.9% Force Motors Ltd 272 0.1% 167 0.0% 62.9% Isuzu Motors India Pvt Ltd 16 0.0% 1 0.0% 1500.0% Tata Motors Ltd N/A -% N/A -% -% Total Passenger Vehicles 439,259 100.0% 389,254 100.0% 12.8% Sales of new commercial vehicles Make 2...
Automotive Production Data Updated at: 2026/05/14
Korea - Automotive production in 2025 by OEM
Kia 141,151 39.0% 134,645 36.1% 4.8% 1,597,340 38.9% 1,548,219 37.5% 3.2% GM Korea 49,247 13.6% 50,275 13.5% -2.0% 460,826 11.2% 494,072 12.0% -6.7% KGM 8,219 2.3% 10,349 2.8% -20.6% 106,137 2.6% 108,526 2.6% -2.2% Renault Korea 2,334 0.6% 14,961 4.0% -84.4% 84,185 2.1% 111,577 2.7% -24.5% Tata Daewoo 427 0.1% 645 0.2% -33.8% 7,230 0.2% 7,992 0.2% -9.5% Total 362,356 100.0% 373,361 100.0% -2.9% 4,101,992 100.0% 4,128,242 100.0% -0....
Automotive Production Data Updated at: 2026/02/19
India - Automotive production in 2025 by OEM, vehicle type
Honda Cars India Ltd 4,920 1.2% -46.1% SkodaAuto India Pvt Ltd 3,255 0.8% 34.4% Volkswagen India Pvt Ltd 1,976 0.5% -59.8% JSW MG Motor India Pvt Ltd 967 0.2% -53.1% Stellantis India Pvt Ltd 768 0.2% 460.6% FCA India Automobiles Pvt Ltd 445 0.1% 26.4% Force Motors Ltd 413 0.1% 42.9% Tata Motors Ltd N/A -% -% Total Passenger Vehicles 394,361 100.0% 23.1% Commercial Vehicles Make 2025 Dec. Y-o-Y (%) 2025 Oct.-Dec. Y-o-Y (%) ...
Automotive Production Data Updated at: 2026/02/13
Korea - Automotive production in 2024 by OEM
% Kia 134,645 36.0% 132,017 35.9% 2.0% 1,548,219 37.5% 1,606,253 37.9% -3.6% GM Korea 50,275 13.5% 50,006 13.6% 0.5% 494,072 12.0% 464,648 10.9% 6.3% Renault Korea 14,961 4.0% 5,489 1.5% 172.6% 111,577 2.7% 97,756 2.3% 14.1% KGM 10,349 2.8% 6,811 1.9% 51.9% 108,526 2.6% 119,980 2.8% -9.5% Tata Daewoo 645 0.2% 677 0.2% -4.7% 7,992 0.2% 8,513 0.2% -6.1% Total 373,566 100.0% 367,631 100.0% 1.6% 4,128,447 100.0% 4,243,597 100.0% -2.7%...
Automotive Production Data Updated at: 2025/07/04
India - Automotive production in 2024 by OEM, vehicle type
vt Ltd 4,921 1.5 -34.6 Renault India Pvt Ltd 2,835 0.9 195.0 SkodaAuto India Pvt Ltd 2,421 0.8 -30.7 JSW MG Motor India Pvt Ltd 2,064 0.6 -46.3 FCA India Automobiles Pvt Ltd 352 0.1 -1.1 Force Motors Ltd 289 0.1 -8.5 PCA Motors Pvt. Ltd 137 0.0 1,270.0 Ford India Private Ltd N/A - - Tata Motors Ltd N/A - - Total Passenger Vehicles 320,476 100.0 9.2 Commercial Vehicles Make 2024 Dec. Y-o-Y (%) 2024 Oct.-Dec. Y-o-Y (%) ...
Automotive Production Data Updated at: 2025/07/04
India - Flash report, Automotive production volume, 2023
India Pvt Ltd 4,447 1.5 -32.4 MG Motor India Pvt Ltd 3,840 1.3 -18.7 SkodaAuto India Pvt Ltd 3,494 1.2 -3.9 Renault India Pvt Ltd 961 0.3 -85.6 FCA India Automobiles Pvt Ltd 356 0.1 -31.4 Force Motors Ltd 316 0.1 444.8 PCA Motors Pvt. Ltd 10 0.0 -96.6 Ford India Private Ltd N/A - - Tata Motors Ltd N/A - - Total Passenger Vehicles (PVs) 293,344 100.0 3.6 CommercialVehicles Make 2023 Dec. Y-o-Y (%) 2023 Oct.-Dec. Y-o-Y (%...
Automotive Production Data Updated at: 2025/06/04
Korea - Flash report, Automotive production volume, 2023
147,421 41.7% -10.4% 1,606,253 37.9% 1,472,963 39.2% 9.0% GM Korea 50,006 13.6% 18,704 5.3% 167.4% 464,648 10.9% 258,260 6.9% 79.9% KG Mobility / Ssangyong 6,811 1.9% 9,355 2.6% -27.2% 119,980 2.8% 115,329 3.1% 4.0% Renault Korea 5,489 1.5% 6,432 1.8% -14.7% 97,756 2.3% 168,478 4.5% -42.0% Tata Daewoo 677 0.2% 858 0.2% -21.1% 8,513 0.2% 9,702 0.3% -12.3% Total 367,622 100.0% 353,372 100.0% 4.0% 4,243,588 100.0% 3,757,049 100.0% 13....
Automotive Production Data Updated at: 2025/06/04
India - Flash report, Automotive production volume, 2022
or India Pvt Ltd 6,577 2.3 -6.8 MG Motor India Pvt Ltd 4,724 1.7 21.1 SkodaAuto India Pvt Ltd 3,635 1.3 -1.8 FCA India Automobiles Pvt Ltd 519 0.2 -47.2 PCA Motors Pvt. Ltd 291 0.1 5720 Force Motors Ltd 58 0.0 -42 Isuzu Motors India Pvt Ltd 3 0.0 -98.9 Ford India Private Ltd N/A - - Tata Motors Ltd* N/A - - Total Passenger Vehicles (PVs) 283,028 100.0 3.2 Commercial Vehicles Make 2022 Dec. Y-o-Y (%) 2022 Oct.-Dec. Y-o-Y (%...
Automotive Production Data Updated at: 2025/06/04
Korea - Flash report, Automotive production volume, 2022
Kia 147,421 41.7% 129,558 40.6% 13.8% 1,472,963 39.2% 1,398,966 40.4% 5.3% GM Korea 18,704 5.3% 10,683 3.3% 75.1% 258,260 6.9% 223,623 6.5% 15.5% Renault Korea 6,432 1.8% 14,978 4.7% -57.1% 168,478 4.5% 128,328 3.7% 31.3% Ssangyong 9,355 2.6% 8,981 2.8% 4.2% 115,329 3.1% 82,009 2.4% 40.6% Tata Daewoo 858 0.2% 1,270 0.4% -32.4% 9,702 0.3% 9,342 0.3% 3.9% Total 353,405 100.0% 319,197 100.0% 10.7% 3,757,065 100.0% 3,462,499 100.0% 8....
Automotive Production Data Updated at: 2025/06/04
India - Flash report, Automotive production volume, 2021
MG Motor India Pvt Ltd 3,901 1.4 -7.2 SkodaAuto India Pvt Ltd 3,703 1.4 303.8 FCA India Automobiles Pvt Ltd 983 0.4 52.6 Isuzu Motors India Pvt Ltd 268 0.1 - Force Motors Ltd 100 0.0 - PCA Motors Pvt. Ltd 5 0.0 - Ford India Private Ltd N/A - - General Motors India Pvt Ltd N/A - - Tata Motors Ltd* N/A - - Total Passenger Vehicles (PVs) 274,227 100.0 -13.2 Commercial Vehicles Make 2021 Dec. Y-o-Y (%) 2021 Oct.-Dec. Y-o-...
Automotive Production Data Updated at: 2025/06/04
Korea - Flash report, Automotive production volume, 2021
29,558 40.6% 95,174 32.1% 36.1% 1,398,966 40.4% 1,307,265 37.3% 7.0% GM Korea 10,683 3.3% 43,892 14.8% -75.7% 223,623 6.5% 354,800 10.1% -37.0% Renault Samsung 14,978 4.7% 5,372 1.8% 178.8% 128,328 3.7% 114,630 3.3% 11.9% Ssangyong 8,981 2.8% 9,638 3.2% -6.8% 82,009 2.4% 106,840 3.0% -23.2% Tata Daewoo 1,150 0.4% 460 0.2% 150.0% 9,222 0.3% 4,121 0.1% 123.8% Daewoo Bus 0 0.0% 0 0.0% -% 0 0.0% 707 0.0% -100.0% Total 319,071 100.0% 296,...
Automotive Production Data Updated at: 2025/06/04
India - Flash report, Production volume, 2020
Ford India Private Ltd 6,943 2.2 -43.0 Volkswagen India Pvt Ltd 5,692 1.8 24.9 MG Motor India Pvt Ltd 4,202 1.3 26.8 Toyota Kirloskar Motor Pvt Ltd 3,288 1 -40.0 General Motors India Pvt Ltd 2,043 0.6 -59.2 SkodaAuto India Pvt Ltd 917 0.3 13.2 FCA India Automobiles Pvt Ltd 644 0.2 9.7 Tata Motors Ltd N/A - - Total Passenger Vehicles (PVs) 315,838 100 24.2 Commercial Vehicles Make 2020 Dec. Y-o-Y (%) 2020 Oct.-Dec. Y-o-Y (...
Automotive Production Data Updated at: 2025/06/04
Korea - Flash report, Production volume, 2020
2.1% 113,869 33.7% -16.4% 1,307,254 37.3% 1,450,102 36.7% -9.9% GM Korea 43,892 14.8% 33,801 10.0% 29.9% 354,800 10.1% 409,830 10.4% -13.4% Renault Samsung 5,372 1.8% 12,510 3.7% -57.1% 114,630 3.3% 164,974 4.2% -30.5% Ssangyong 9,638 3.2% 12,065 3.6% -20.1% 106,836 3.0% 132,994 3.4% -19.7% Tata Daewoo 460 0.2% 339 0.1% 35.7% 4,121 0.1% 4,669 0.1% -11.7% Daewoo Bus 0 0.0% 214 0.1% -100.0% 796 0.0% 1,914 0.0% -58.4% Total 296,895 100....
Automotive Production Data Updated at: 2025/06/04
Korea - Flash report, Production volume, 2019
33.7% 130,471 36.6% -12.7% 1,450,102 36.7% 1,469,415 36.5% -1.3% GM Korea 33,801 10.0% 35,251 9.9% -4.1% 409,830 10.4% 444,816 11.0% -7.9% Renault Samsung 12,502 3.7% 14,534 4.1% -14.0% 164,941 4.2% 215,680 5.4% -23.5% Ssangyong 12,065 3.6% 13,235 3.7% -8.8% 132,994 3.4% 142,138 3.5% -6.4% Tata Daewoo 339 0.1% 355 0.1% -4.5% 4,669 0.1% 6,692 0.2% -30.2% Daewoo Bus 214 0.1% 273 0.1% -21.6% 1,914 0.0% 2,127 0.1% -10.0% Total 337,504 1...
Automotive Production Data Updated at: 2020/01/17
India - Flash report, Production volume, 2019
r Vehicles Make 2019 Y-o-Y (%) Dec. Share (%) Maruti Suzuki India Ltd 114,962 44.5 7.5 Hyundai Motor India Ltd 46,670 18.1 -23.5 Mahindra & Mahindra Ltd 15,282 5.9 23.9 Renault India Pvt Ltd 12,708 4.9 62.7 Ford India Pvt Ltd 12,172 4.7 -35.5 Kia Motors India Pvt Ltd 10,742 4.2 - Tata Motors Ltd 9,552 3.7 -24.6 Honda Cars India Ltd 9,450 3.7 -29.5 Nissan Motor India Pvt Ltd 6,770 2.6 27.7 Toyota Kirloskar Motor Pvt Ltd 5,...
Automotive Production Data Updated at: 2020/01/14
Korea - Flash report, Production volume, 2018
36.6% 116,646 40.6% 11.9% 1,469,415 36.5% 1,522,520 37.0% -3.5% GM Korea 35,251 9.9% 39,331 13.7% -10.4% 444,816 11.0% 519,385 12.6% -14.4% Renault Samsung 14,547 4.1% 19,685 6.9% -26.1% 215,704 5.4% 264,037 6.4% -18.3% Ssangyong 13,235 3.7% 11,892 4.1% 11.3% 142,138 3.5% 145,345 3.5% -2.2% Tata Daewoo 355 0.1% 459 0.2% -22.7% 6,692 0.2% 9,481 0.2% -29.4% Daewoo Bus 273 0.1% 275 0.1% -0.7% 2,127 0.1% 2,435 0.1% -12.6% Total 356,940 ...
Automotive Production Data Updated at: 2019/01/21
India - Flash report, Production volume, 2018
preliminary reports and confirmed data. India - Production of vehicles Passenger Vehicles Make 2018 Y-o-Y (%) Dec. Share (%) Maruti Suzuki India Ltd 106,933 40.1 -12.1 Hyundai Motor India Ltd 60,992 22.9 -0.1 Ford India Pvt Ltd 18,874 7.1 -30.6 Honda Cars India Ltd 13,410 5.0 -13.1 Tata Motors Ltd 12,673 4.8 -0.7 Toyota Kirloskar Motor Pvt Ltd 12,324 4.6 -5.9 Mahindra & Mahindra Ltd 12,223 4.6 8.2 Renault India Pvt Ltd 7,81...
Automotive Production Data Updated at: 2019/01/15
India - Flash report, Production volume, 2017
- Production of vehicles Passenger Vehicles Make 2017 Y-o-Y (%) Dec. Share (%) Maruti Suzuki India Ltd 121,585 40.5 13.3 Hyundai Motor India Ltd 61,057 20.3 6.3 Ford India Pvt Ltd 27,210 9.1 38.8 Honda Cars India Ltd 15,423 5.1 149.9 Toyota Kirloskar Motor Pvt Ltd 13,090 4.4 -4.3 Tata Motors Ltd 12,765 4.2 48.1 Mahindra & Mahindra Ltd 11,295 3.8 -20.9 Volkswagen India Pvt Ltd 9,854 3.3 -15.4 Renault India Pvt Ltd 9,301 3....
Automotive Production Data Updated at: 2018/07/25
Korea - Flash report, Production volume, 2017
0.6% 168,516 38.8% -30.8% 1,522,520 37.0% 1,556,845 36.8% -2.2% GM Korea 39,331 13.7% 48,379 11.1% -18.7% 519,385 12.6% 579,745 13.7% -10.4% Renault Samsung 19,685 6.9% 25,990 6.0% -24.3% 264,037 6.4% 243,965 5.8% 8.2% Ssangyong 11,892 4.1% 15,900 3.7% -25.2% 145,345 3.5% 155,600 3.7% -6.6% Tata Daewoo 459 0.2% 1,101 0.3% -58.3% 9,481 0.2% 9,342 0.2% 1.5% Daewoo Bus 275 0.1% 368 0.1% -25.3% 2,435 0.1% 3,106 0.1% -21.6% Total 287,311...
Automotive Production Data Updated at: 2018/07/25


 Japan
Japan USA
USA Mexico
 Germany
 China (Shanghai)
 Thailand
 India
India