


Search Results by Category
All information related to {{ key_word }}.
AI Navigator will guide you. Click here for information about {{ key_word }}.
Images
 1
1
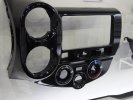
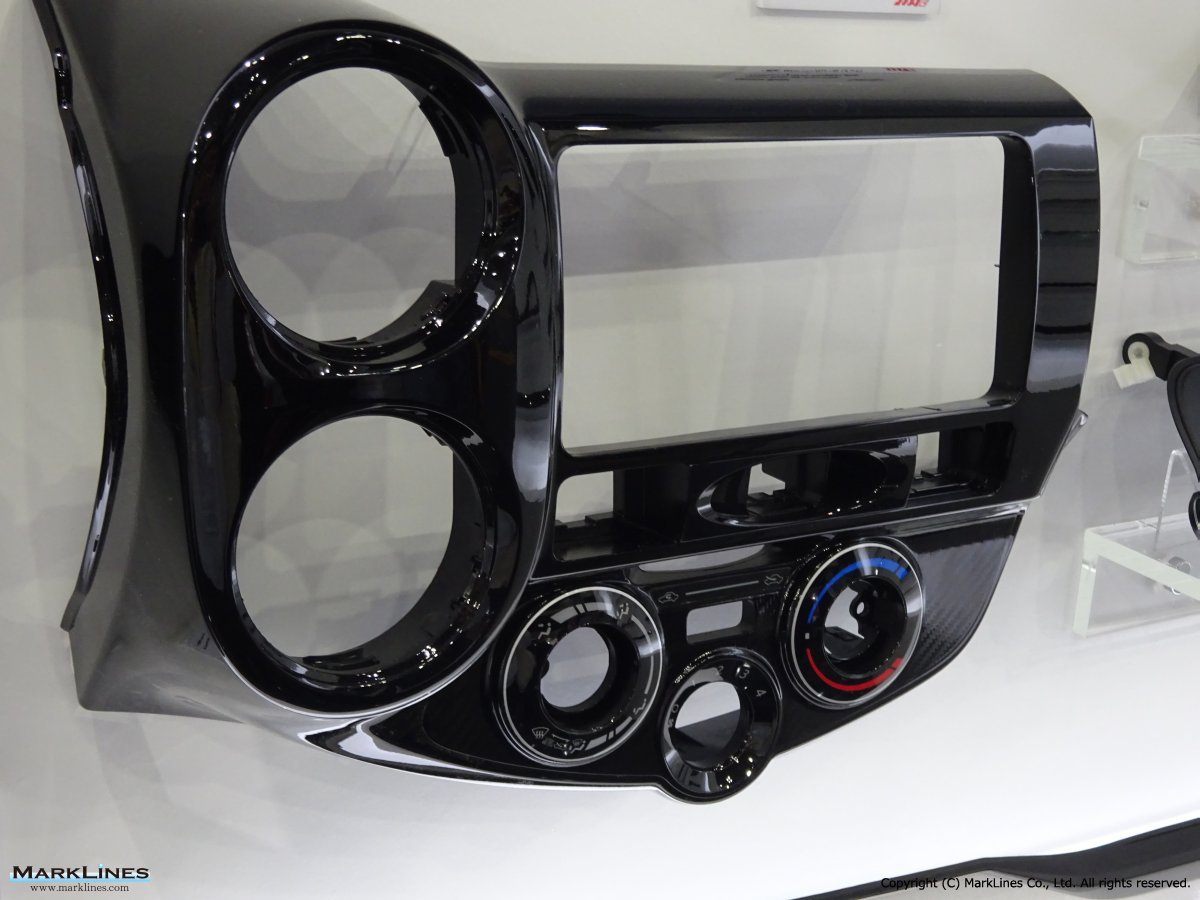
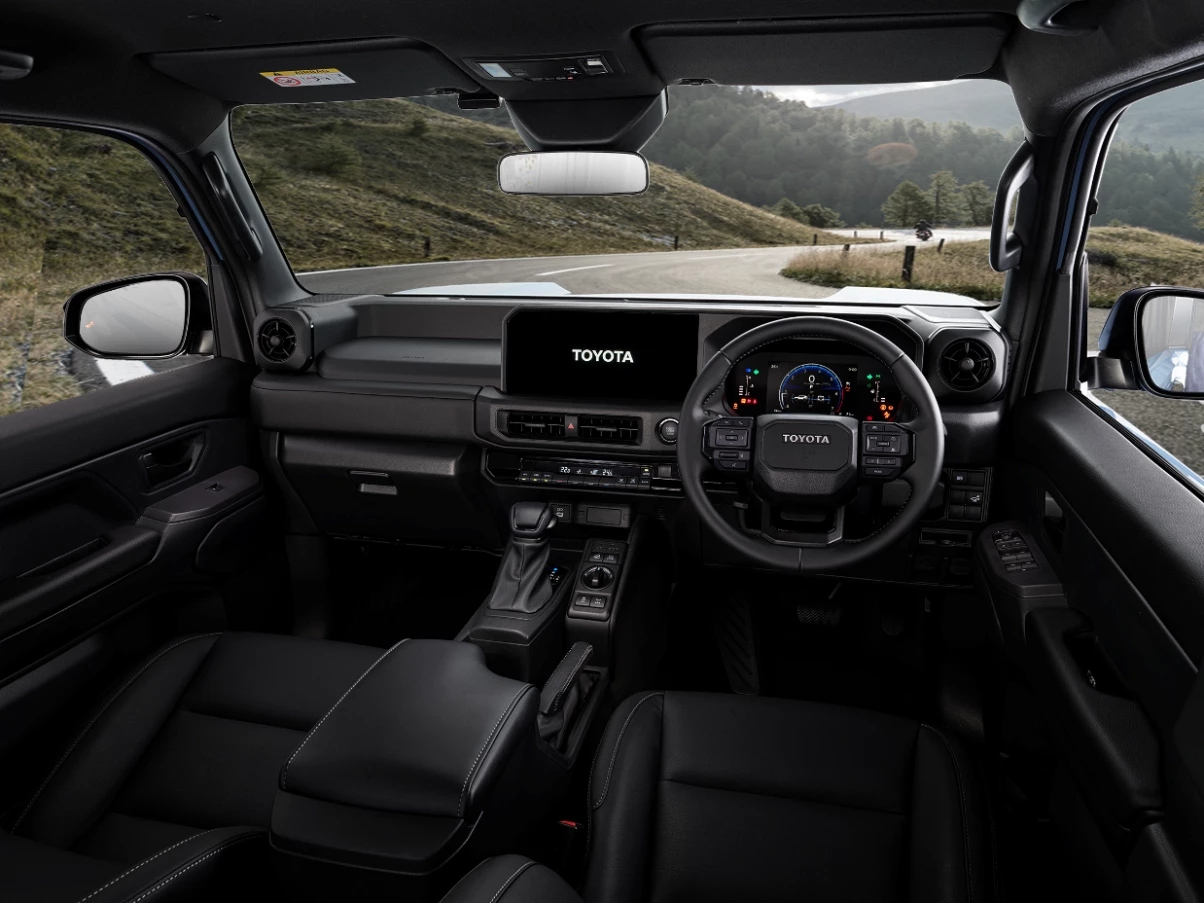
Cluster meter
1
Cluster meter
 2
2
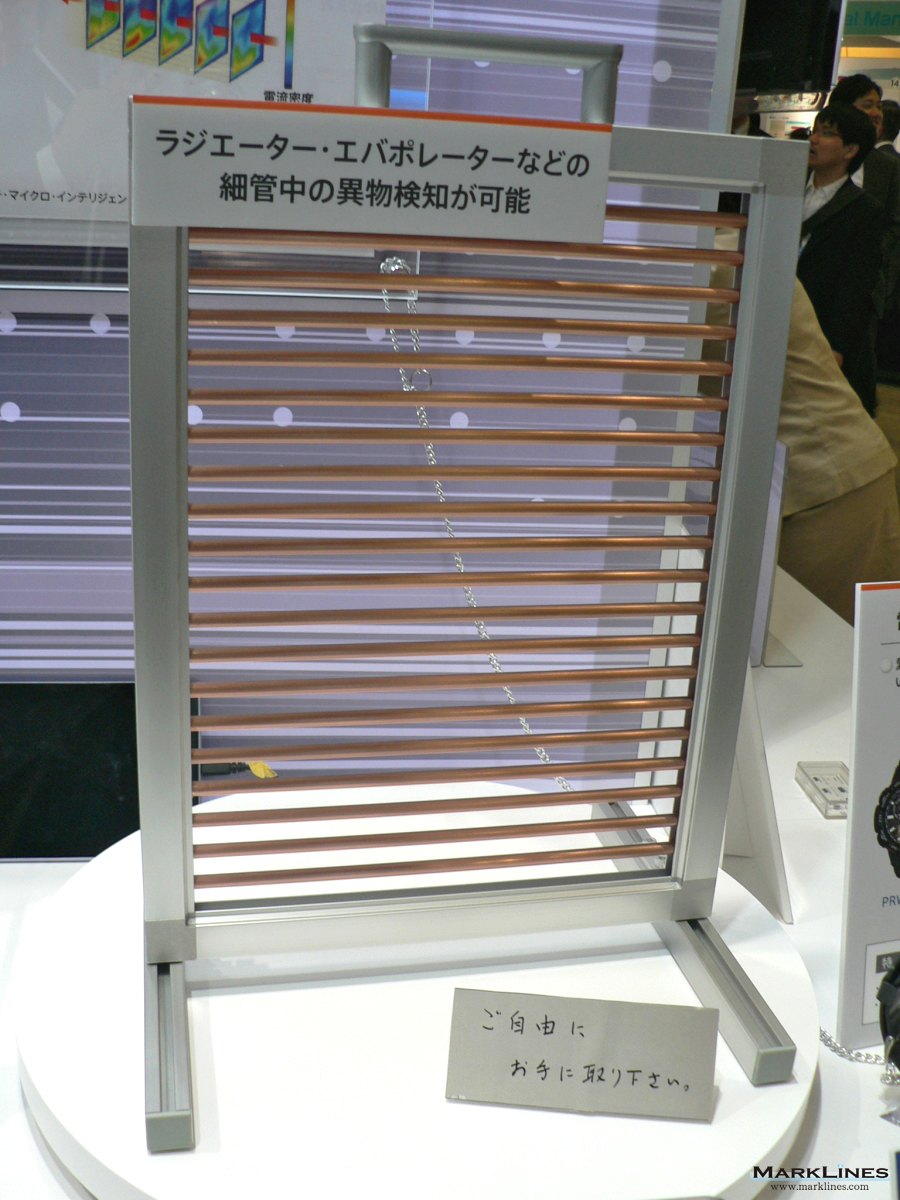
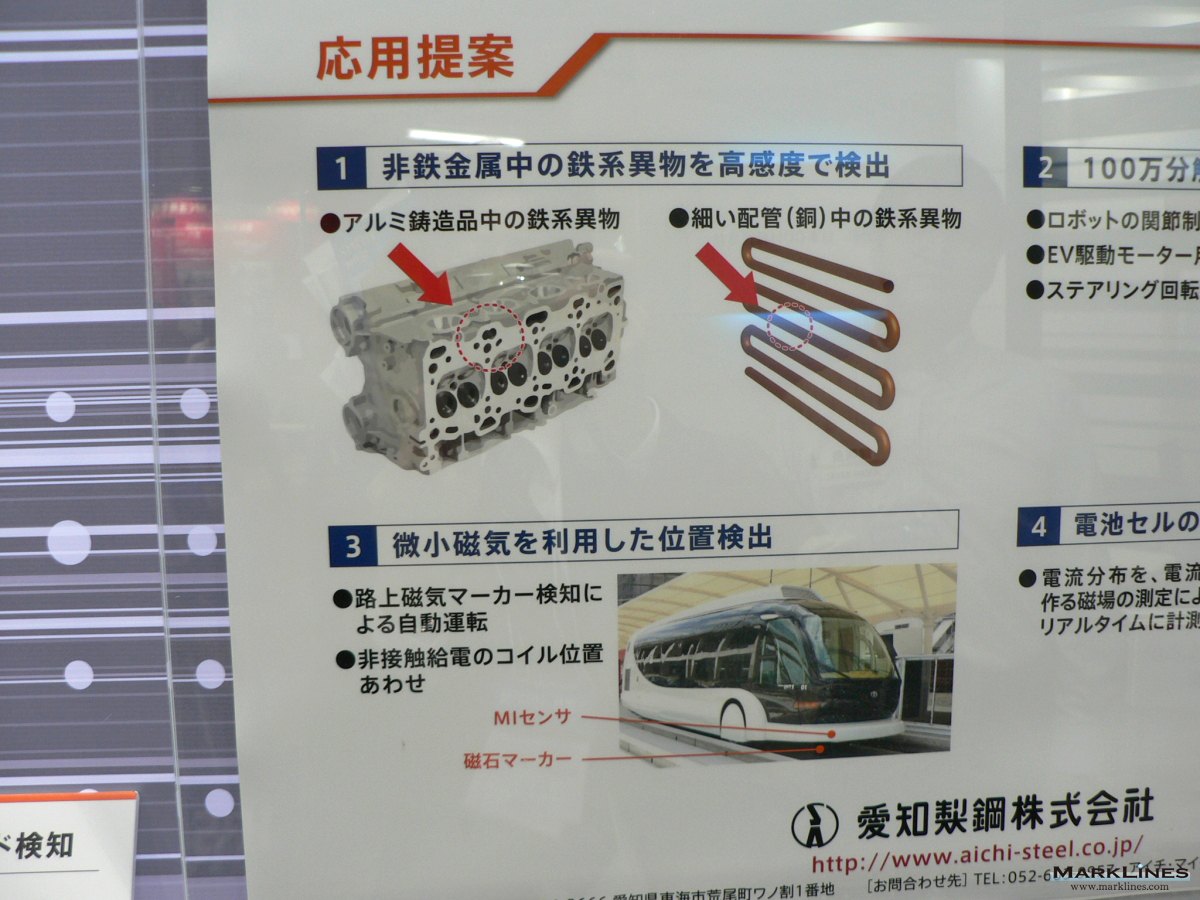
MI sensor (ultra-small and high sensitive magnetic sensor)
 3
3
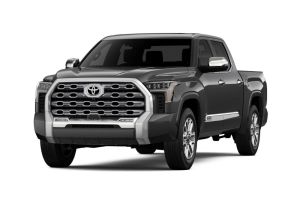
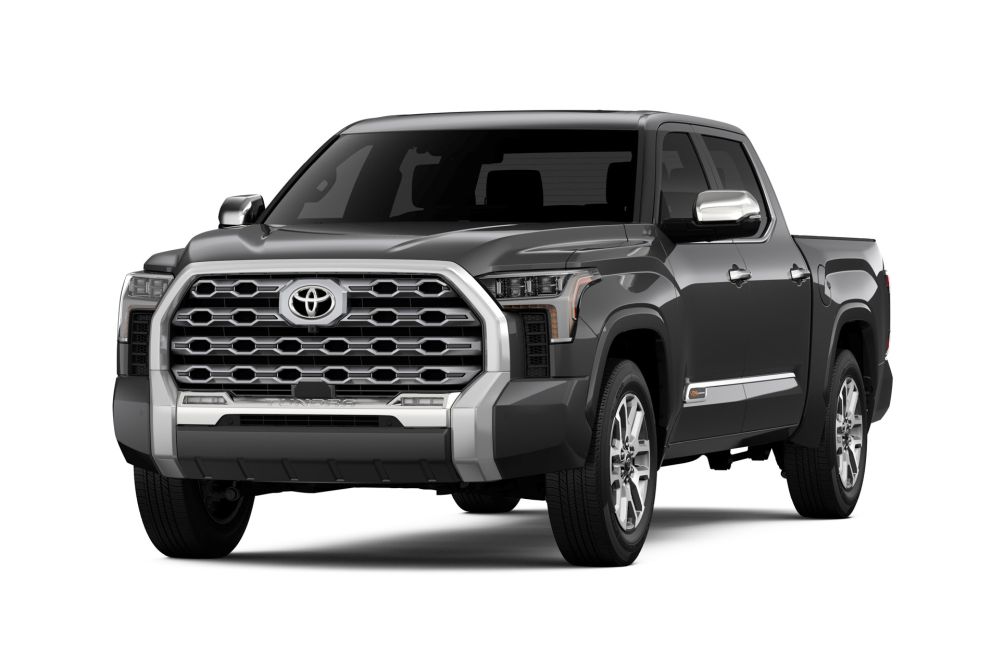
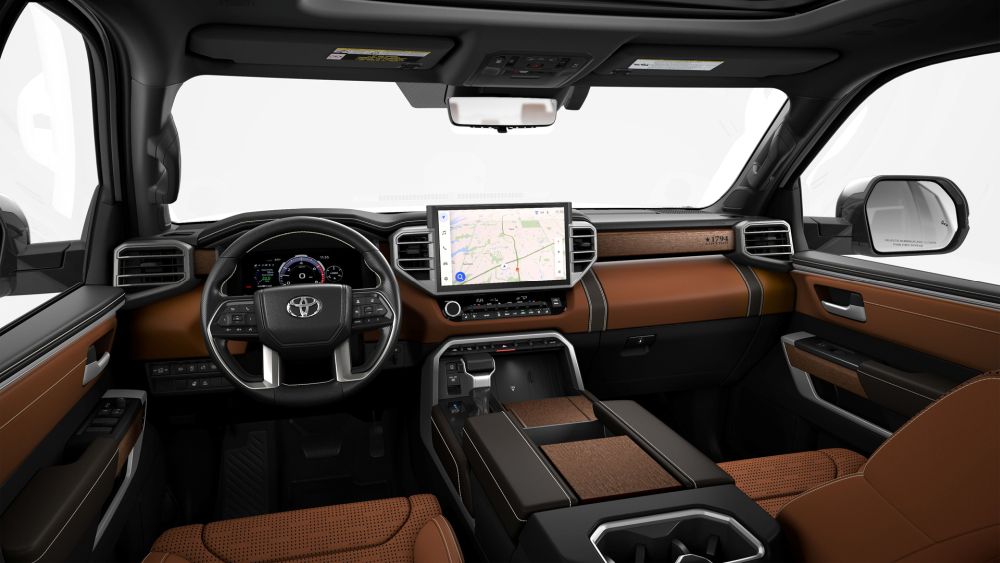
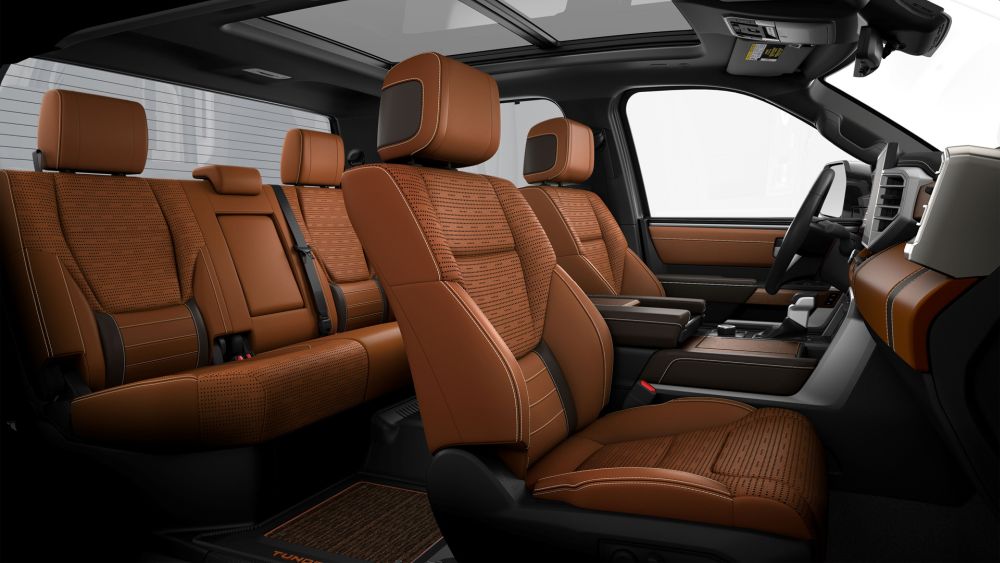
Toyota launches US-produced Tundra and Highlander in Japan
 1
1
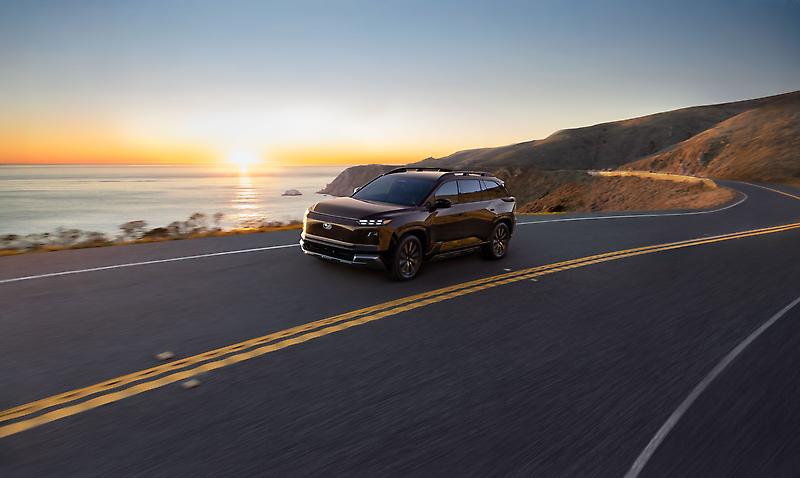
NYIAS 2026: Subaru unveils all-new, three-row 2027 Getaway electric SUV
 6
6
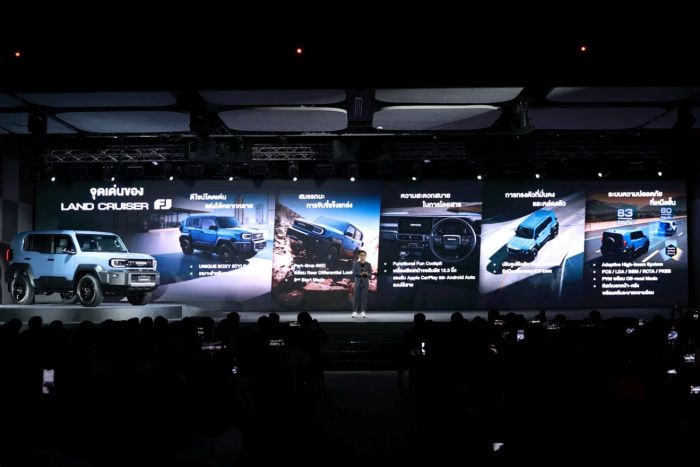
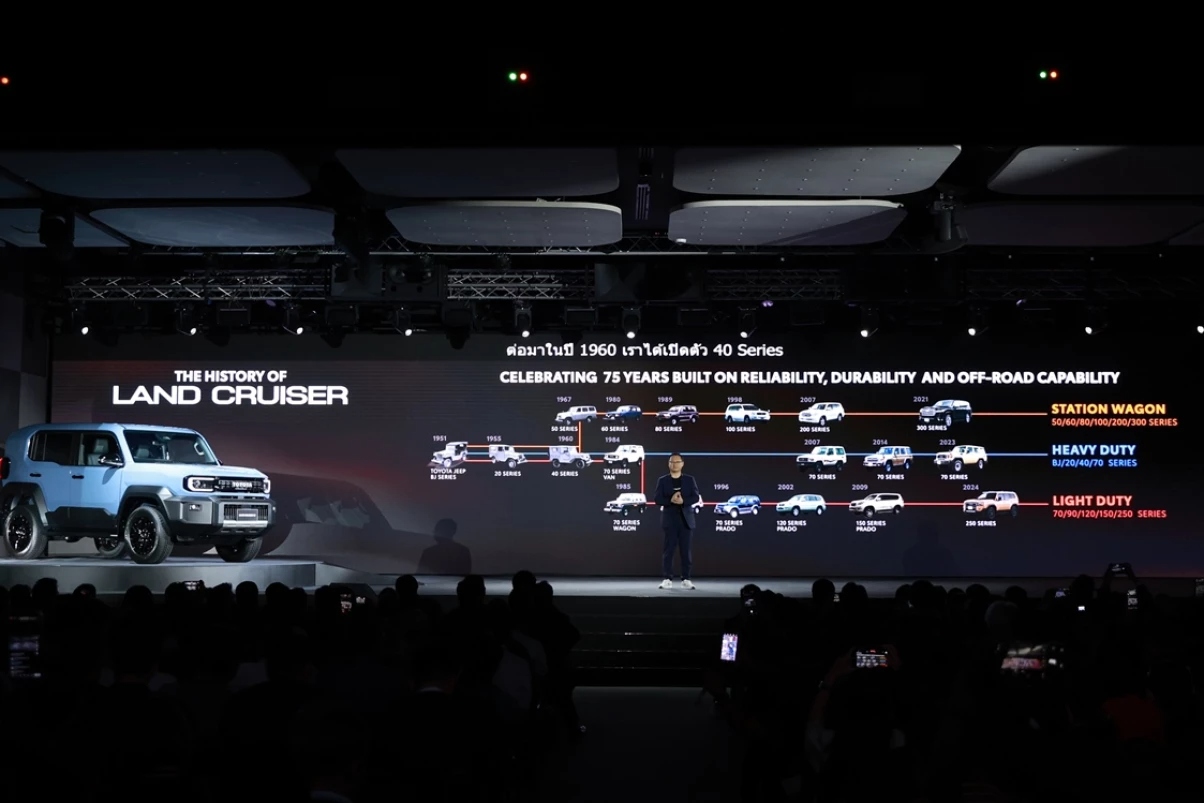
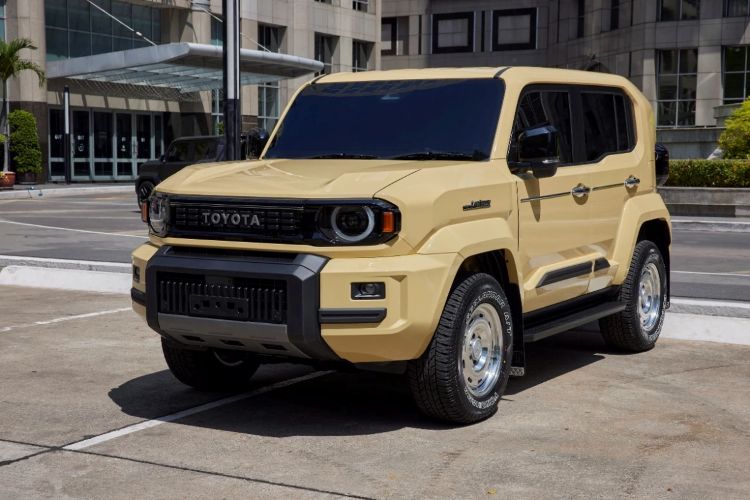
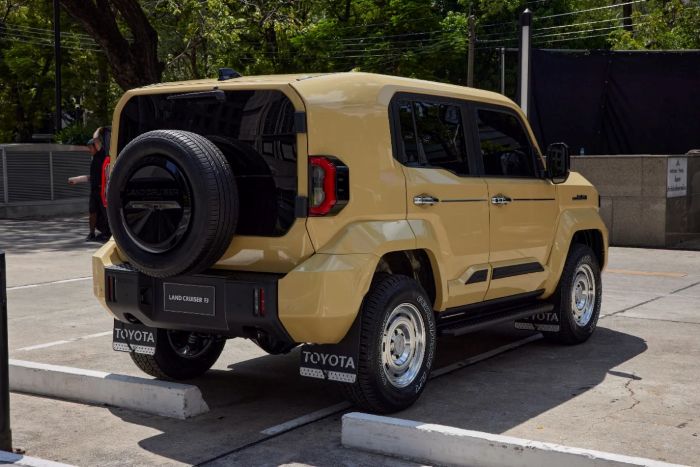
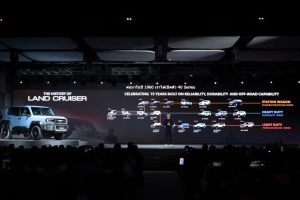
Toyota Land Cruiser FJ launched in Thailand; 84% local content, exports planned
 1
1
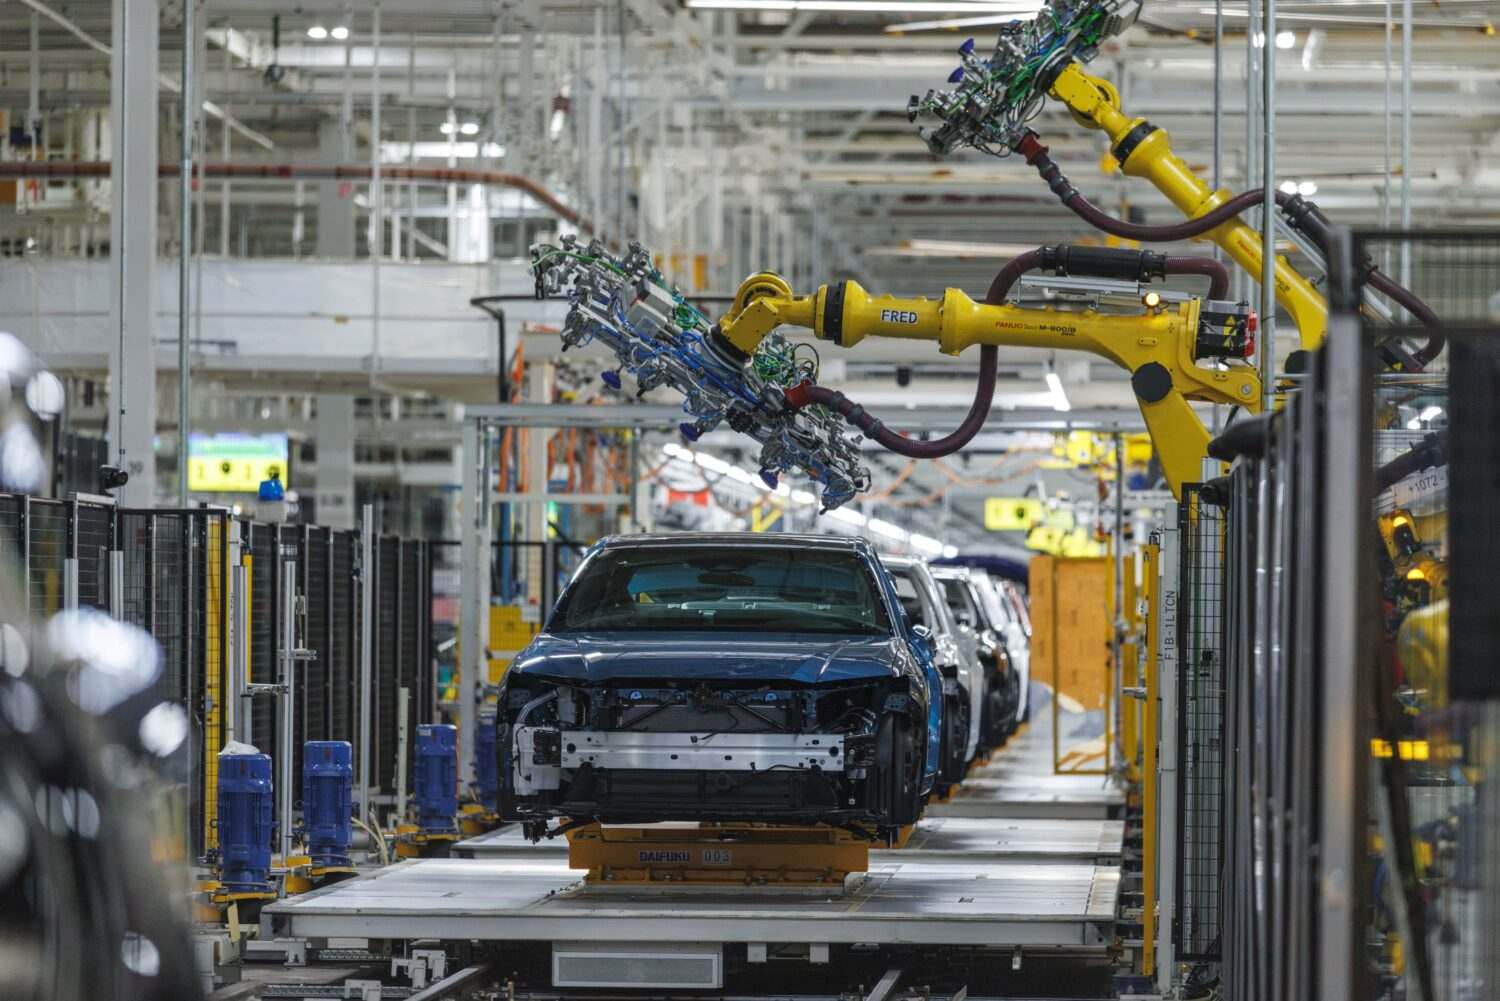
Toyota investing USD 1 billion in Kentucky, Indiana plants
 6
6
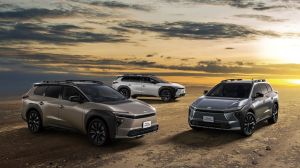
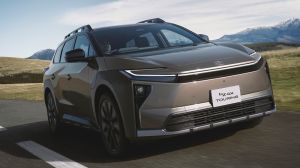
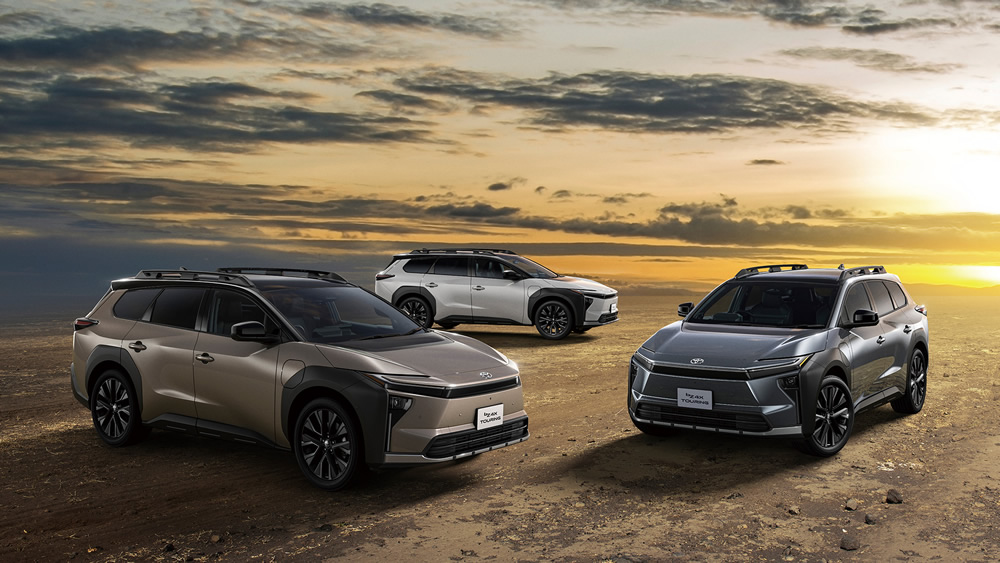
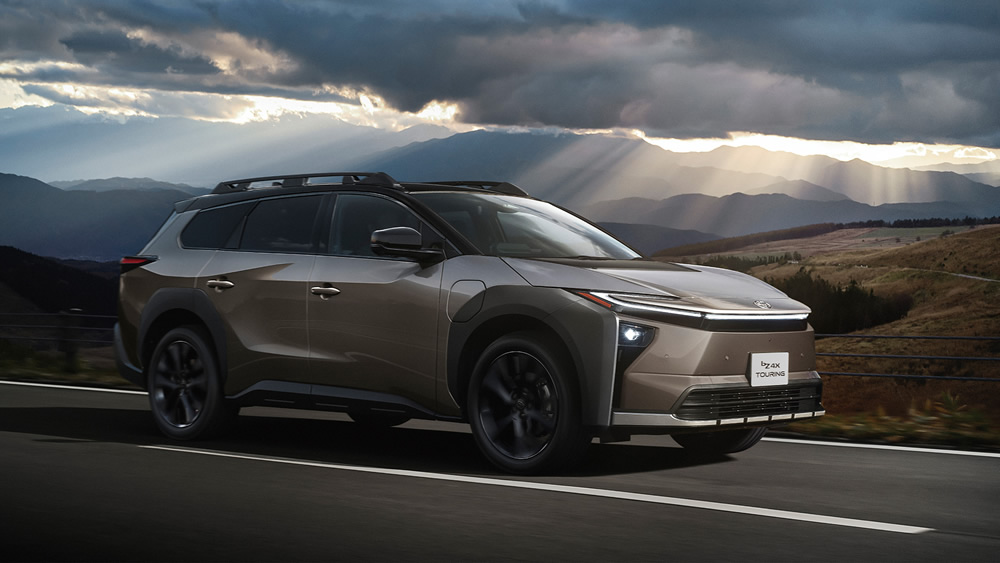
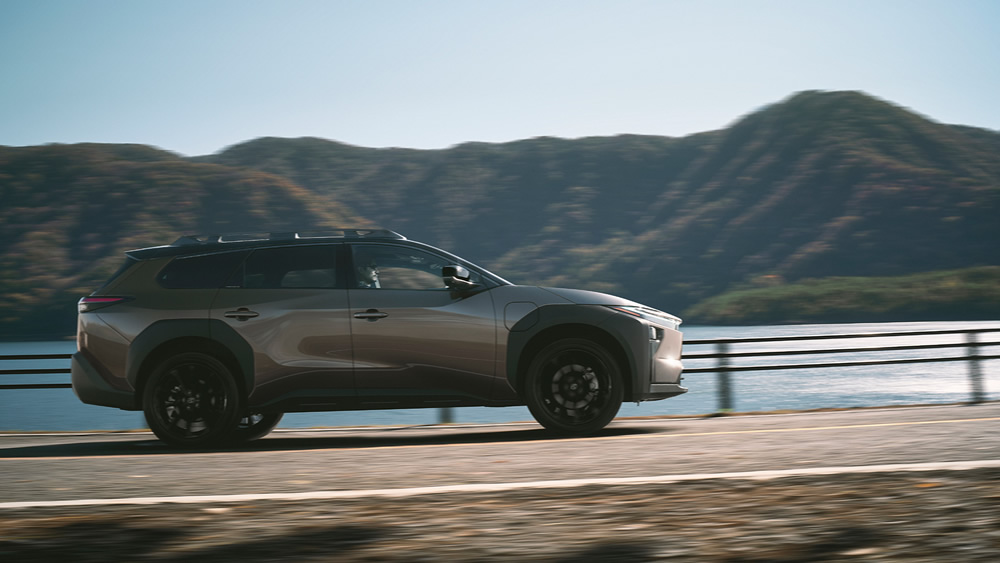
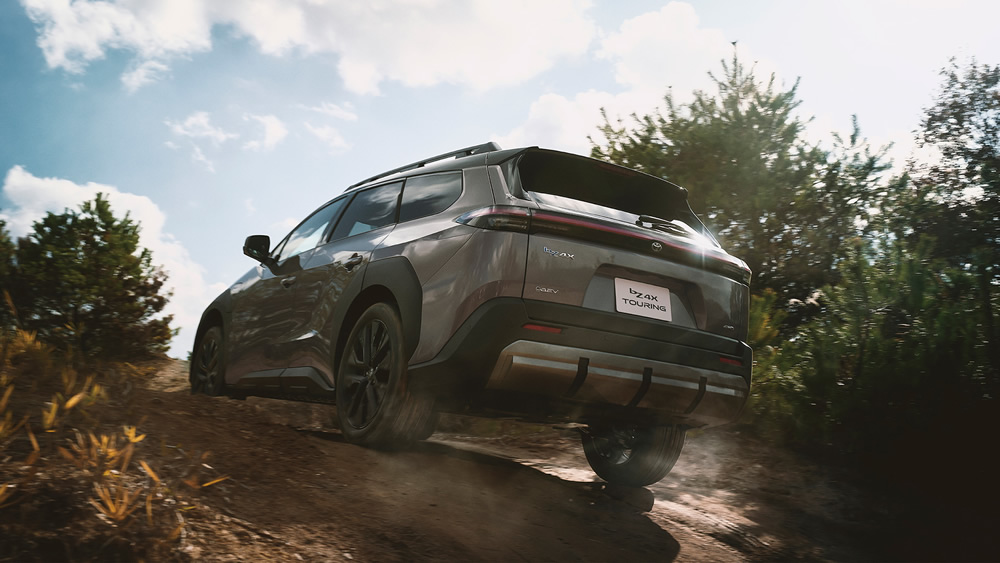
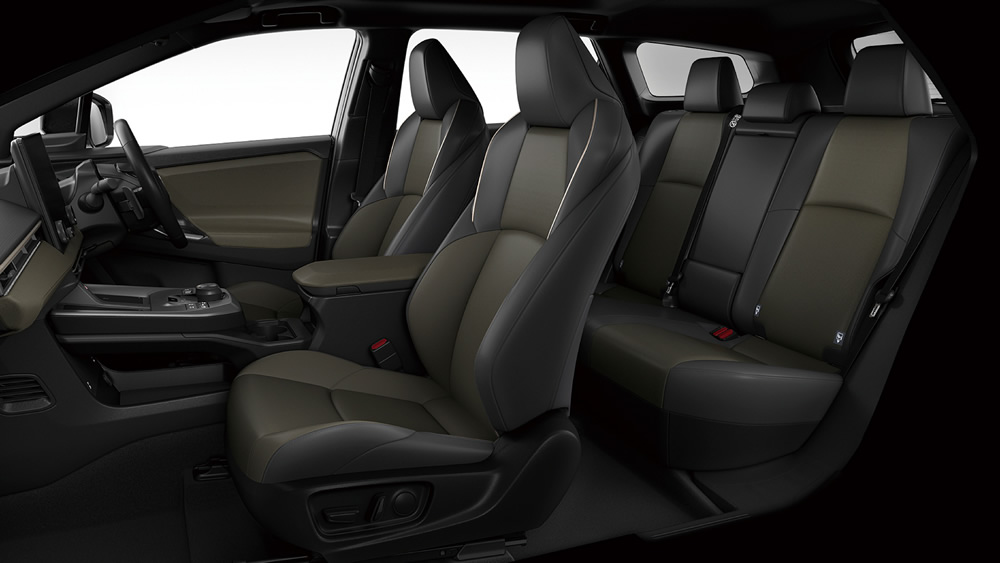
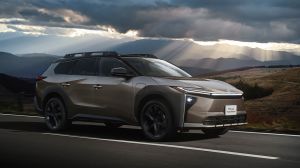
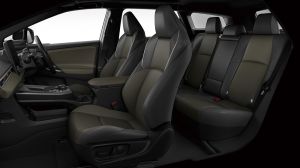
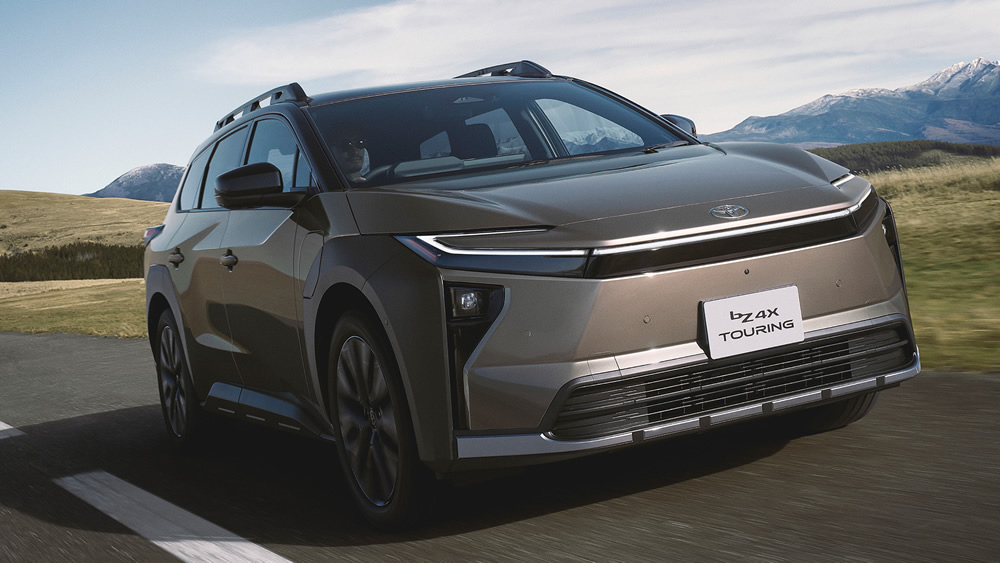
Toyota launches all-new bZ4X Touring BEV in Japan
 6
6
Toyota launches all-new bZ4X Touring BEV in Japan
 1
1
Toyota Canada to deploy humanoid robots at plant in Woodstock, Ontario
Sort by :
1 - 20 of 21 results
China - New car sales in 2026 by OEM, model, vehicle type
8 MG (2006-) MG ZS SUV 16,954 12,036 40.9% 39,102 27,186 43.8% 9 BYD Auto Song Pro 16,456 23,172 -29.0% 37,493 43,244 -13.3% 10 VW Lavida 16,135 18,631 -13.4% 39,013 40,177 -2.9% Source: MarkLines Data Center *The below data may differ from the sales volume by make (shipped from the local plant) to be released later on our data for monthly sales volume.This is due to the difference in calculation methods. Passenger Car retail sales by...
Automotive Sales Data Updated at: 2026/03/24
China - New car sales in 2025 by OEM, model, vehicle type
1% 8 BYD Auto Qin L 23,415 42,700 -45.2% 287,489 284,345 1.1% 9 Chery Tiggo 8 23,037 20,987 9.8% 274,612 200,310 37.1% 10 Geely Xing Yue L 8,889 27,923 -68.2% 269,307 267,782 0.6% Source: MarkLines Data Center *The below data may differ from the sales volume by make (shipped from the local plant) to be released later on our data for monthly sales volume.This is due to the difference in calculation methods. Passenger Car retail sales by ...
Automotive Sales Data Updated at: 2026/02/10
USA - New car sales in 2025 by OEM, model, vehicle type
r inventory were Lincoln (101 days), Jeep (86 days), Ram (82 days), Ford (79 days), and GMC (67 days). Among Japanese brands, Acura (68 days) and Nissan (66 days). Among European brands, VW (79 days). Among US brands with lower inventory were Dodge (37 days). Among Japanese brands, Lexus (32 days), Toyota (30 days), and Mitsubishi (26 days). Among European brands, Mercedes-Benz (36 days), Volvo (30 days), and BMW (29 days). Among Korean brands, K...
Automotive Sales Data Updated at: 2026/02/04
Korea - New car sales in 2025 by OEM
3% 245.2% 59,916 19.5% 29,750 11.3% 101.4% Volvo 1,515 5.3% 1,448 6.2% 4.6% 14,903 4.8% 15,051 5.7% -1.0% Lexus 997 3.5% 1,120 4.8% -11.0% 14,891 4.8% 13,969 5.3% 6.6% Audi 749 2.6% 918 3.9% -18.4% 11,001 3.6% 9,304 3.5% 18.2% Porsche 1,007 3.5% 768 3.3% 31.1% 10,746 3.5% 8,284 3.1% 29.7% Toyota 1,013 3.5% 1,100 4.7% -7.9% 9,764 3.2% 9,714 3.7% 0.5% MINI 810 2.8% 760 3.2% 6.6% 7,990 2.6% 7,648 2.9% 4.5% BYD 1,152 4.0% - -% -% 6,107 ...
Automotive Sales Data Updated at: 2026/02/02
Korea - New car sales in 2024 by OEM
.1% 73,754 28.0% 77,395 28.6% -4.7% Mercedes-Benz 6,839 29.1% 8,541 31.4% -19.9% 66,400 25.2% 76,697 28.3% -13.4% Tesla 1,252 5.3% - -% -% 29,750 11.3% - -% -% Volvo 1,448 6.2% 1,608 5.9% -10.0% 15,051 5.7% 17,018 6.3% -11.6% Lexus 1,120 4.8% 1,370 5.0% -18.2% 13,969 5.3% 13,561 5.0% 3.0% Toyota 1,100 4.7% 893 3.3% 23.2% 9,714 3.7% 8,495 3.1% 14.3% Audi 918 3.9% 1,218 4.5% -24.6% 9,304 3.5% 17,868 6.6% -47.9% Porsche 768 3.3% 913 3....
Automotive Sales Data Updated at: 2025/07/02
China - New car sales in 2024 by OEM, model, vehicle type
L 42,700 - -% 284,345 - -% 9 VW Lavida 26,163 42,203 -38.0% 284,060 351,931 -19.3% 10 BYD Auto Song Pro 31,790 23,311 36.4% 280,755 203,491 38.0% Source: MarkLines Data Center *The below data may differ from the sales volume by make (shipped from the local plant) to be released later on our data for monthly sales volume. This is due to the difference in calculation methods. Passenger Car retail sales b...
Automotive Sales Data Updated at: 2025/07/02
Korea - Flash report, Automotive sales volume, 2023
1.3% 17,018 6.3% 14,431 5.1% 17.9% Lexus 1,370 5.0% 1,058 3.6% 29.5% 13,561 5.0% 7,592 2.7% 78.6% Porsche 913 3.4% 985 3.3% -7.3% 11,355 4.2% 8,963 3.2% 26.7% Volkswagen 1,462 5.4% 2,678 9.0% -45.4% 10,247 3.8% 15,791 5.6% -35.1% MINI 804 3.0% 960 3.2% -16.3% 9,535 3.5% 11,213 4.0% -15.0% Toyota 893 3.3% 440 1.5% 103.0% 8,495 3.1% 6,259 2.2% 35.7% Chevrolet 117 0.4% 475 1.6% -75.4% 5,589 2.1% 9,004 3.2% -37.9% Ford/Lincoln 824 3.0% ...
Automotive Sales Data Updated at: 2025/06/04
China - Flash report, Automotive sales volume, 2023
0,897 255,774 17.6% 8 BYD Auto Seagull 50,525 - -% 280,217 - -% 9 VW Sagitar 20,590 35,329 -41.7% 280,029 236,142 18.6% 10 Haval Haval H6 25,138 19,443 29.3% 273,274 288,083 -5.1% Source: MarkLines Data Center *The below data may differ from the sales volume by make (shipped from the local plant) to be released later on our data for monthly sales volume.This is due to the difference in calculation methods. Passenger Car retail sales b...
Automotive Sales Data Updated at: 2025/06/04
Thailand - Flash report, Automotive sales volume, 2023
equirements of financial institutions. Household debt level has already exceeded 90% of the country's GDP. There was also an economic slowdown and a delay in the 2024 fiscal budget. 2023 full year vehicle sales in Thailand decreased 8.7% year over year to 775,780 units.According to data compiled by Toyota Motor Thailand (TMT), by maker sales in 2023, Toyota was down 7.9% to 265,949 units. Isuzu was down 28.5% to 151,935 units and Honda was up 13....
Automotive Sales Data Updated at: 2025/06/04
China - Flash report, Automotive sales volume, 2022
g MINIEV 82,340 55,742 47.7% 572,757 426,482 34.3% 2 Tesla Model Y 35,750 40,558 -11.9% 455,091 200,131 127.4% 3 BYD Auto Song DM 61,688 15,120 308.0% 411,026 79,508 417.0% 4 VW Lavida 33,887 35,905 -5.6% 376,627 391,362 -3.8% 5 Haval Haval H6 19,443 42,787 -54.6% 288,083 370,438 -22.2% 6 Toyota Corolla/New Corolla 18,242 31,200 -41.5% 257,751 323,242 -20.3% 7 Tesla Model 3 20,046 30,289 -33.8% 255,774 272,947 -6.3% 8 Toyota Camry 9...
Automotive Sales Data Updated at: 2025/06/04
China - Flash report, Automotive sales volume, 2021
ling models - Maker/Brand Model Dec. 2021 Dec. 2020 Y-o-Y Jan.- Dec. 2021 Jan.- Dec. 2020 Y-o-Y 1 Wuling Wuling Hongguang MINIEV 55,742 32,097 73.7% 426,482 126,603 236.9% 2 VW Lavida 35,905 36,369 -1.3% 391,362 417,324 -6.2% 3 Haval Haval H6 42,787 55,632 -23.1% 370,438 376,864 -1.7% 4 Toyota Corolla/New Corolla 31,200 32,826 -5.0% 323,242 350,310 -7.7% 5 Changan/Chana CS75 15,163 24,011 -36.8% 281,862 266,824 5.6% 6 Tesla Model ...
Automotive Sales Data Updated at: 2025/06/04
China - Flash report, Sales volume, 2020
100.0 -2.0 Source:CAAM, Each maker's press releasesChina - Top 10 best selling models - Maker/Brand Model Dec. 2020 Dec. 2019 Y-o-Y Jan.- Dec. 2020 Jan.- Dec. 2019 Y-o-Y 1 VW Lavida 36,369 62,644 -41.9% 417,324 517,192 -19.3% 2 Haval Haval H6 55,632 41,706 33.4% 376,864 386,405 -2.5% 3 Toyota Corolla/New Corolla 32,826 32,505 1.0% 350,310 357,798 -2.1% 4 VW Bora 30,799 31,295 -1.6% 332,386 334,668 -0.7% 5 VW Sagitar 27,295 31,789...
Automotive Sales Data Updated at: 2025/06/04
China - Flash report, Sales volume, 2019
t selling models - Maker/Brand Model Dec. 2019 Dec. 2018 Y-o-Y Jan.- Dec. 2019 Jan.- Dec. 2018 Y-o-Y 1 VW Lavida 62,644 40,320 55.4% 517,192 468,792 10.3% 2 Haval Haval H6 41,706 50,303 -17.1% 386,405 452,552 -14.6% 3 Wuling Wuling Hongguang 53,336 59,673 -10.6% 374,878 476,537 -21.3% 4 Toyota Corolla/New Corolla 32,505 27,755 17.1% 357,798 376,077 -4.9% 5 Nissan Bluebird Sylphy/Sylphy 26,950 56,339 -52.2% 346,551 481,216 -28.0% 6...
Automotive Sales Data Updated at: 2020/05/12
China - Flash report, Sales volume, 2018
Dec. 2018 Jan.- Dec. 2017 Y-o-Y 1 Nissan Bluebird Sylphy/Sylphy 56,339 44,141 27.6% 481,216 405,854 18.6% 2 Wuling Wuling Hongguang 59,673 63,590 -6.2% 476,537 533,950 -10.8% 3 VW Lavida 40,320 44,703 -9.8% 468,792 457,114 2.6% 4 Haval Haval H6 50,303 55,126 -8.7% 452,552 506,362 -10.6% 5 Toyota Corolla/New Corolla 27,755 19,406 43.0% 376,077 336,018 11.9% 6 Baojun Baojun 510 28,523 54,050 -47.2% 361,403 363,949 -0.7% 7 VW Jetta 36,...
Automotive Sales Data Updated at: 2019/01/31
Mexico - Flash report, Sales volume, 2017
717 vehicles. Passenger cars were down 22.1% to 99,411 units, while SUVs and pickups were down 8.7% to 59,306 units.2017 annual sales were down 4.6% to 1,530,317 units.Among by maker sales in 2017, Nissan is the market leader with 23.8% market share. GM follows with 16.9%, then VW Group with 15.3%. Toyota was 4th with 6.9% market share, and FCA was 5th with 6.6%. Kia achieved a significant market share increase from 3.6% in 2016 to 5.7% in 2017.B...
Automotive Sales Data Updated at: 2018/07/24
China - Flash report, Sales volume, 2017
avida 44,703 37,550 19.0% 457,114 478,857 -4.5% 4 Buick Excelle GT 40,939 31,726 29.0% 416,990 370,372 12.6% 5 Nissan Bluebird Sylphy/Sylphy 44,141 43,831 0.7% 405,854 367,979 10.3% 6 Baojun Baojun 510 54,050 0 -% 363,949 0 -% 7 GAC Trumpchi GS4 22,628 26,480 -14.5% 337,330 333,280 1.2% 8 Toyota Corolla/New Corolla 19,406 29,698 -34.7% 336,018 324,052 3.7% 9 VW Sagitar 29,946 25,147 19.1% 332,733 341,333 -2.5% 10 VW Tiguan 29,584 26...
Automotive Sales Data Updated at: 2018/07/24
China - Flash report, Sales volume, 2016
.00 -29.17 66.59 2.37 -38.32 PC Total 264.40 86.33 13.60 2442.07 86.85 15.50 CV Total 41.87 13.67 25.07 369.81 13.15 8.01 Grand Total 306.28 - 15.04 2811.88 - 14.46 Source:CAAM, Each maker's press releases *The below data may differ from the sales volume by make (shipped from the local plant) to be released later on our data for monthly sales volume.This is due to the difference in calculation methods. Japanese OEMs achieve record-...
Automotive Sales Data Updated at: 2017/01/18
Mexico - Flash report, Sales volume, 2016
3 units. December sales marked the all-time high monthly record.2016 annual sales were up 18.6% to 1,603,672 units. 2016 annual sales also marked the historical record.Among by maker sales in 2016, Nissan is the market leader with 25.0% market share. GM follows with 19.2%, then VW Group with 15.4%. Toyota was 4th with 6.5% market share, and FCA was 5th with 6.5%. Toyota jumped from 6th in 2015 to 4th in 2016. Kia achieved a significant market sha...
Automotive Sales Data Updated at: 2017/01/18
China - Flash report, Sales volume, 2015
Mini Van 8.65 3.3 1.3 107.96 4.4 -16.9 PC Total 232.10 87.4 19.4 2,107.94 86.0 5.8 CV Total 33.48 12.6 -3.6 342.39 14.0 -10.0 Grand Total 265.58 - 15.9 2,450.33 - 3.3 Source:CAAM, Each maker's press releases*The below data may differ from the sales volume by make (shipped from the local plant) to be released later on our data for monthly sales volume.This is due to the difference in calculation methods. New vehicle sales by Japanes...
Automotive Sales Data Updated at: 2016/07/06
China - Flash report, Sales volume, 2013
er's press releases New vehicle sales by Makers Maker/Brand Dec. 2013 Y-o-Y Jan.-Dec.2013 Y-o-Y Note Nissan 134,200 70.4% 1,266,200 17.2% Sales to dealerships, Including import vehicle salesDFL PV and LCV are included.From April 2013, MPVs produced by Dongfeng Liuzhou Motor are not included. Toyota 108,400 19.4% 917,500 9.2% Retail Sales, Including import vehicle sales Honda 101,465 60.4% 756,882 26.4% Total shipments out of plant comb...
Automotive Sales Data Updated at: 2016/05/02


 Japan
Japan USA
USA Mexico
 Germany
 China (Shanghai)
 Thailand
 India
India