


Search Results by Category
All information related to {{ key_word }}.
AI Navigator will guide you. Click here for information about {{ key_word }}.
Tata AutoComp Systems Ltd.
-An affiliated company of Tata Group.
Images
 2
2
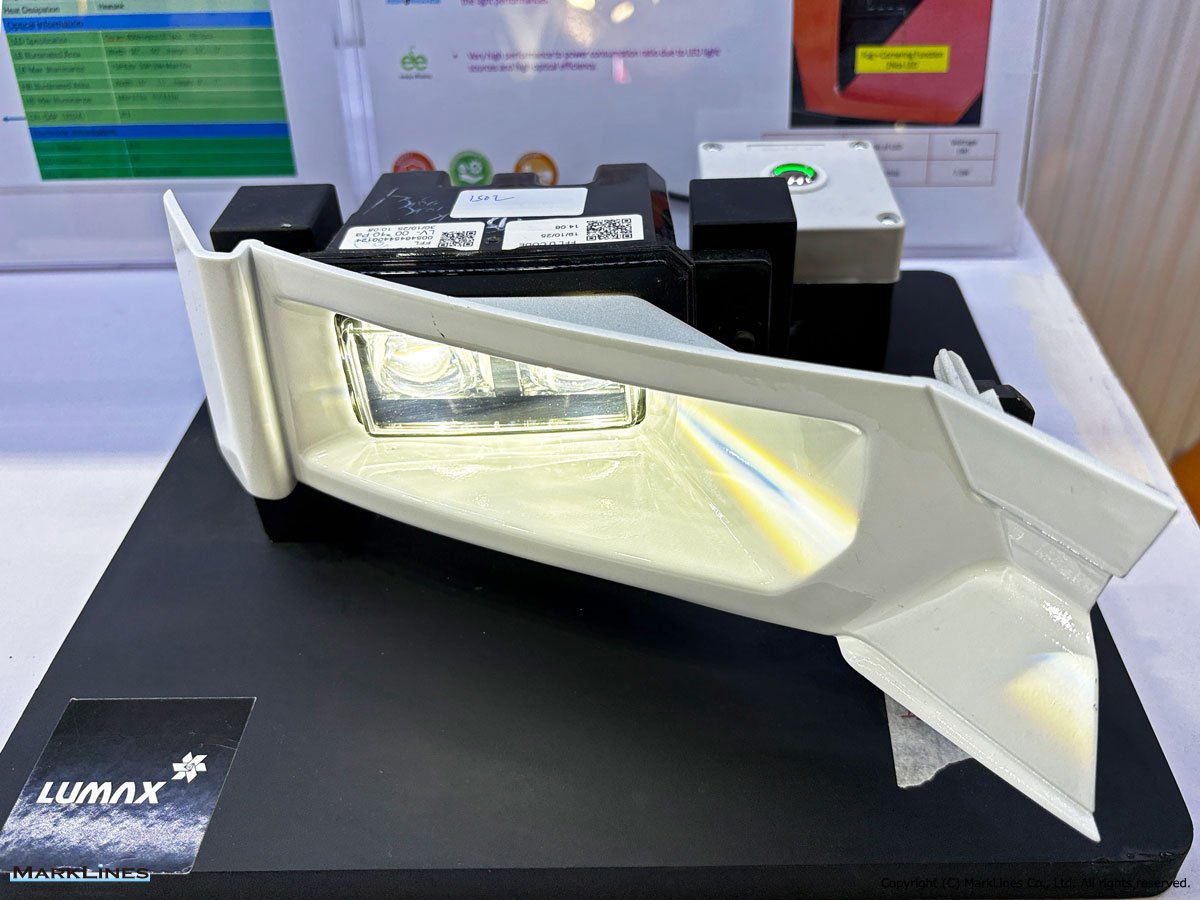
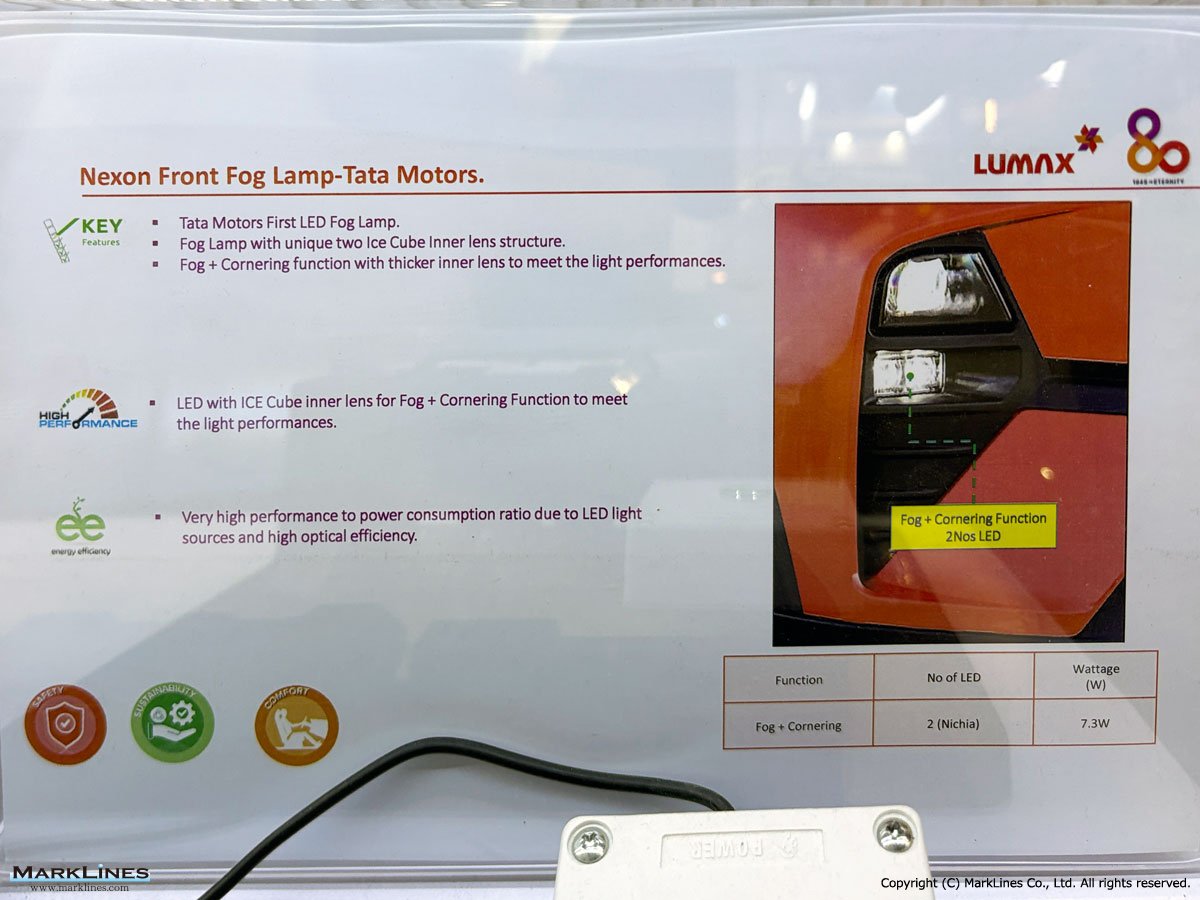
Nexon front fog lamp
 1
1
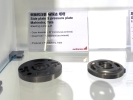
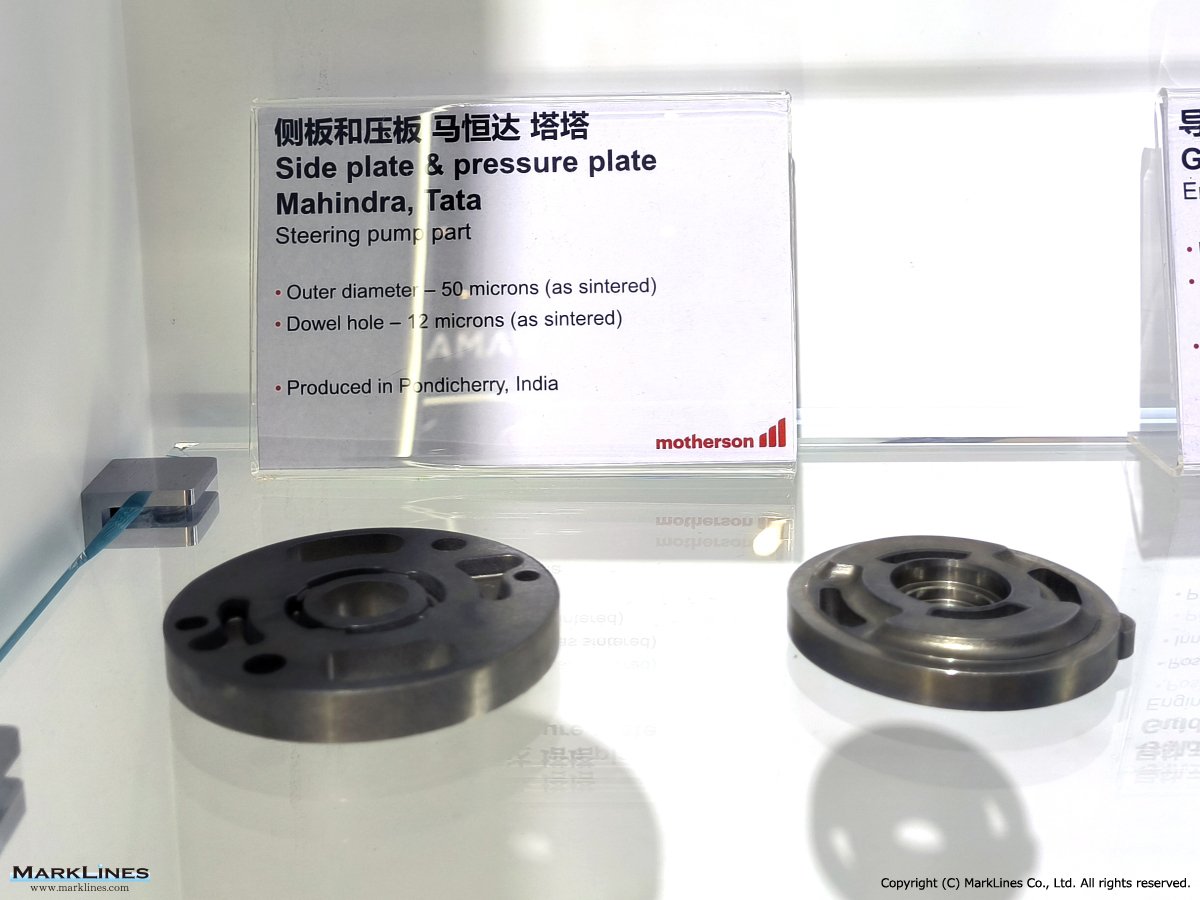
Side plate and pressure plate (Mahindra, Tata)
 2
2
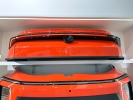
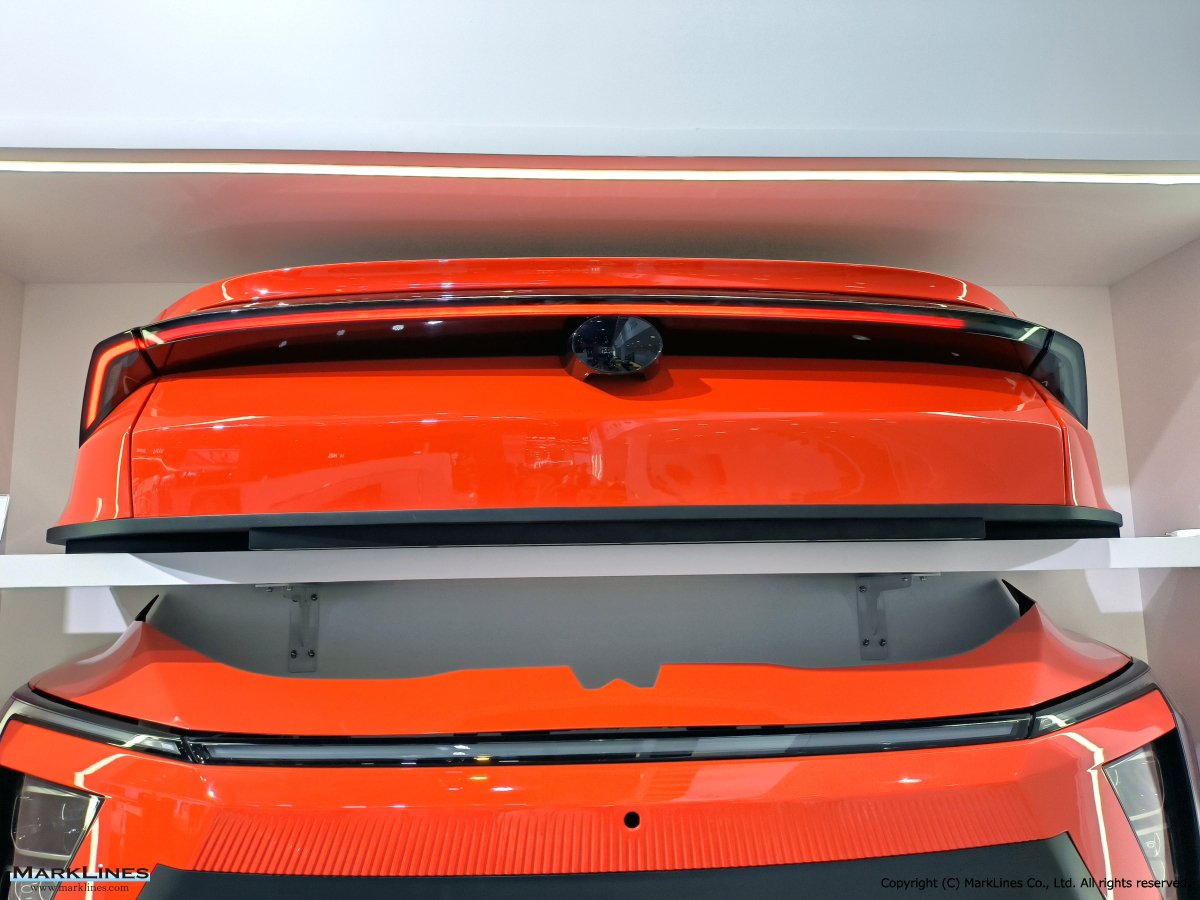
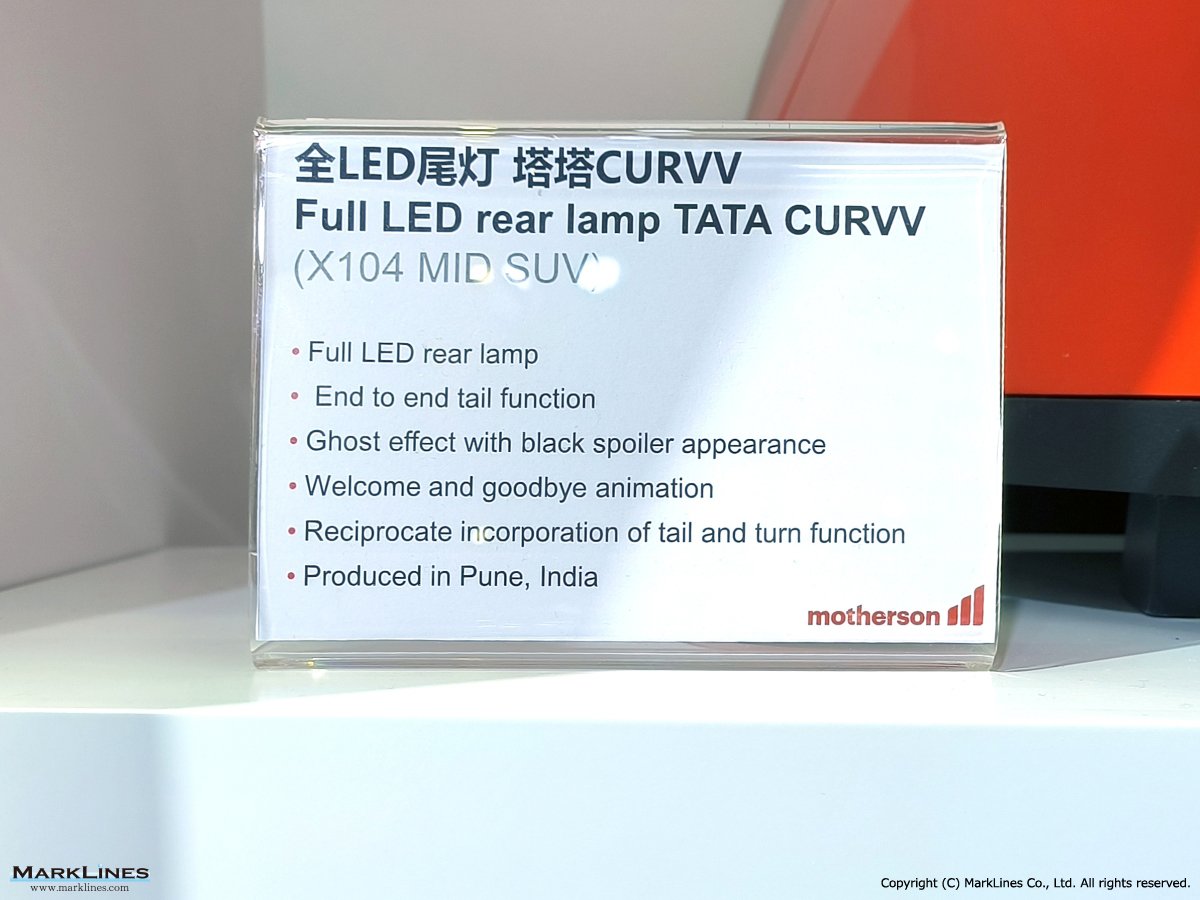
Full LED rear lamp (Tata CURVV)
 1
1
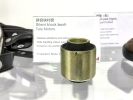
Silent block bush (Tata)
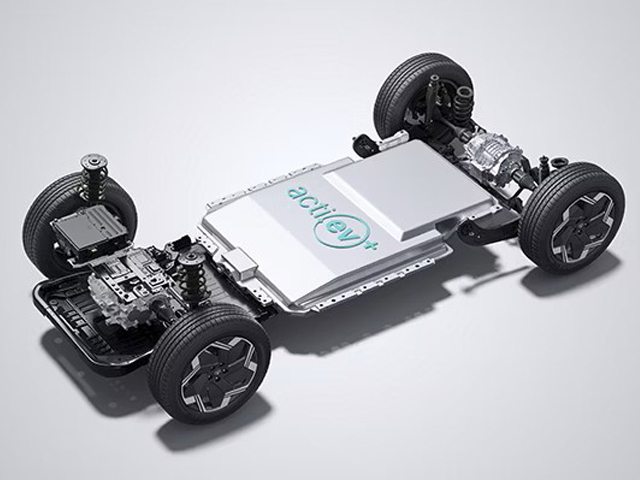
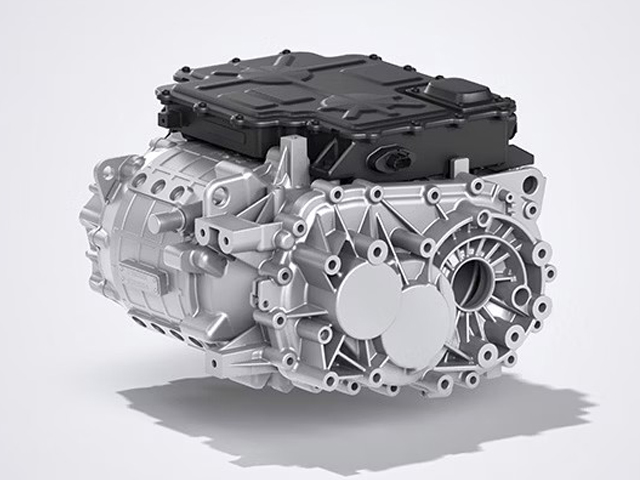
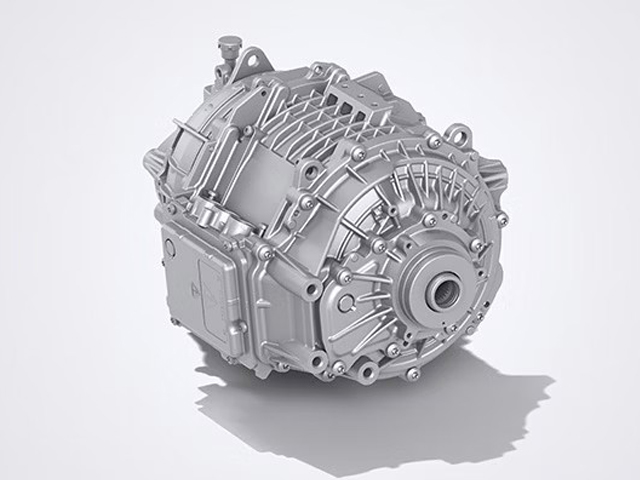
 7
7
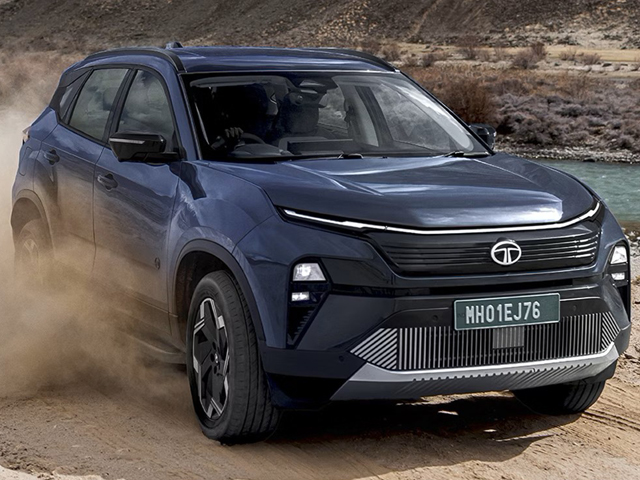
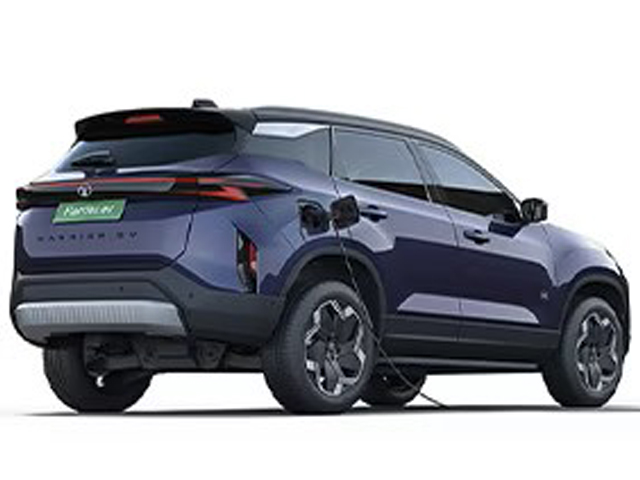
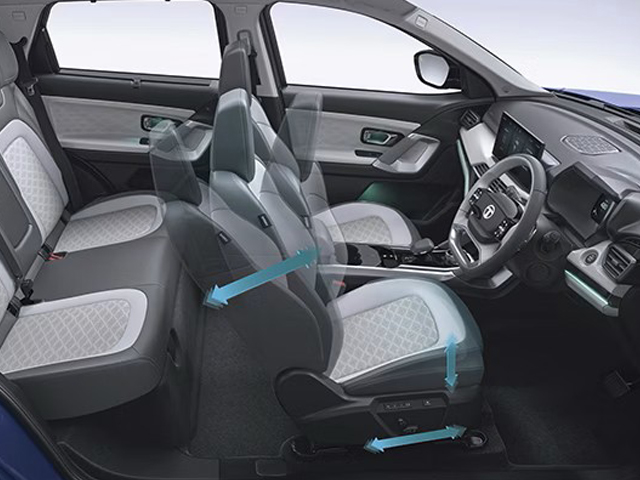
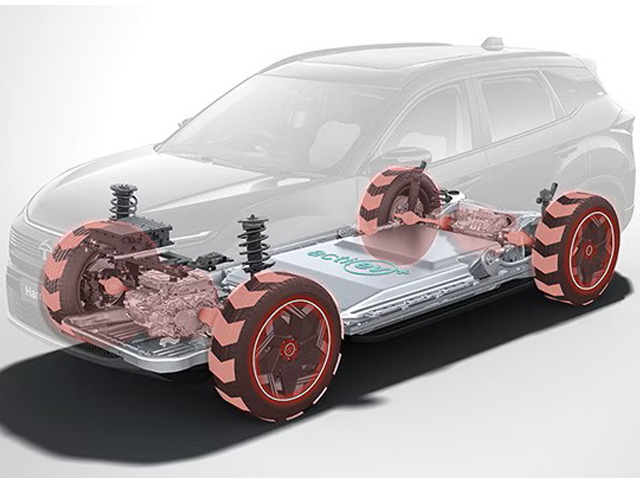
Harrier.ev
 1
1
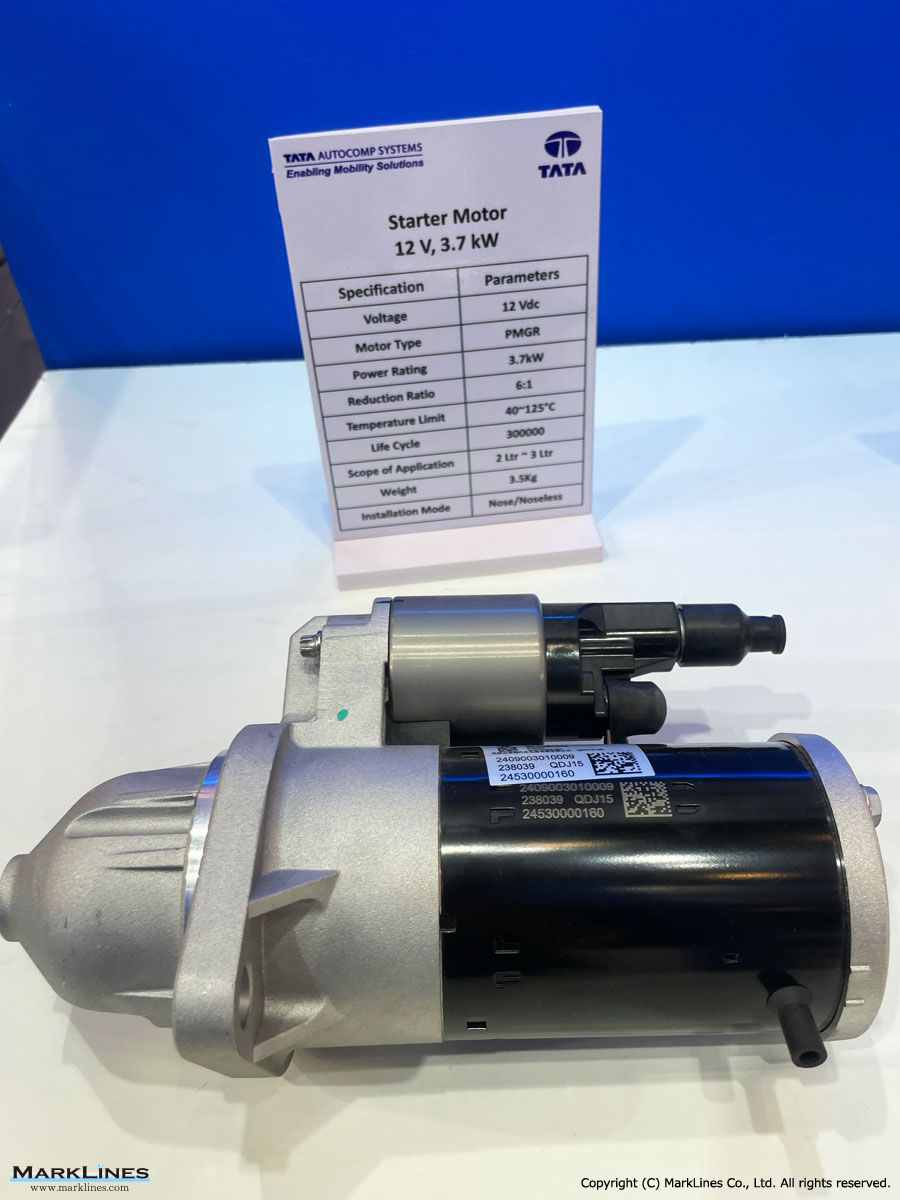
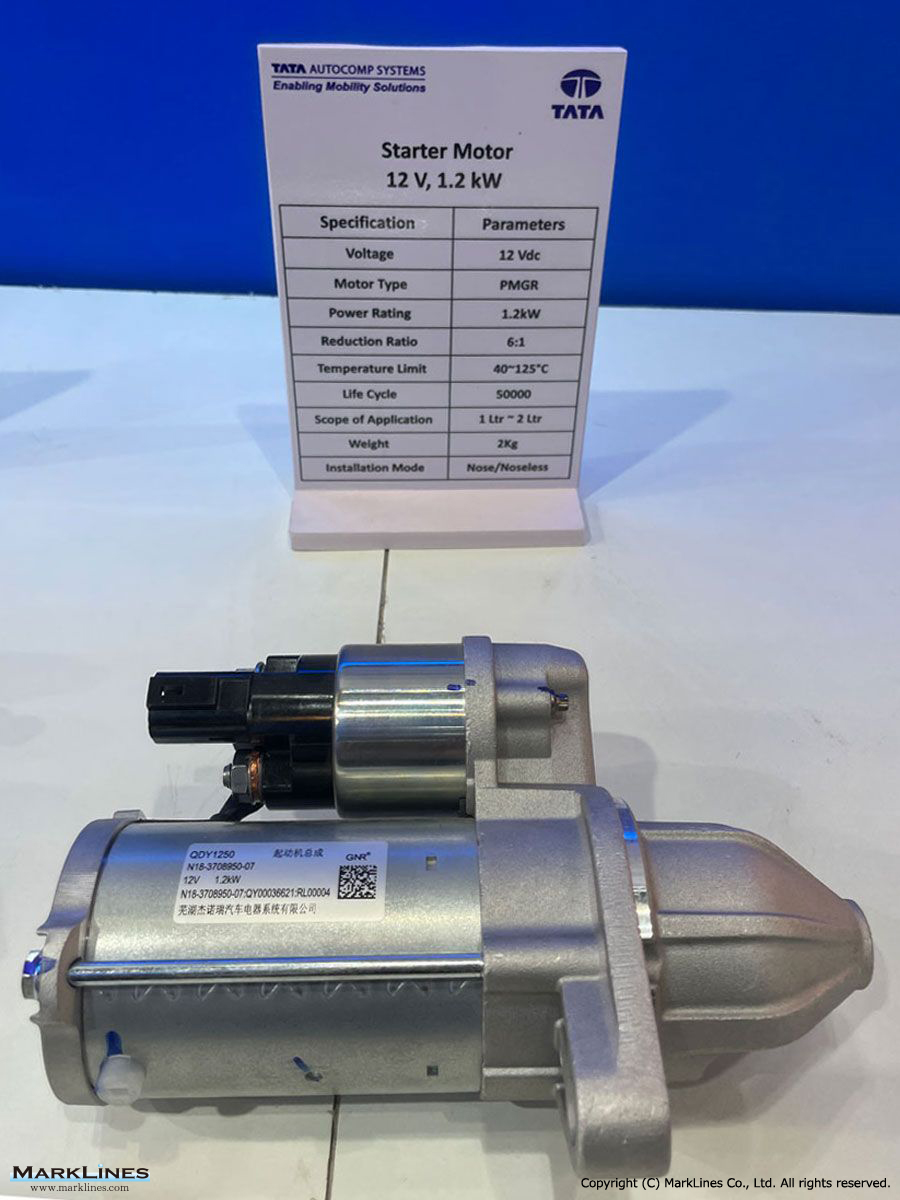
Starter motor
 1
1
Starter motor
 1
1
HVAC Unit
 1
1
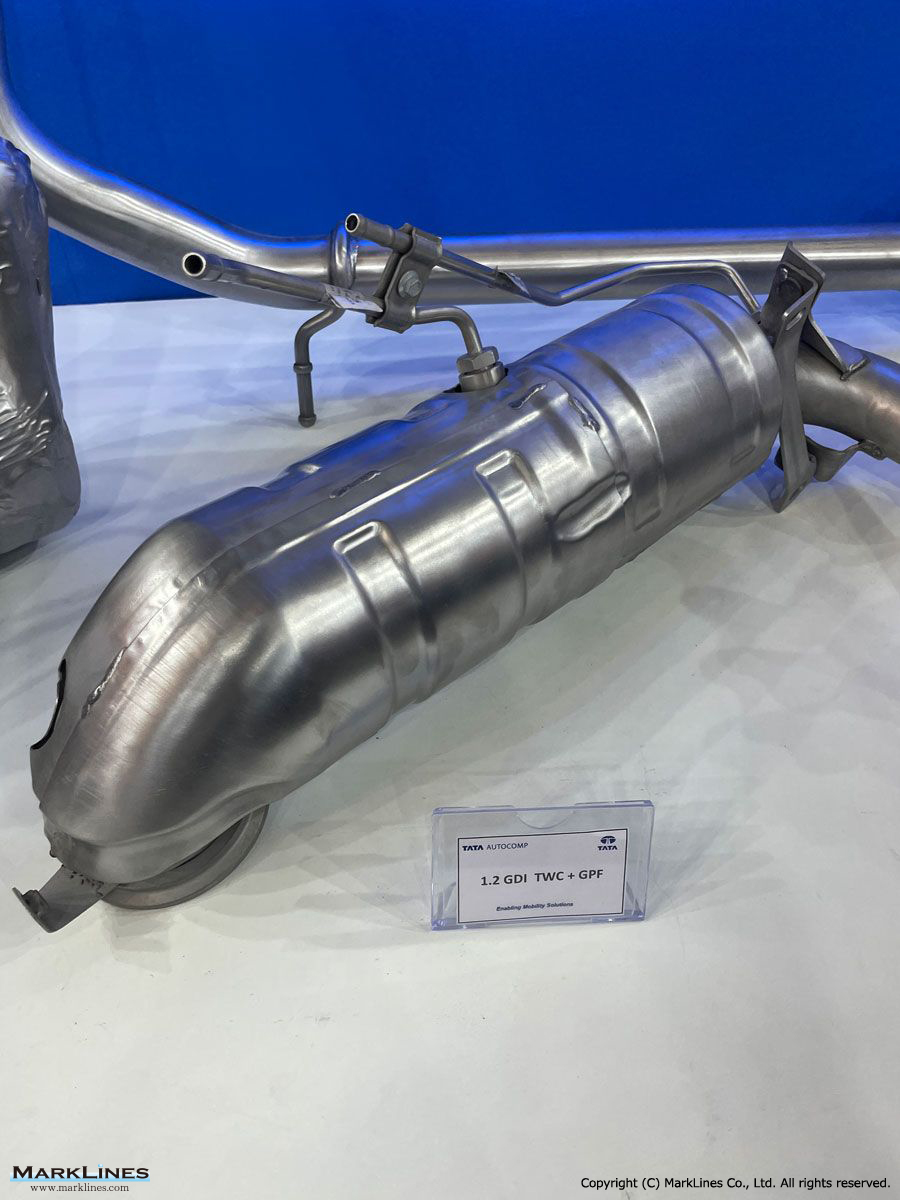
Three-way catalytic converter with Gas Particulate Filter
 1
1
Dual zone HVAC Unit
Sort by :
1 - 20 of 62 results
India - New car sales in 2026 by OEM, vehicle type
reases by 24.6% in April 2026Indian passenger vehicle wholesale in April 2026 were up 24.6% y/y to 378,312 units.Based on the release of carmakers, the available wholesale results of PVs are as follows:Maruti Suzuki sales of 191,122 units increased 34.5% in April compared to the same month in 2025. Tata sales of 91,965 units increased 29.6% from last year. Mahindra sales of 79,758 units increased 7.6% from last year. Hyundai sales of 51,902 units...
Automotive Sales Data Updated at: 2026/05/18
France - New car sales in 2026 by OEM, vehicle type
.7% -0.1 pt 0.6% 0.6% 0.0 pt - POLESTAR Total 148 1 14700.0% 297 1 29600.0% Share 0.1% 0.0% 0.1 pt 0.1% 0.0% 0.1 pt - LYNK & CO Total 19 16 18.8% 58 44 31.8% Share 0.0% 0.0% 0.0 pt 0.0% 0.0% 0.0 pt - LOTUS Total 5 10 -50.0% 12 34 -64.7% Share 0.0% 0.0% 0.0 pt 0.0% 0.0% 0.0 pt GROUP TATA Total 113 18 527.8% 404 53 662.3% Share 0.1% 0.0% 0.1 pt 0.1% 0.0% 0.1 pt - LAND ROVER Total 113 17 564.7% 404 39 935.9% Share 0.1% 0.0% 0...
Automotive Sales Data Updated at: 2026/05/08
South Africa - New car sales in 2026 by OEM, vehicle type
0.5% Hyundai 2,839 6.3% Ford 2,668 5.9% Great Wall Motors 2,485 5.5% Chery 2,462 5.4% JETOUR 1,804 4.0% Omoda / Jaecoo 1,383 3.0% BMW 1,366 3.0% Kia 1,242 2.7% Renault 1,216 2.7% Isuzu 1,106 2.4% Mahindra 1,098 2.4% Nissan 875 1.9% BYD Auto 705 1.6% Stellantis 687 1.5% Tata 535 1.2% MG 526 1.2% Mercedes-Benz * 432 1.0% Foton 417 0.9% JAC 312 0.7% BAIC Motor 216 0.5% Mazda 191 0.4% Mitsubishi 185 0.4% ...
Automotive Sales Data Updated at: 2026/05/07
Representative models for each segment
Chery Duomi Suzuki HUSTLER, Daihatsu Taft, Mazda Flair Crossover Renault Kwid, VinFast VF5, Suzuki S-Presso SUV-B Chevrolet Trax, Nissan Kicks, Volvo EX30 VW T-Roc, Peugeot 2008, Toyota Yaris Cross BYD Yuan UP, Wuling Bingo/Binguo Plus, iCAR V23 Toyota Raize, Honda Vezel, Lexus LBX Suzuki Fronx, Tata Nexon, VW T-Cross SUV-C Chevrolet Equinox, Hyundai Tucson, Kia Sportage VW Tiguan, Hyundai Tucson, Dacia Duster BYD Song PLUS, Chery Tiggo 5X, ...
Automotive Sales Data Updated at: 2026/03/10
India - New car sales in 2025 by OEM, vehicle type
er 2025 were up 29.0% y/y to 349,170 units.For October through December of 2025, total vehicle wholesale were up 20.8% to 1,566,158 units, compared to the same period of 2024. PVs (passenger vehicle, UV and van) sales were up 20.6% y/y to 1,276,073 units (excludes BMW, Mercedes-Benz, Volvo Cars and Tata). CVs (M&HCVs and LCVs) sales were up 21.5% y/y to 290,085 units (excludes Daimler and Scania).Based on the release of carmakers, the available s...
Automotive Sales Data Updated at: 2026/02/03
South Africa - New car sales in 2025 by OEM, vehicle type
Y-o-Y 21.1% - Commercial Maker/Brand Dec. 2025 Share FAW 438 20.8% Isuzu 267 12.7% Toyota 250 11.9% Daimler Trucks and Buses 194 9.2% Volvo 177 8.4% UD Trucks 146 6.9% Scania 131 6.2% Iveco 90 4.3% Mercedes-Benz * 60 2.8% MAN 57 2.7% Ford 47 2.2% Powerstar 43 2.0% Tata 40 1.9% Sinotruk 37 1.8% Eicher 35 1.7% VW 28 1.3% Foton 18 0.9% Hyundai 17 0.8% DAF 14 0.7% Shacman 12 0.6% JAC 7 0.3% Dec.202...
Automotive Sales Data Updated at: 2026/02/03
France - New car sales in 2025 by OEM, vehicle type
- LOTUS Total 6 19 -68.4% 83 200 -58.5% Share 0.0% 0.0% 0.0 pt 0.0% 0.0% 0.0 pt GROUP MITSUBISHI Total 654 1,330 -50.8% 2,351 4,153 -43.4% Share 0.4% 0.7% -0.3 pt 0.1% 0.2% -0.1 pt - MITSUBISHI Total 654 1,330 -50.8% 2,351 4,153 -43.4% Share 0.4% 0.7% -0.3 pt 0.1% 0.2% -0.1 pt GROUP TATA Total 343 4,059 -91.5% 692 11,145 -93.8% Share 0.2% 2.2% -2.0 pt 0.0% 0.6% -0.6 pt - LAND ROVER Total 343 3,942 -91.3% 671 10,628 -93.7% S...
Automotive Sales Data Updated at: 2026/02/03
South Africa - New car sales in 2024 by OEM, vehicle type
Maker/Brand Dec. 2024 Share Toyota 418 17.7% Daimler Trucks and Buses 382 16.2% FAW 274 11.6% Isuzu 244 10.3% Scania 176 7.5% Volvo 151 6.4% UD Trucks 138 5.8% Sinotruk 130 5.5% Ford 87 3.7% MAN 85 3.6% Mercedes-Benz * 63 2.7% Powerstar 48 2.0% VW 47 2.0% Iveco 44 1.9% Tata 37 1.6% Hyundai 17 0.7% Others 21 0.9% Dec.2024 Total 2,362 - Dec.2023 Total 2,545 - Y-o-Y -7.2% - Source: National Association of A...
Automotive Sales Data Updated at: 2025/07/03
India - New car sales in 2024 by OEM, vehicle type
ars). CVs (M&HCVs and LCVs) sales were up 1.2% to 238,050 units (excludes Daimler and Scania).Based on the release of carmakers in December, the available sales results of PVs and CVs are as follows:Maruti-Suzuki sales of 132,523 units increased 24.4% in December compared to the same month in 2023. Tata sales of 76,599 units increased 0.6% from last year. Mahindra sales of 59,972 units increased 15.4% from last year. Hyundai sales of 42,208 units...
Automotive Sales Data Updated at: 2025/07/02
France - New car sales in 2024 by OEM, vehicle type
re 1.7% 1.1% 0.7 pt 1.2% 0.8% 0.3 pt - LYNK & CO Total 11 59 -81.4% 519 3,307 -84.3% Share 0.0% 0.0% 0.0 pt 0.0% 0.2% -0.2 pt - LOTUS Total 19 15 26.7% 200 145 37.9% Share 0.0% 0.0% 0.0 pt 0.0% 0.0% 0.0 pt - POLESTAR Total 0 0 -% 2 0 -% Share 0.0% 0.0% 0.0 pt 0.0% 0.0% 0.0 pt GROUP TATA Total 4,059 912 345.1% 11,145 7,926 40.6% Share 2.2% 0.5% 1.7 pt 0.6% 0.4% 0.2 pt - LAND ROVER Total 3,942 807 388.5% 10,628 6,918 53.6% S...
Automotive Sales Data Updated at: 2025/07/02
France - Flash report, Automotive sales volume, 2023
0% 1.1% 0.0 pt - VOLVO Total 1,983 1,704 16.4% 14,989 13,515 10.9% Share 1.1% 1.1% 0.0 pt 0.8% 0.9% 0.0 pt - LYNK & CO Total 59 473 -87.5% 3,307 3,098 6.7% Share 0.0% 0.3% -0.3 pt 0.2% 0.2% 0.0 pt - LOTUS Total 15 5 200.0% 145 16 806.3% Share 0.0% 0.0% 0.0 pt 0.0% 0.0% 0.0 pt GROUP TATA Total 912 661 38.0% 7,926 5,465 45.0% Share 0.5% 0.4% 0.1 pt 0.4% 0.4% 0.1 pt - LAND ROVER Total 807 594 35.9% 6,918 4,372 58.2% Share 0.4...
Automotive Sales Data Updated at: 2025/06/04
South Africa - Flash report, Automotive sales volume, 2023
87 - Dec.2022 Total 39,221 - Y-o-Y -3.7% - Commercial Maker/Brand Dec. 2023 Share Daimler Trucks and Buses 563 22.1% Isuzu 316 12.4% Toyota 261 10.3% Volvo 257 10.1% Scania 203 8.0% Iveco 153 6.0% UD Trucks 152 6.0% MAN 130 5.1% FAW 128 5.0% Mercedes-Benz * 109 4.3% Tata 72 2.8% Powerstar 49 1.9% Ford 48 1.9% VW 45 1.8% Sinotruk 15 0.6% JAC 13 0.5% DAF 12 0.5% Eicher 11 0.4% Hyundai 5 0.2% Dec.20...
Automotive Sales Data Updated at: 2025/06/04
India - Flash report, Automotive sales volume, 2023
Cars). CVs (M&HCVs and LCVs) sales were up 3.3% to 234,532 units (excludes Daimler and Scania).Based on the release of carmakers in December, the available sales results of PVs and CVs are as follows:Maruti-Suzuki sales of 106,492 units decreased 6.2% in December compared to the same month in 2022. Tata sales of 76,138 units increased 4.3% from last year. Mahindra sales of 50,691 units increased 6.4% from last year. Hyundai sales of 42,750 units ...
Automotive Sales Data Updated at: 2025/06/04
Indonesia - Flash report, Automotive sales volume, 2023
8 0.0% -% 714 0.1% -% FAW 33 0.0% 175.0% 617 0.1% 223.0% Subaru 38 0.0% 22.6% 561 0.1% 162.1% Jeep 6 0.0% -% 334 0.0% -% VW 10 0.0% -50.0% 247 0.0% -38.7% Peugeot 7 0.0% -61.1% 199 0.0% -55.9% Neta 81 0.1% -% 181 0.0% -% SERES 44 0.1% -% 111 0.0% -% Audi 1 0.0% -90.9% 58 0.0% 9.4% Tata 1 0.0% -% 31 0.0% -84.9% Total 85,284 100.0% -19.1% 1,005,802 100.0% -4.0% Source:GAIKINDO Flash report, November 2023 Dec 14, 2023 *T...
Automotive Sales Data Updated at: 2025/06/04
Thailand - Flash report, Automotive sales volume, 2022
.0% Hyundai 806 1.4% 667 1.1% 20.8% 4,686 0.8% 3,094 0.6% 51.5% Suzuki 196 0.3% 366 0.6% -46.4% 3,362 0.6% 2,892 0.6% 16.3% Subaru 313 0.5% 371 0.6% -15.6% 2,257 0.4% 2,934 0.6% -23.1% Peugeot 48 0.1% 97 0.2% -50.5% 590 0.1% 440 0.1% 34.1% KIA 0 0.0% 4 0.0% -100.0% 8 0.0% 39 0.0% -79.5% TATA 0 0.0% 0 0.0% -% 0 0.0% 72 0.0% -100.0% Others 363 0.6% 43 0.1% 744.2% 712 0.1% 315 0.1% 126.0% Total 58,101 100.0% 59,093 100.0% -1.7% 584,3...
Automotive Sales Data Updated at: 2025/06/04
France - Flash report, Automotive sales volume, 2022
al 1,008 1,994 -49.4% 14,750 22,907 -35.6% Share 0.6% 1.3% -0.6 pt 1.0% 1.4% -0.4 pt GROUP GEELY Total 1,704 2,638 -35.4% 13,515 17,285 -21.8% Share 1.1% 1.7% -0.6 pt 0.9% 1.0% -0.2 pt - VOLVO Total 1,704 2,638 -35.4% 13,515 17,285 -21.8% Share 1.1% 1.7% -0.6 pt 0.9% 1.0% -0.2 pt GROUP TATA Total 661 1,164 -43.2% 5,465 7,796 -29.9% Share 0.4% 0.7% -0.3 pt 0.4% 0.5% -0.1 pt - LAND ROVER Total 594 896 -33.7% 4,372 6,078 -28.1% S...
Automotive Sales Data Updated at: 2025/06/04
South Africa - Flash report, Automotive sales volume, 2022
231 - Dec. 2021 Total 33,942 - Y-o-Y 15.6% - Commercial Maker/Brand Dec. 2022 Share Daimler Trucks and Buses 518 20.3% Isuzu 343 13.4% Mercedes-Benz * 314 12.3% Toyota 285 11.2% FAW 221 8.7% Scania 216 8.5% UD Trucks 179 7.0% Volvo 165 6.5% MAN 76 3.0% Iveco 61 2.4% Tata 50 2.0% VW 41 1.6% Hyundai 23 0.9% Eicher 22 0.9% DAF 17 0.7% Powerstar 8 0.3% JAC 7 0.3% Ford 6 0.2% Dec. 2022 Total 2,552 - D...
Automotive Sales Data Updated at: 2025/06/04
India - Flash report, Automotive sales volume, 2022
Cars). CVs (M&HCVs and LCVs) sales were up 16.6% to 227,111 units (excludes Daimler and Scania).Based on the release of carmakers in December, the available sales results of PVs and CVs are as follows:Maruti-Suzuki sales of 113,535 units decreased 9.9% in December compared to the same month in 2021.Tata sales of 72,997 units increased 10.1% from last year.Mahindra sales of 47,646 units increased 44.1% from last year.Hyundai sales of 38,831 units ...
Automotive Sales Data Updated at: 2025/06/04
Indonesia - Flash report, Automotive sales volume, 2022
ia 103 0.1% 232.3% 2,086 0.2% -27.9% UD Trucks 155 0.1% -22.1% 1,993 0.2% 202.0% Lexus 92 0.1% 41.5% 1,033 0.1% 6.3% MG 118 0.1% 84.4% 974 0.1% -9.4% MINI 43 0.0% 104.8% 700 0.1% 6.5% Peugeot 18 0.0% -53.8% 451 0.0% 70.2% VW 20 0.0% -41.2% 403 0.0% 6.1% Subaru 31 0.0% -% 214 0.0% -% Tata 0 0.0% -100.0% 205 0.0% 18.5% FAW 12 0.0% -50.0% 191 0.0% 9.8% Audi 11 0.0% 120.0% 53 0.0% 39.5% Total 105,354 100.0% 9.0% 1,048,040 100.0%...
Automotive Sales Data Updated at: 2025/06/04
South Africa - Flash report, Automotive sales volume, 2021
20 Total 35,325 - Y-o-Y -3.9% - Commercial Maker/Brand Dec. 2021 Share Daimler Trucks and Buses * 350 17.4% Toyota 278 13.8% Isuzu 226 11.2% Scania 186 9.3% MAN 169 8.4% Volvo 147 7.3% UD Trucks 138 6.9% Mercedes-Benz * 126 6.3% Iveco 118 5.9% VW 83 4.1% FAW 67 3.3% Tata 60 3.0% Powerstar 24 1.2% Hyundai 20 1.0% Eicher 11 0.5% DAF 6 0.3% Dec. 2021 Total 2,009 - Dec. 2020 Total 1,925 - Y-o-Y 4.4% - ...
Automotive Sales Data Updated at: 2025/06/04


 Japan
Japan USA
USA Mexico
 Germany
 China (Shanghai)
 Thailand
 India
India