


Search Results by Category
All information related to {{ key_word }}.
AI Navigator will guide you. Click here for information about {{ key_word }}.
Images
 2
2
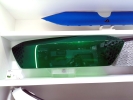
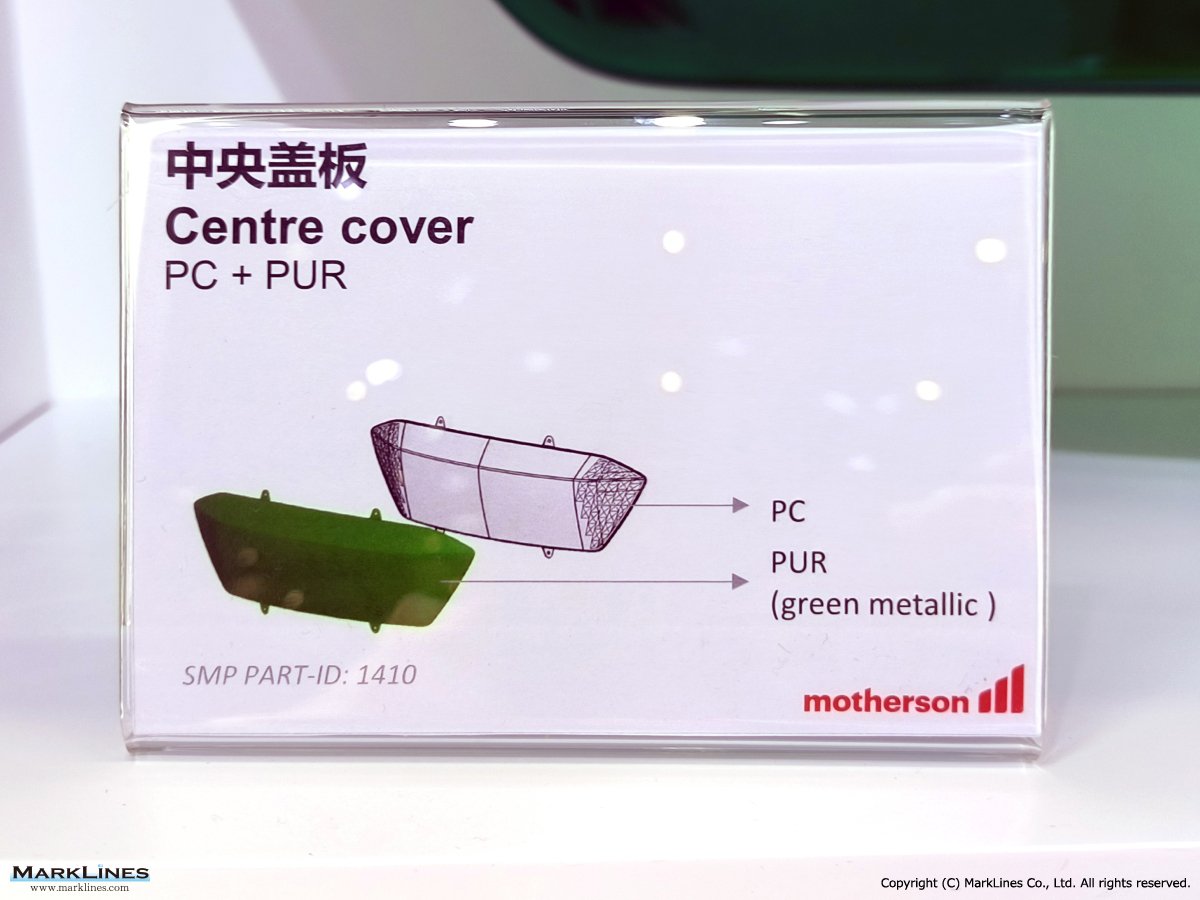
Center cover (PC + PUR)
 2
2
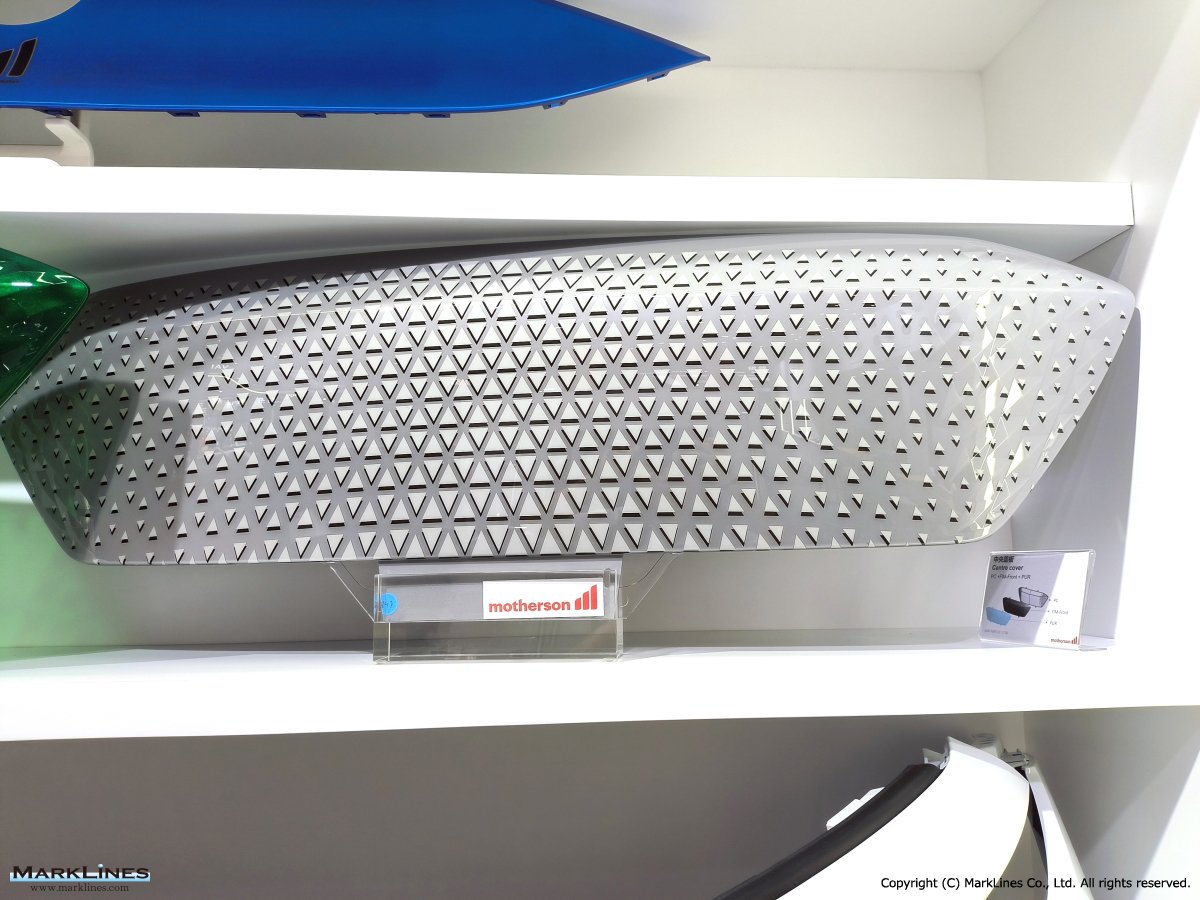
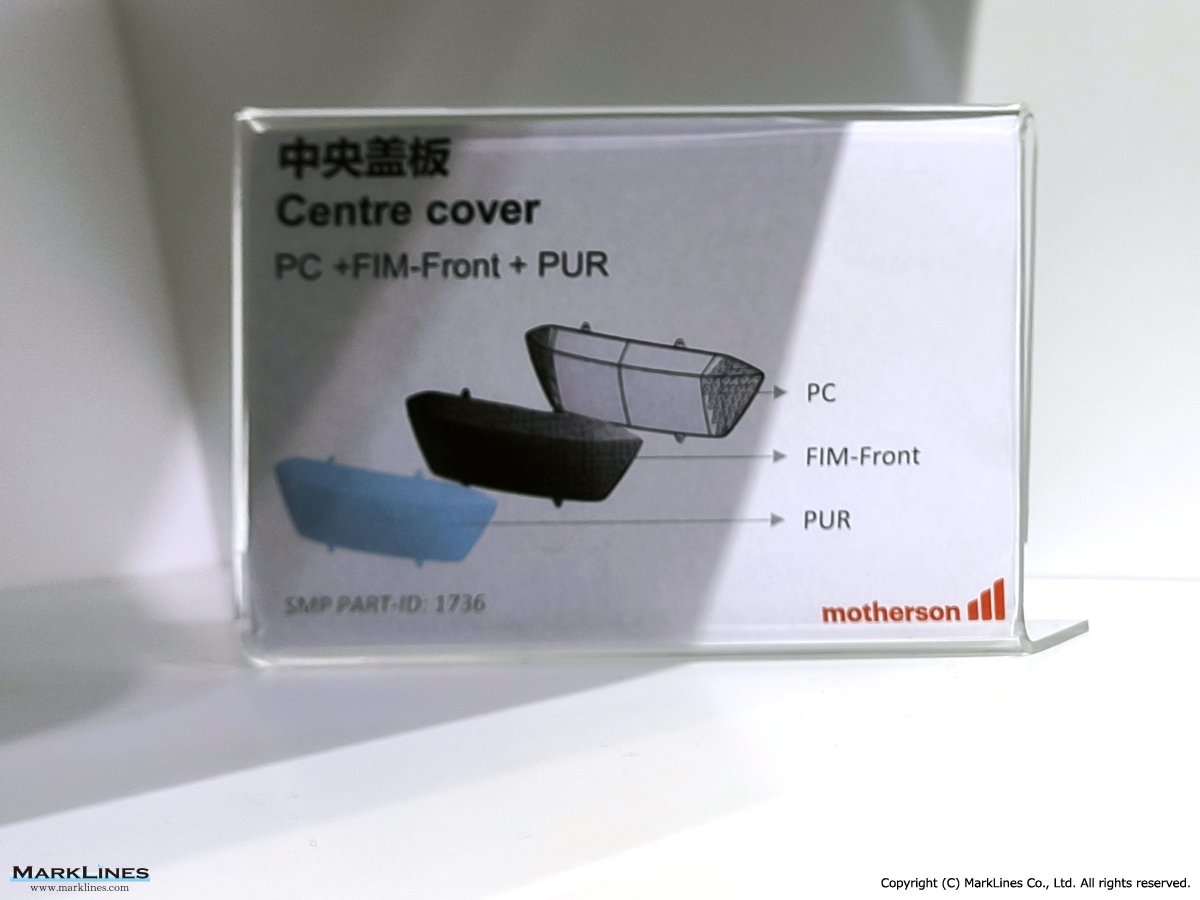
Center cover (PC + FIM-Front + PUR)
 3
3
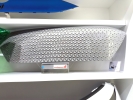
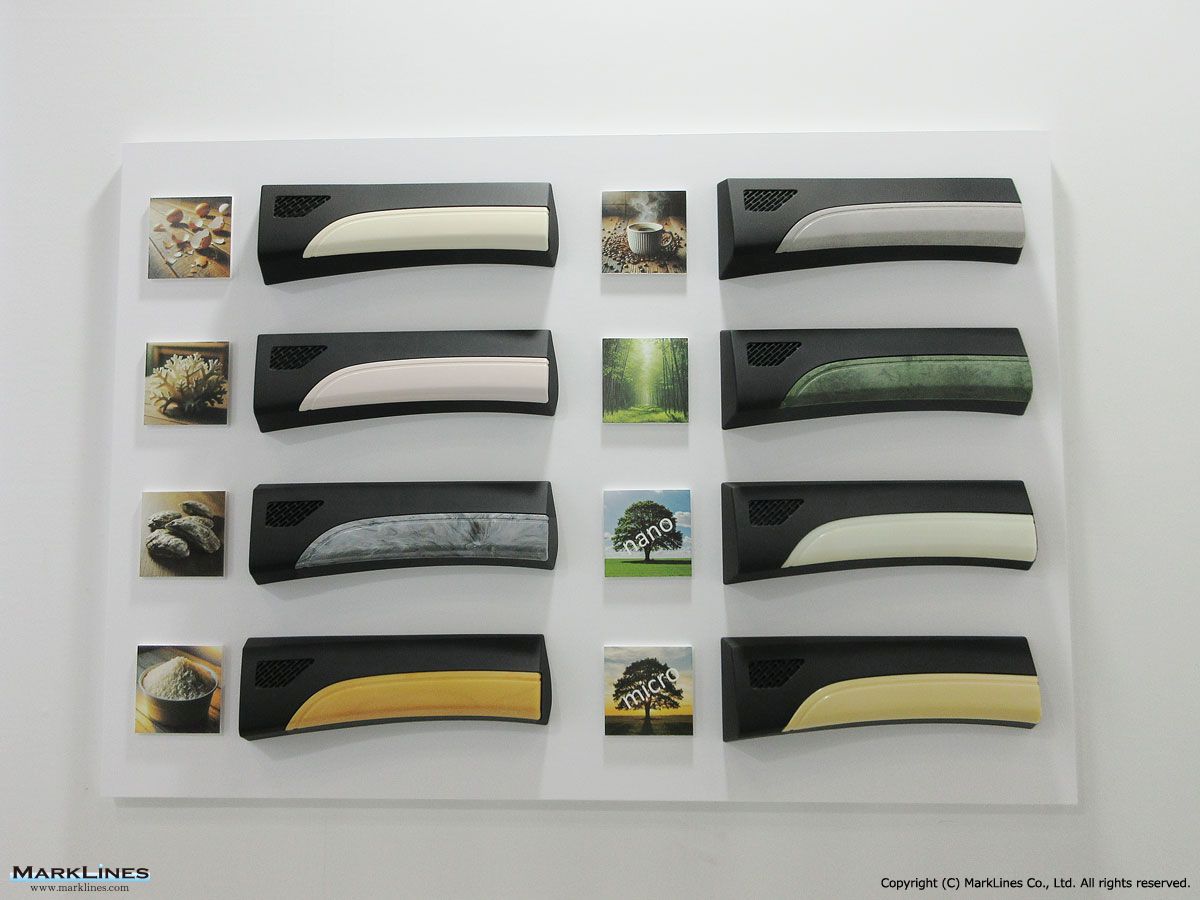
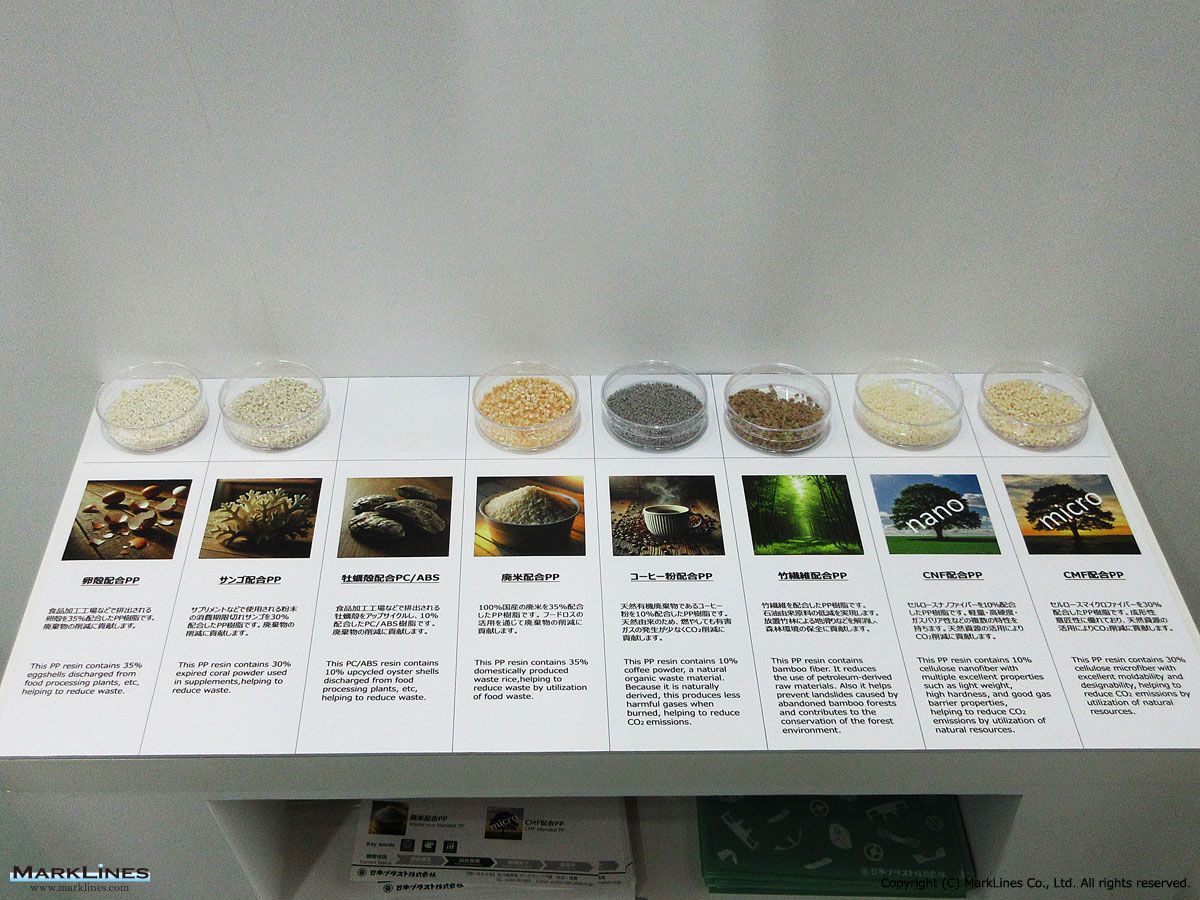
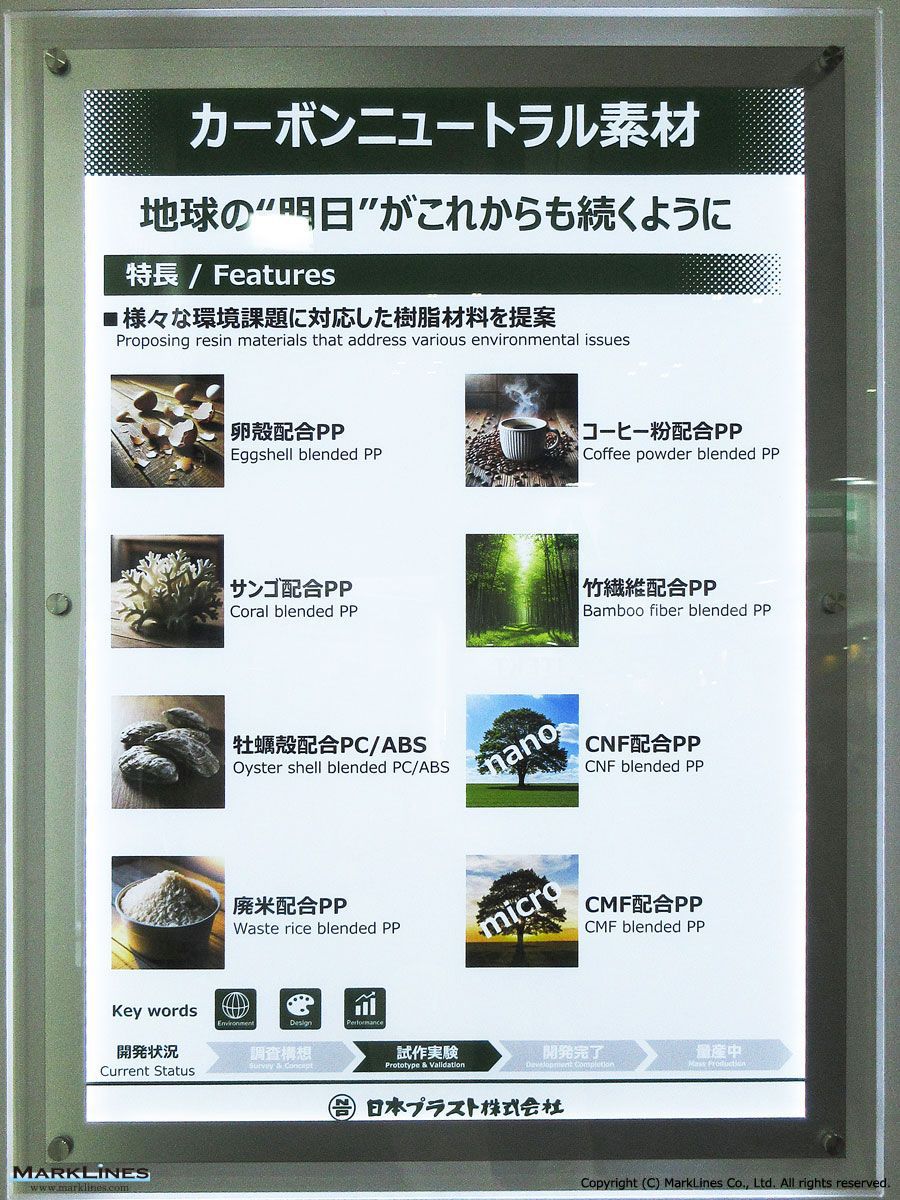
Carbon-neutral plastic materials
 1
1
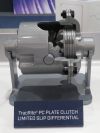
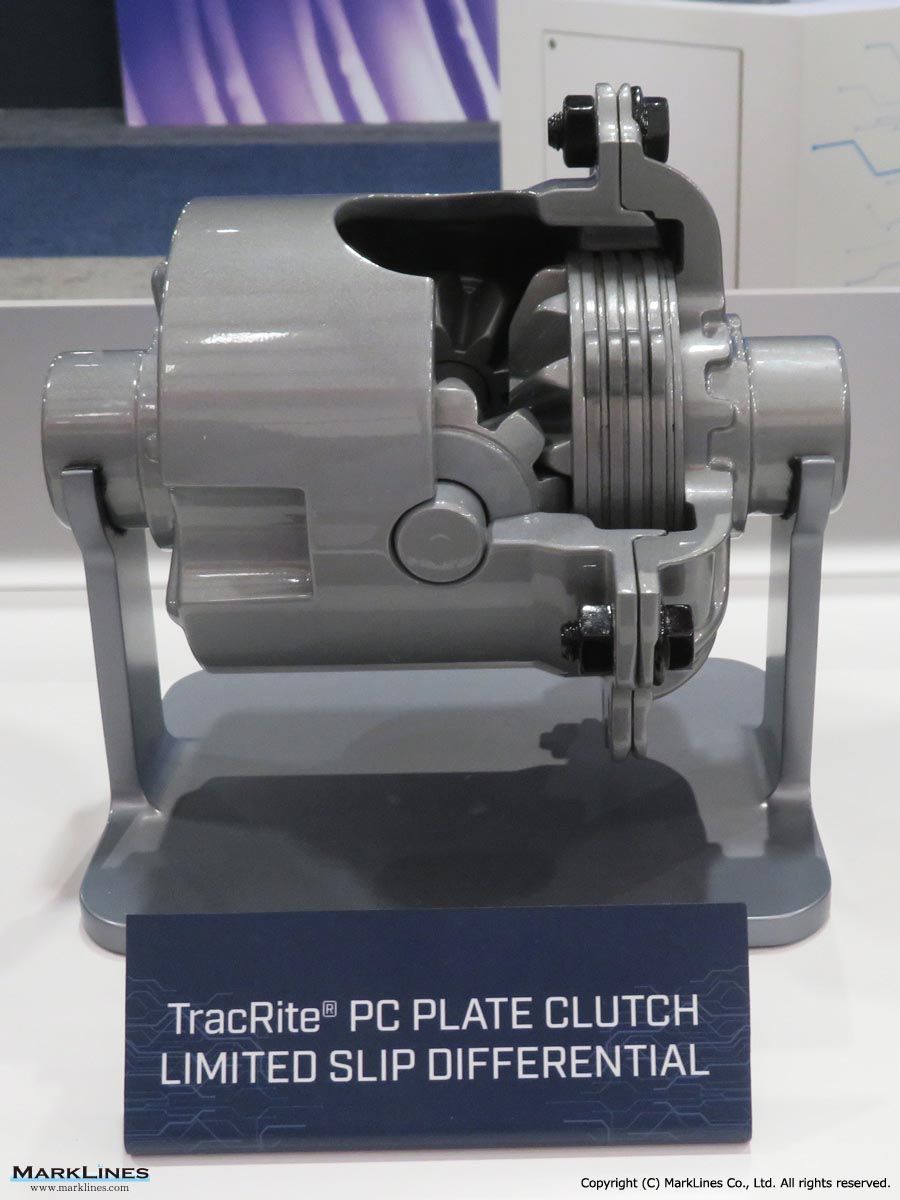
TracRite PC plate clutch limited slip differential
 2
2
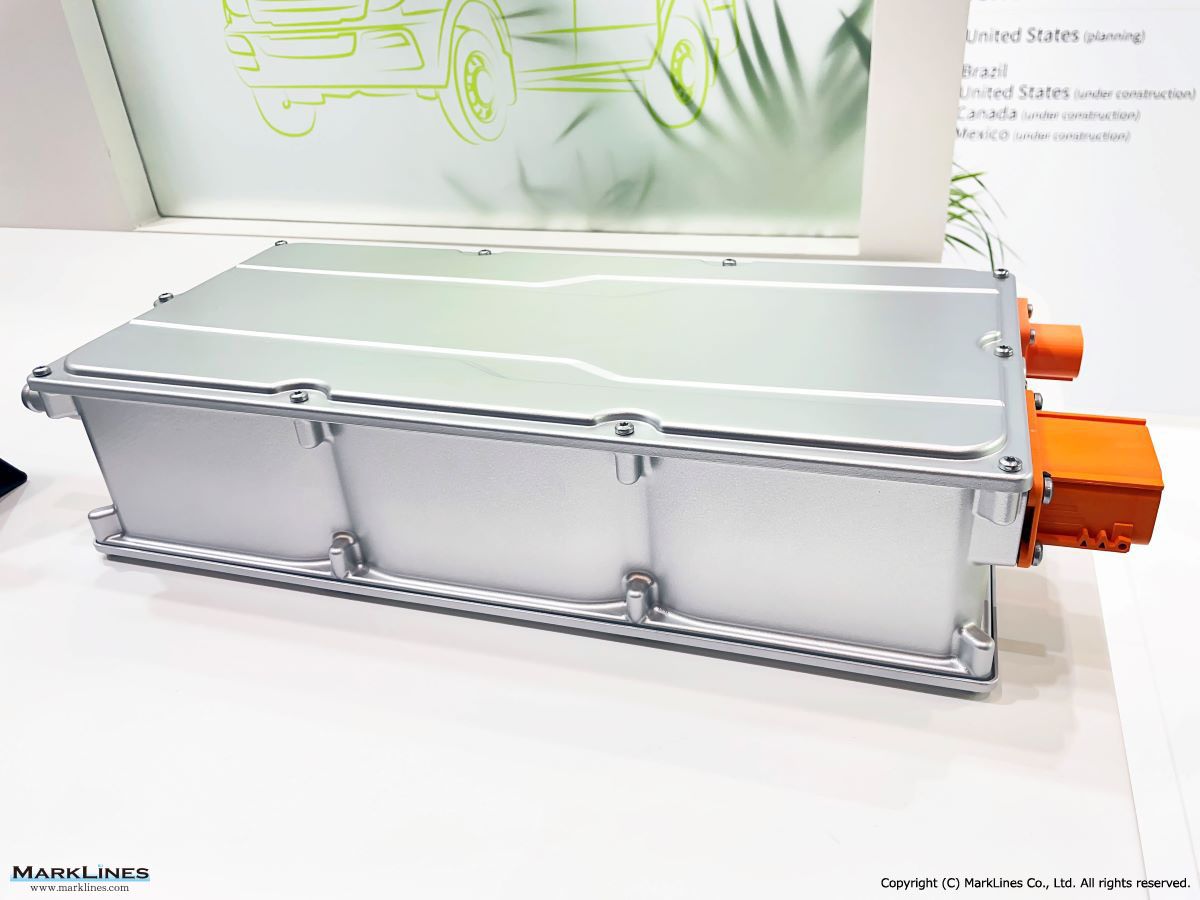
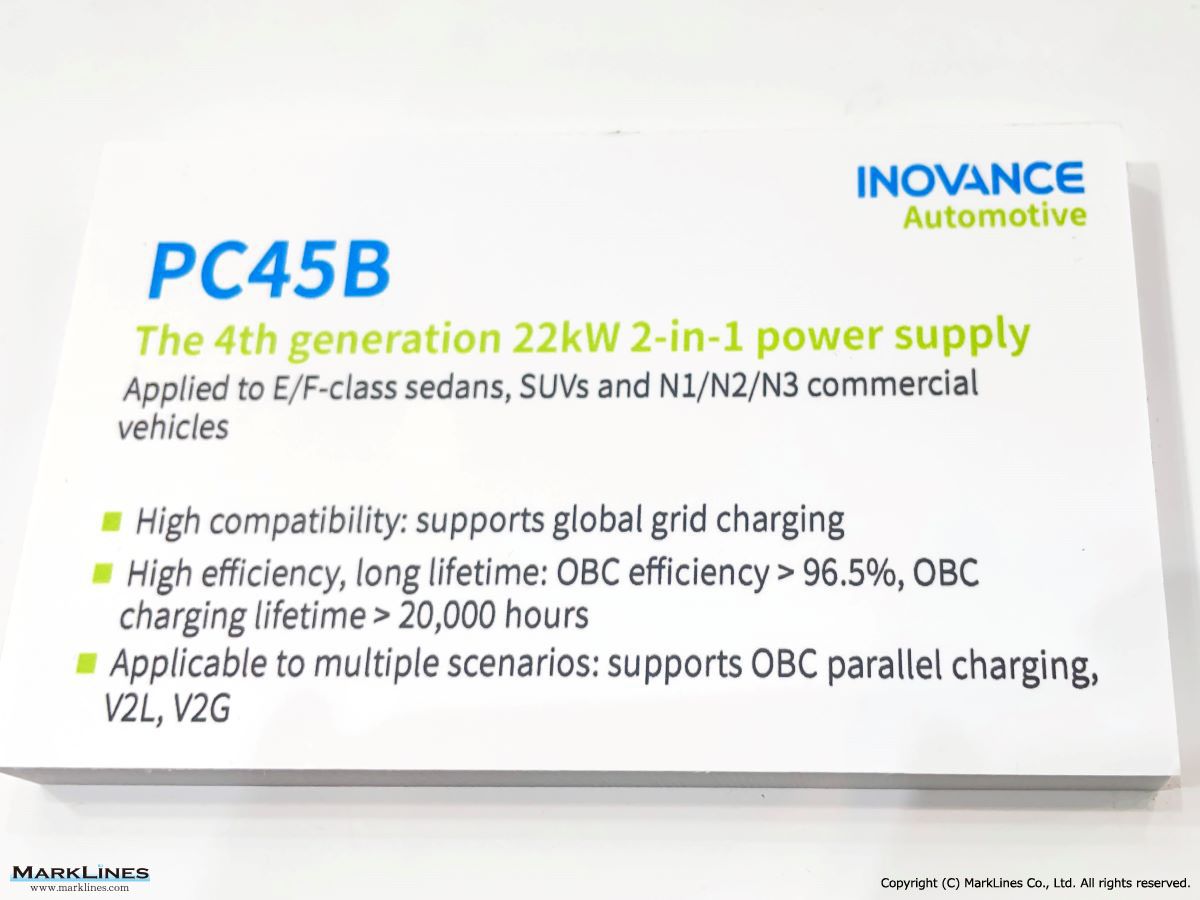
PC45B
 2
2
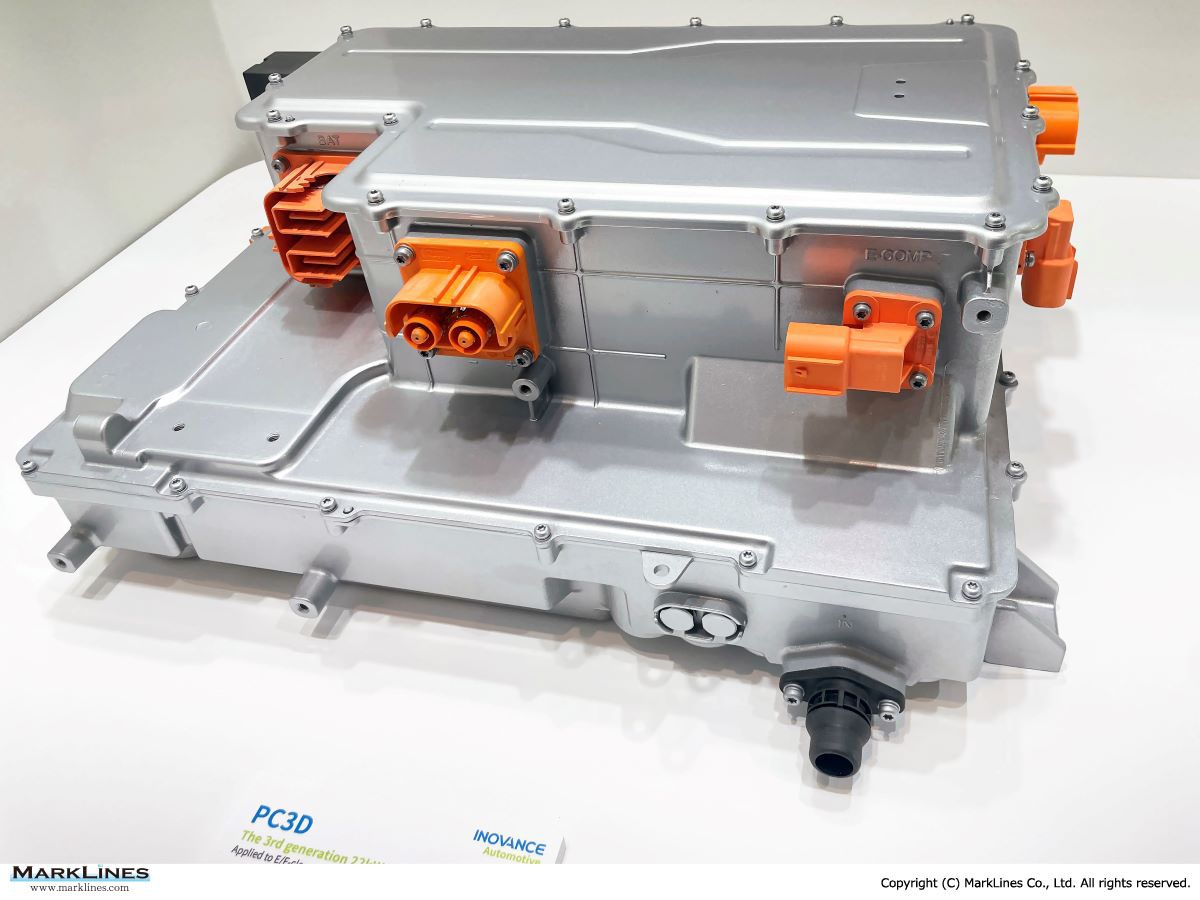
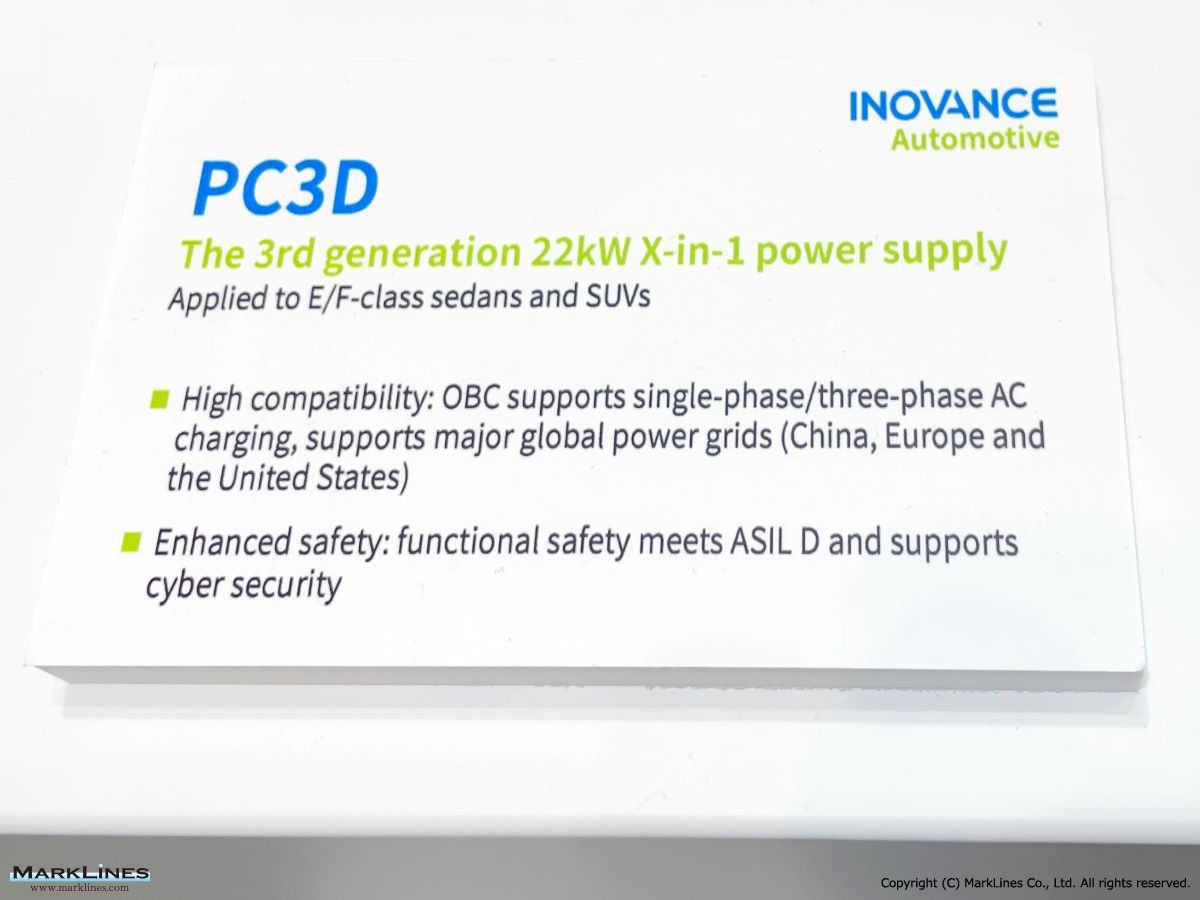
PC3D
 1
1
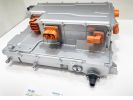
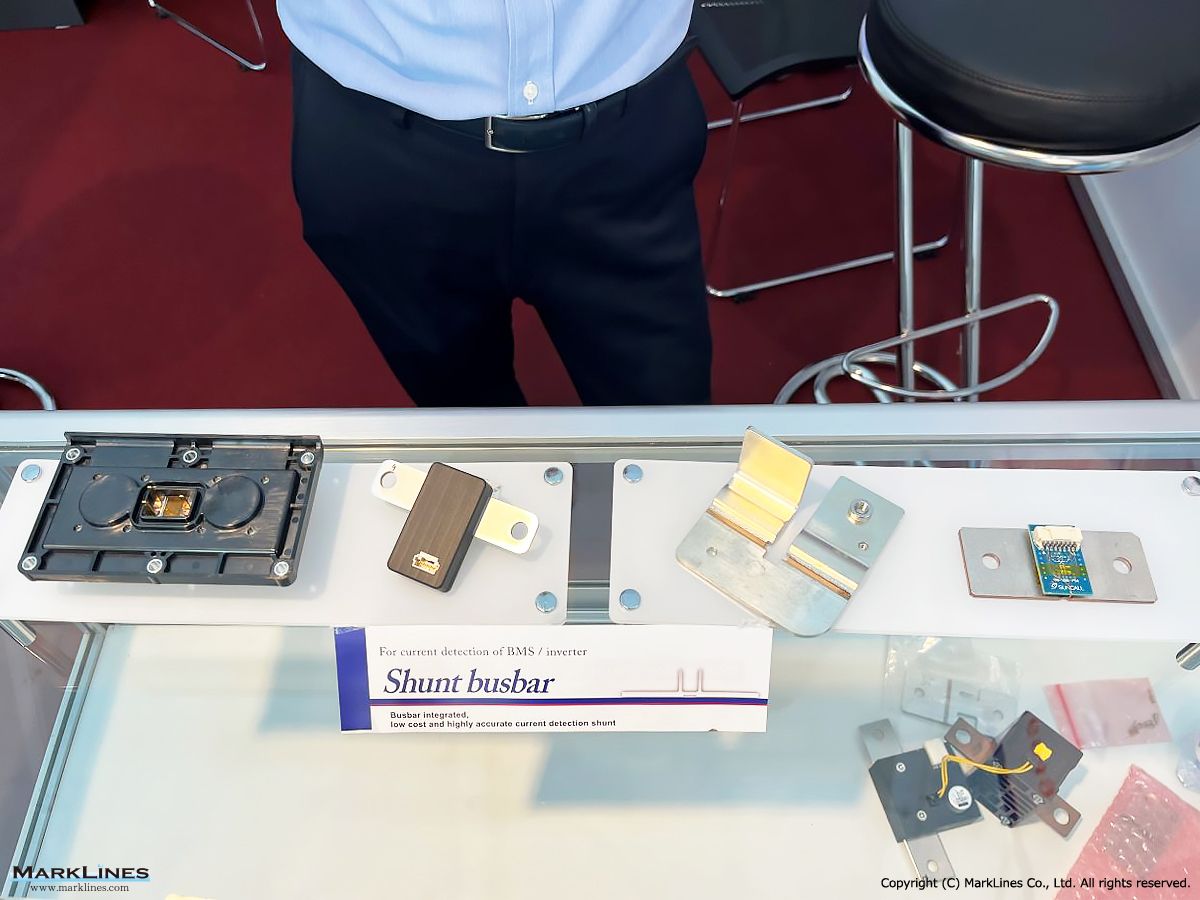
Connector integrated shunt busbar
 3
3
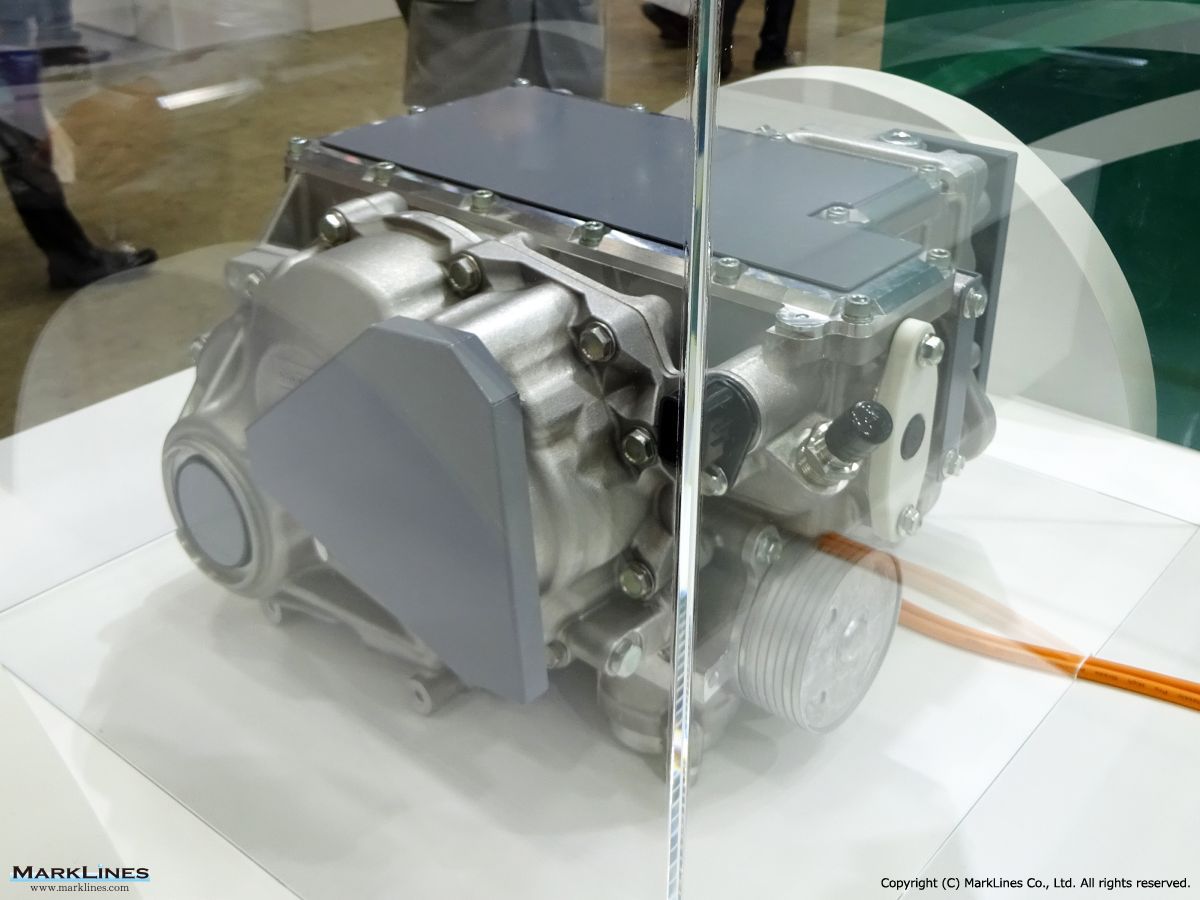
Ultra-Compact e-Axle
 3
3
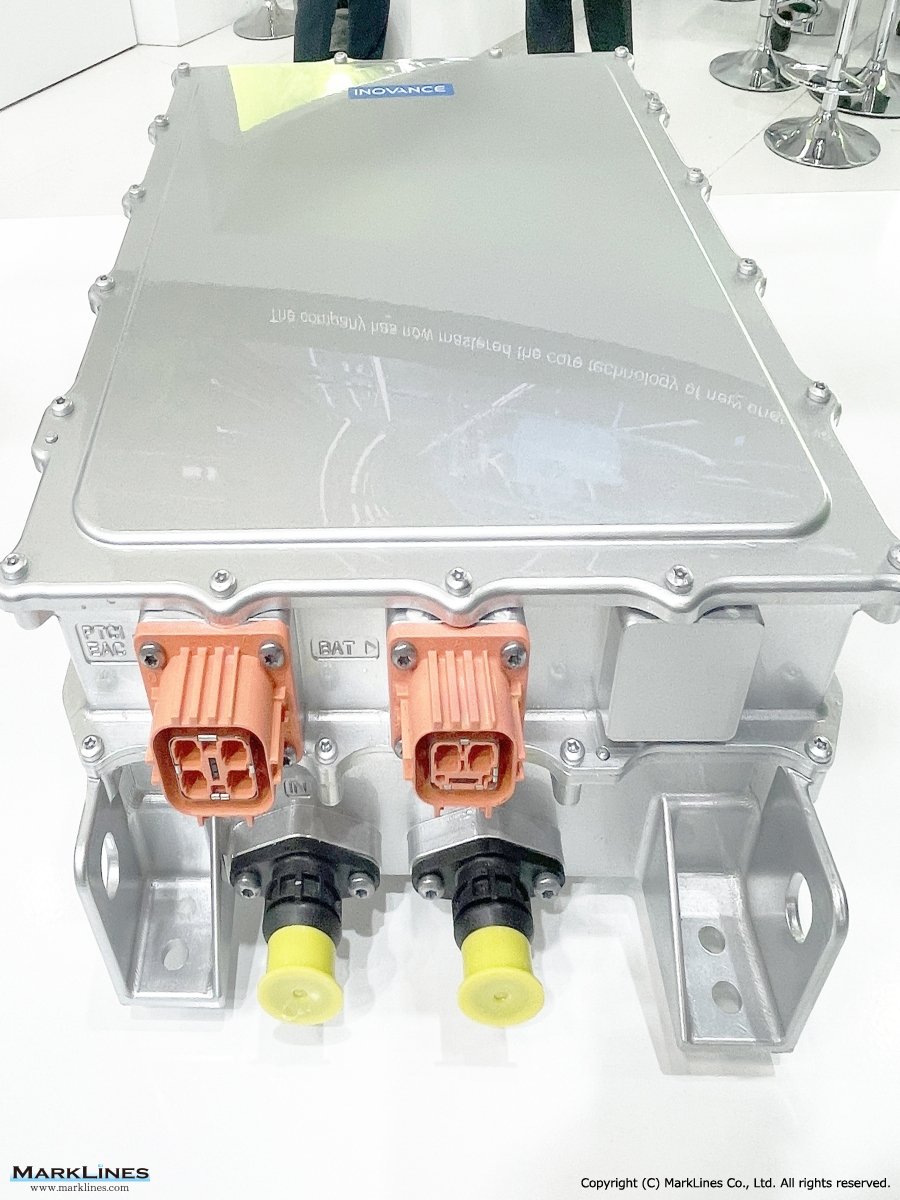
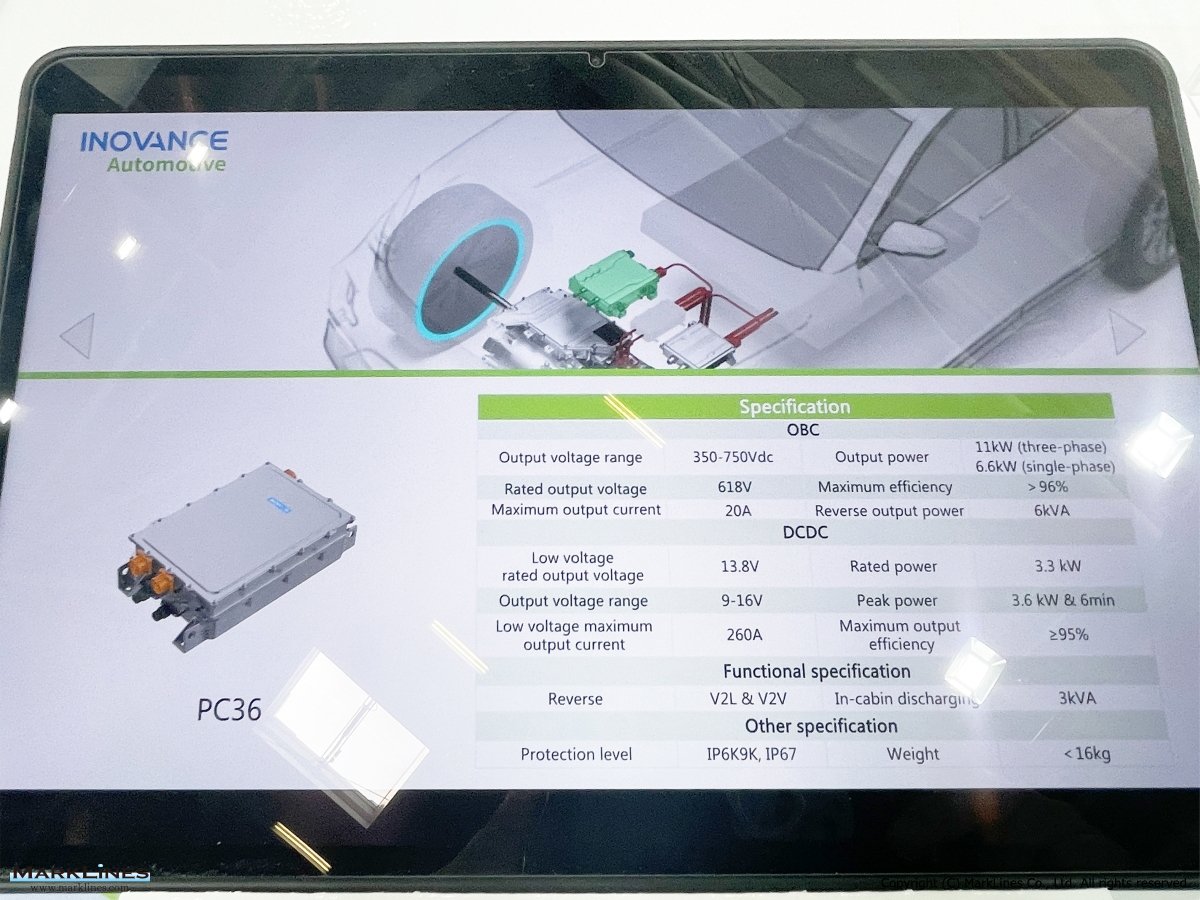
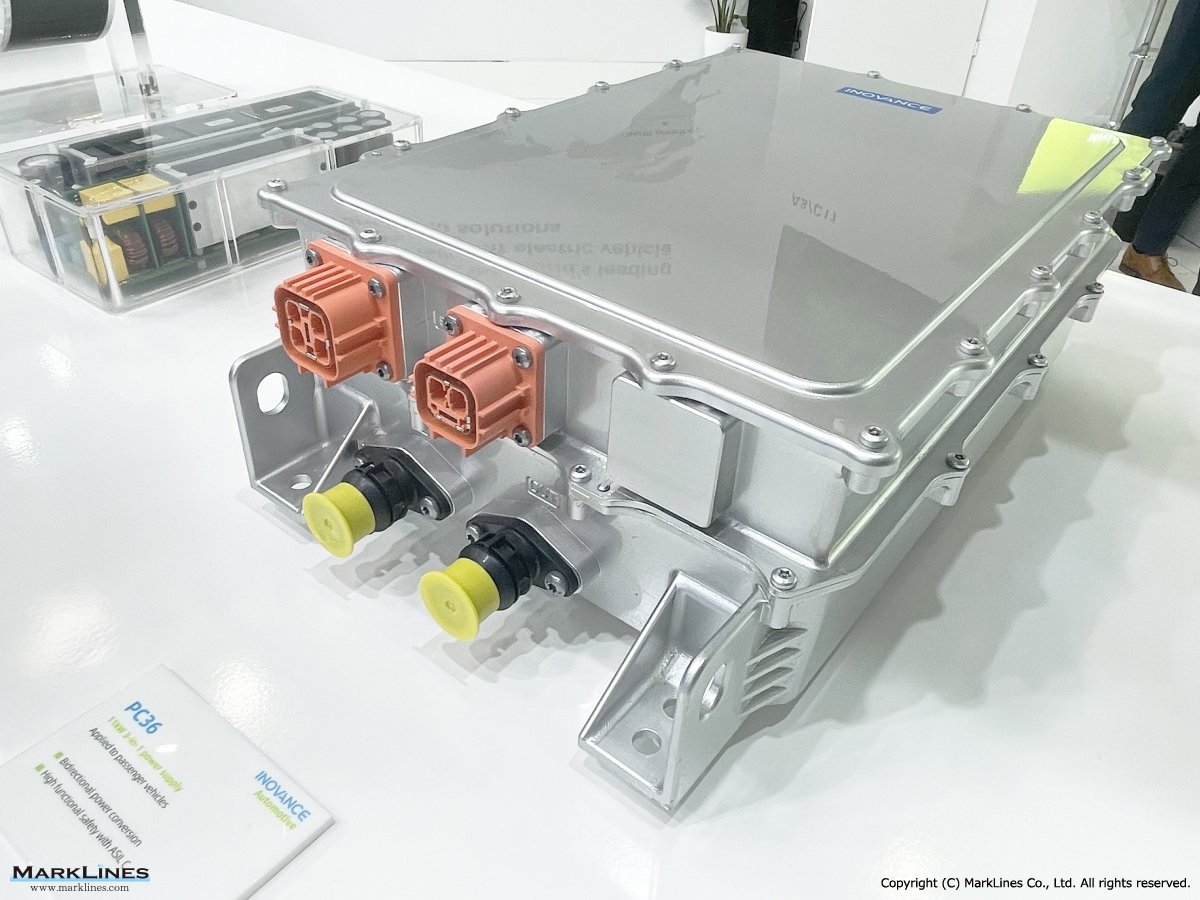
PC36
 2
2
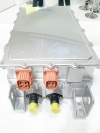
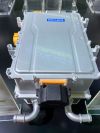
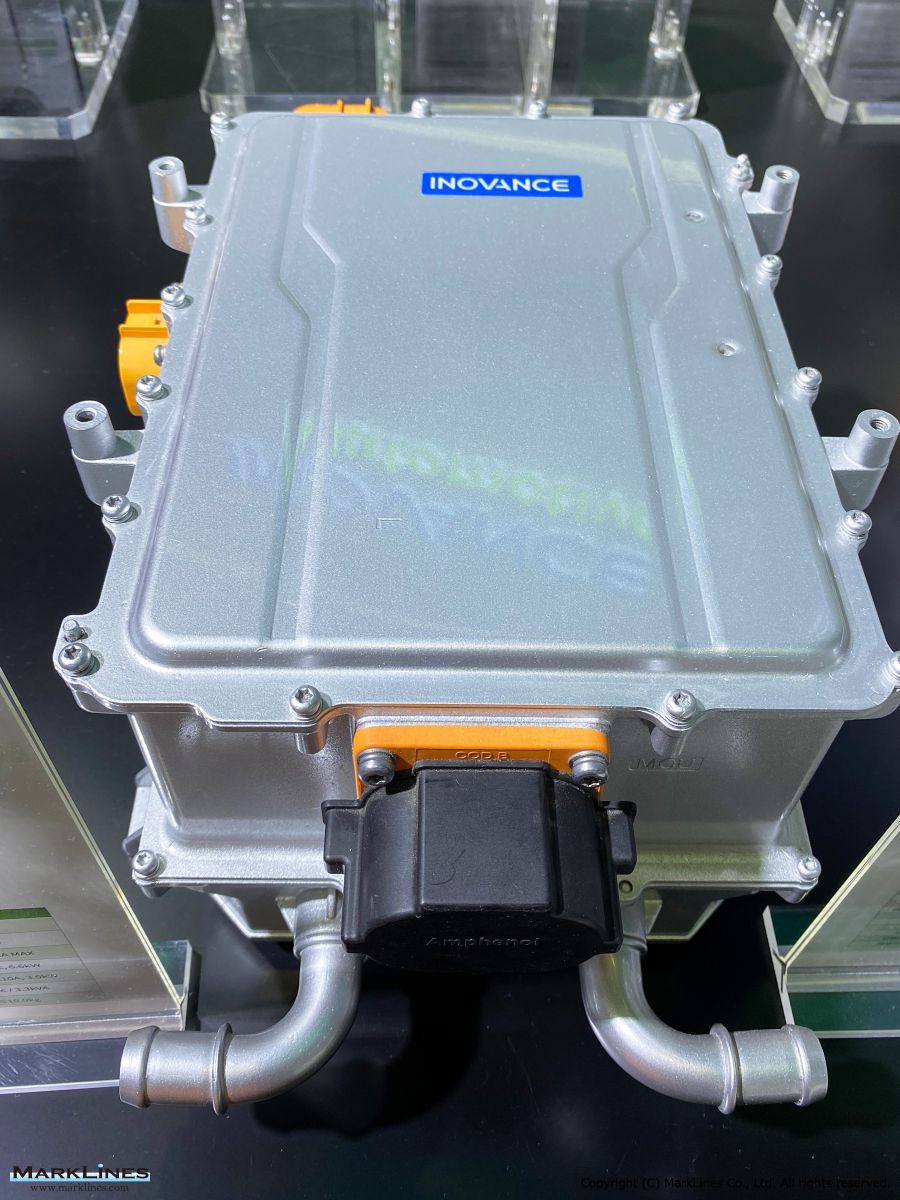
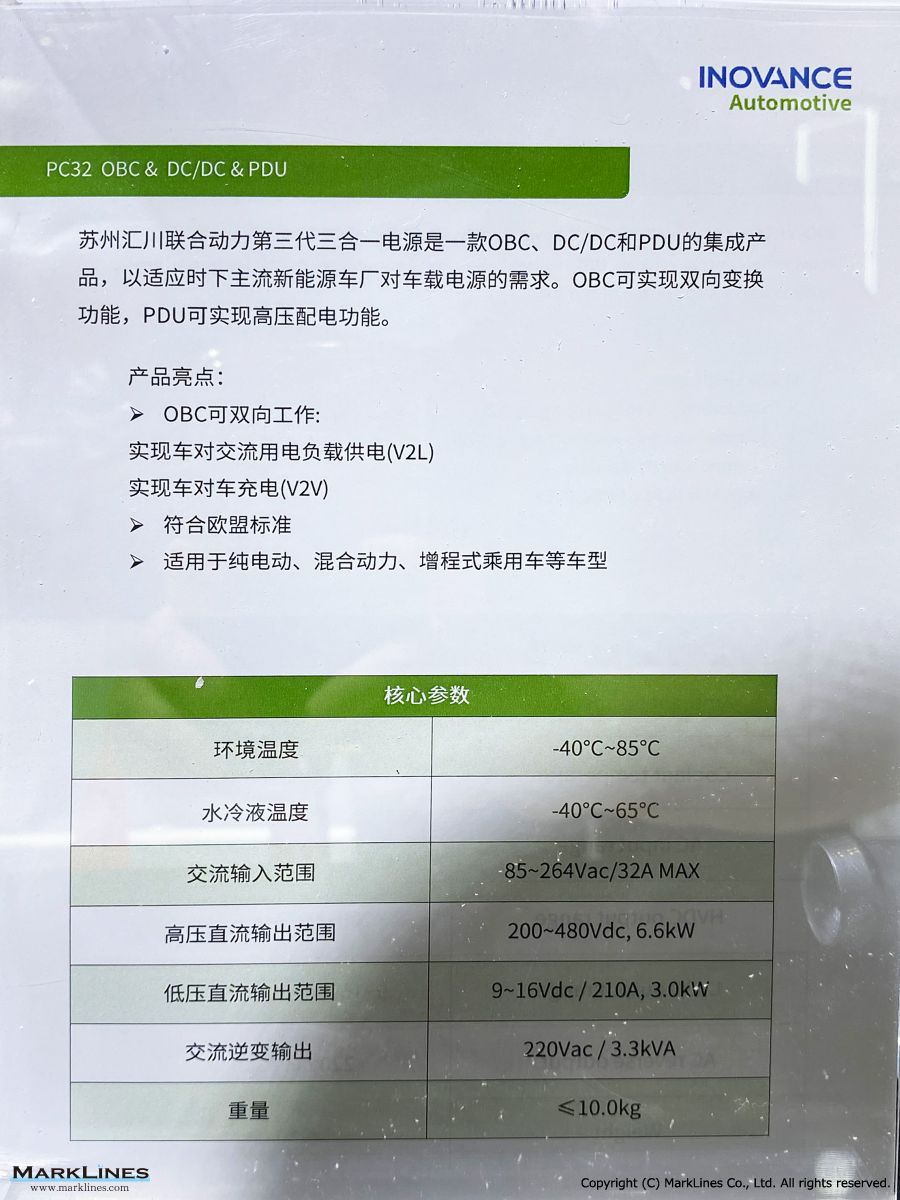
PC32 on-board charger, DC/DC converter, power distribution unit
Sort by :
1 - 20 of 27 results
Philippines - Flash report, Automotive sales volume, 2022
ported on July 19, 2022, a joint report by the Chamber of Automotive Manufacturers of the Philippines Inc. (CAMPI) and Truck Manufacturers Association (TMA) showed that sales of local car and truck makers in June 2022 increased 26.8% year-over-year (YoY) to 28,601 units.CAMPI-TMA’s passenger car (PC) sales saw 1.0% increase YoY to 7,457 units in June 2022, while commercial vehicle (CV) sales up 39.4% YoY to 21,144 units.In the first 6 months of...
Automotive Sales Data Updated at: 2025/06/04
Philippines - Flash report, Automotive sales volume, 2021
vehicle sales in 2021 up 20% with 268,488 unitsReported on January 13, 2022, A joint report of the Chamber of Automotive Manufacturers of the Philippines Inc. (CAMPI) and Truck Manufacturers Association (TMA) showed that vehicle sales in 2021 went up 20% with 268,488 units. Of which, passenger car (PC) sales accelerated by 22.4% to 85,260 units, while commercial vehicle (CV) sales jumped 18.9% to 183,228 units in 2021.Sales in December 2021 alone...
Automotive Sales Data Updated at: 2025/06/04
Brazil - Flash report, Sales volume, 2019
were up 14.9% from a year ago with 17,626 units (market share of 9.2%), gasoline vehicles decreased 1.8% to 5,832 units (market share of 3.1%), and hybrid and electric vehicles increased 36.0% to 370 units.Automobile production, sales, export units Type Jan. 2019 Jan. 2018 Y-o-Y Registration PC 163,414 148,904 9.7% LCV 27,795 26,953 3.1% Trucks 6,987 4,561 53.2% Buses 1,598 848 88.4% Total 199,794 181,266 10.2% Export PC 21,485 3...
Automotive Sales Data Updated at: 2020/01/09
Brazil - Flash report, Sales volume, 2017
3 units.As for October production figures (excluding CKD production), units produced increased 42.2% to 249,932 units. Exports in October increased 66.6% to 61,554 units.Automobile production, sales, export units Type Oct. 2017 Oct. 2016 Y-o-Y Jan.-Oct. 2017 Jan.-Oct. 2016 Y-o-Y Registration PC 166,822 132,368 26.0% 1,515,254 1,369,576 10.6% LCV 30,120 22,641 33.0% 257,767 246,062 4.8% Trucks 5,029 3,444 46.0% 40,393 42,309 -4.5% Bus...
Automotive Sales Data Updated at: 2018/07/24
China - Flash report, Sales volume, 2017
H6 55,126 80,495 -31.5% 506,362 580,683 -12.8% 3 VW Lavida 44,703 37,550 19.0% 457,114 478,857 -4.5% 4 Buick Excelle GT 40,939 31,726 29.0% 416,990 370,372 12.6% 5 Nissan Bluebird Sylphy/Sylphy 44,141 43,831 0.7% 405,854 367,979 10.3% 6 Baojun Baojun 510 54,050 0 -% 363,949 0 -% 7 GAC Trumpchi GS4 22,628 26,480 -14.5% 337,330 333,280 1.2% 8 Toyota Corolla/New Corolla 19,406 29,698 -34.7% 336,018 324,052 3.7% 9 VW Sagitar 29,946 25,1...
Automotive Sales Data Updated at: 2018/07/24
USA - Flash report, Sales volume, 2017
ecreased an estimated 4.5%, while Volkswagen Group sales increased 10.7% from the same month last year.Volvo sales increased 10.5%, while Jaguar Land Rover sales decreased 4.4% from last October.Sales of new vehicles by type Type 2017 2016 Y-o-Y 2017 2016 Y-o-Y Oct. Oct. Jan.-Oct. Jan.-Oct. PC 478,735 526,462 -9.1% 5,333,374 5,949,227 -10.4% Light Trucks 876,140 845,858 3.6% 8,895,974 8,530,180 4.3% Total 1,35...
Automotive Sales Data Updated at: 2018/07/24
Australia - Flash report, Sales volume, 2017
re recently released data and detailed information in the database do not match up for reasons including different information sources, and discrepancies between preliminary reports and confirmed data. New vehicle sales by type Type Nov. 2017 Nov. 2016 Y-o-Y Jan.-Nov. 2017 Jan.-Nov. 2016 Y-o-Y PC 36,929 39,852 -7.3% 413,264 443,872 -6.9% SUV 40,748 37,536 8.6% 425,217 406,082 4.7% LCV 20,059 18,592 7.9% 214,444 199,508 7.5% HCV 3,629 2...
Automotive Sales Data Updated at: 2018/07/24
Argentina - Flash report, Sales volume, 2017
not match up for reasons including different information sources, and discrepancies between preliminary reports and confirmed data. *Since June 2015, we have changed the data source for the sales volume of Argentina. New vehicle sales by type Type Oct. 2017 Oct. 2016 Y-o-Y 2017 2016 Y-o-Y PC 57,027 45,889 24.3% 574,680 453,481 26.7% LCV 16,701 15,165 10.1% 171,824 133,209 29.0% HCV 2,368 1,646 43.9% 22,095 14,448 52.9% Other 1,131...
Automotive Sales Data Updated at: 2018/07/24
China - Flash report, Sales volume, 2016
shipments) Dec. 2016 Jan.-Dec. 2016 Units(10,000) Share(%) Y-oY(%) Units(10,000) Share(%) Y-oY(%) Sedan/Hatchback 125.46 41.04 -2.27 1214.99 43.35 3.44 MPV 27.17 8.89 -0.51 249.65 8.91 18.38 SUV 108.21 35.39 35.61 904.70 32.28 44.59 Mini Van 6.38 2.09 -32.60 68.35 2.44 -37.81 PC Total 267.23 87.41 9.09 2437.69 86.97 14.93 CV Total 38.51 12.60 12.14 365.13 13.03 5.80 Grand Total 305.73 - 9.47 2802.82 - 13.65 Source:...
Automotive Sales Data Updated at: 2017/01/18
Brazil - Flash report, Sales volume, 2016
ion units, an increase of 11% compared to the 2016 result. Anfavea forecasts that the export should continue to expand in 2017 to 558,000 units with an increase of 7.2%. Automobile production, sales, export units Type Dec. 2016 Dec. 2015 Y-o-Y Jan.-Dec. 2016 Jan.-Dec. 2015 Y-o-Y Registration PC 168,311 193,246 -12.9% 1,676,717 2,123,008 -21.0% LCV 30,900 27,599 12.0% 311,876 357,521 -12.8% Trucks 4,451 5,618 -20.8% 50,562 71,655 -29.4%...
Automotive Sales Data Updated at: 2017/01/10
Argentina - Flash report, Sales volume, 2016
do not match up for reasons including different information sources, and discrepancies between preliminary reports and confirmed data. *Since June 2015, we have changed the data source for the sales volume of Argentina. New vehicle sales by type Type Dec. 2016 Dec. 2015 Y-o-Y 2016 2015 Y-o-Y PC 29,057 22,621 28.5% 525,757 480,952 9.3% LCV 9,436 7,333 28.7% 156,770 133,125 17.8% HCV 1,084 1,097 -1.2% 17,163 19,550 -12.2% Other 570 530...
Automotive Sales Data Updated at: 2017/01/06
USA - Flash report, Sales volume, 2016
8% and 5.3% respectively, while Volkswagen Group sales increased 17.1% from the same month last year.Volvo sales increased 8.4%, while Jaguar Land Rover sales increased 30.5% from last December. Sales of new vehicles by type Type 2016 2015 Y-o-Y 2016 2015 Y-o-Y Dec. Dec. Jan.-Dec. Jan.-Dec. PC 624,837 655,551 -4.7% 7,105,162 7,731,429 -8.1% Light Trucks 1,065,592 984,135 8.3% 10,445,189 9,748,040 7.2% Total 1,690,429 1,639,686 3.1% 17...
Automotive Sales Data Updated at: 2017/01/05
Australia - Flash report, Sales volume, 2016
re recently released data and detailed information in the database do not match up for reasons including different information sources, and discrepancies between preliminary reports and confirmed data. New vehicle sales by type Type Dec. 2016 Dec. 2015 Y-o-Y Jan.-Dec. 2016 Jan.-Dec. 2015 Y-o-Y PC 42,385 44,172 -4.0% 486,257 515,683 -5.7% SUV 34,936 35,439 -1.4% 441,017 408,471 8.0% LCV 18,378 16,935 8.5% 217,750 199,070 9.4% HCV 3,064 ...
Automotive Sales Data Updated at: 2017/01/05
China - Flash report, Sales volume, 2015
flash report may from time to time differ from data in the detail report to be announced at a later date due to a difference in the data source. Production and Sales* of new Vehicles (Provisional Figures) Production(Units(10,000)) Sales*(Units(10,000)) 2015 Total 2450.33 3.3% 2459.76 4.7% PC 2107.94 5.8% 2114.63 7.3% CV 342.39 -10.0% 345.13 -9.0% Source:CAAM*Factory shipmentsNew vehicle sales by type (Factory shipments) Dec. 20...
Automotive Sales Data Updated at: 2016/07/06
China - Flash report, Sales volume, 2013
ber 2013 6 Jan. 2014 *Data in the flash report may from time to time differ from data in the detail report to be announced at a later date due to a difference in the data source. New vehicle sales by type Dec. 2013 Jan.-Dec. 2013 Units(10,000) Share(%) Y-oY(%) Units(10,000) Share(%) Y-oY(%) PC 117.56 55.1 17.8 1,200.97 54.6 11.8 MPV 16.11 7.5 291.0 130.52 5.9 164.5 SUV 31.48 14.8 52.0 298.88 13.6 49.4 Mini Van 12.55 5.9 -42.1 162.52...
Automotive Sales Data Updated at: 2016/05/02
China - Flash report, Sales volume, 2014
*Data in the flash report may from time to time differ from data in the detail report to be announced at a later date due to a difference in the data source. New vehicle sales by type (Factory shipments) Dec. 2014 Jan.-Dec. 2014 Units(10,000) Share(%) Y-oY(%) Units(10,000) Share(%) Y-oY(%) PC 126.30 52.4 7.4 1,237.67 52.7 3.1 MPV 21.45 8.9 33.3 191.43 8.1 46.8 SUV 49.16 20.4 56.2 407.79 17.4 36.4 Mini Van 9.20 3.8 -26.7 133.17 5.7 ...
Automotive Sales Data Updated at: 2016/05/02
Australia - Flash report, Sales volume, 2013
Flash report, December 2013 7 Jan. 2014 *Data in the flash report may from time to time differ from data in the detail report to be announced at a later date due to a difference in the data source. New vehicle sales by type Type Dec. 2013 Dec. 2012 Y-o-Y Jan.-Dec.2013 Jan.-Dec.2012 Y-o-Y PC 47,686 50,496 -5.6% 566,454 575,427 -1.6% SUV 28,543 25,670 11.2% 333,511 307,253 8.5% LCV 17,809 16,439 8.3% 20...
Automotive Sales Data Updated at: 2016/05/02
Indonesia - Flash report, Sales volume, 2013
ck up/Truck 28,599 25,935 10.3% 56,491 50,082 12.8% Double Cabin 4X2/4X4 1,589 716 121.9% 3,452 1,589 117.2% Mercedes-Benz * - 431 - - 637 - Smart * - 3 - - 10 - Total 103,269 86,407 19.5% 199,974 162,772 22.9% Source:GAIKINDO * For 2012, Mercedes-Benz and Smart data reported by TOTAL (PC & CV only). Flash report, January 2013 7 Mar. 2013 *Data in the flash report may from time to time differ from data in the detail report to be an...
Automotive Sales Data Updated at: 2016/05/02
Brazil - Flash report, Sales volume, 2015
8 Jan. 2016 *Data in the flash report may from time to time differ from data in the detail report to be announced at a later date due to a difference in the data source. Automobile production, sales, export units Type Dec. 2015 Dec. 2014 Y-o-Y Jan.-Dec. 2015 Jan.-Dec. 2014 Y-o-Y Registration PC 193,240 302,999 -36.2% 2,122,956 2,794,687 -24.0% LCV 27,605 51,025 -45.9% 357,573 538,792 -33.6% Trucks 5,618 13,688 -59.0% 71,655 137,059 -47...
Automotive Sales Data Updated at: 2016/04/28
USA - Flash report, Sales volume, 2015
imler sales were up 1.7%. Volvo sales were up an astounding 89.9% from December last year, based on the strength of their SUV sales, while Land Rover contributed mightily to JLR's 29.6% increase.Sales of new vehicles by type Type 2015 2014 Y-o-Y 2015 2014 Y-o-Y Dec. Dec. Jan.-Dec. Jan.-Dec. PC 656,261 678,154 -3.2% 7,740,912 7,918,601 -2.2% Light Trucks 987,028 829,185 19.0% 9,729,587 8,603,399 13.1% Total 1,643,289 1,507,339 9.0% 17,...
Automotive Sales Data Updated at: 2016/04/26


 Japan
Japan USA
USA Mexico
 Germany
 China (Shanghai)
 Thailand
 India
India