


Search Results by Category
All information related to {{ key_word }}.
AI Navigator will guide you. Click here for information about {{ key_word }}.
Images
 4
4
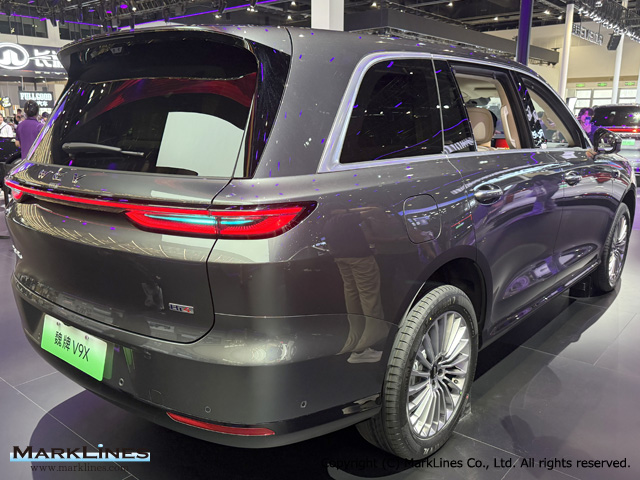
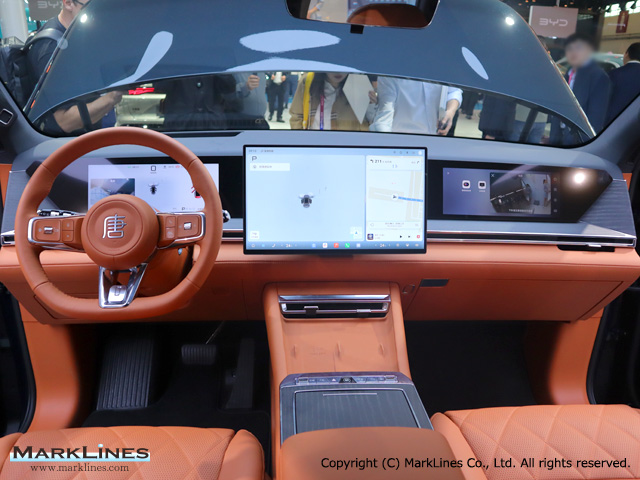
WEY V9X
 3
3
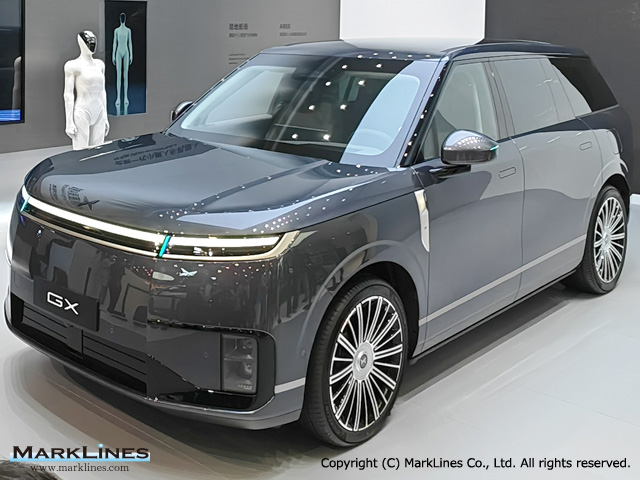
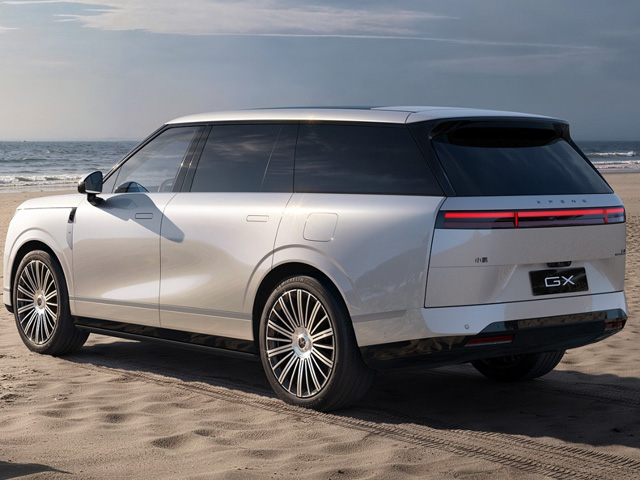
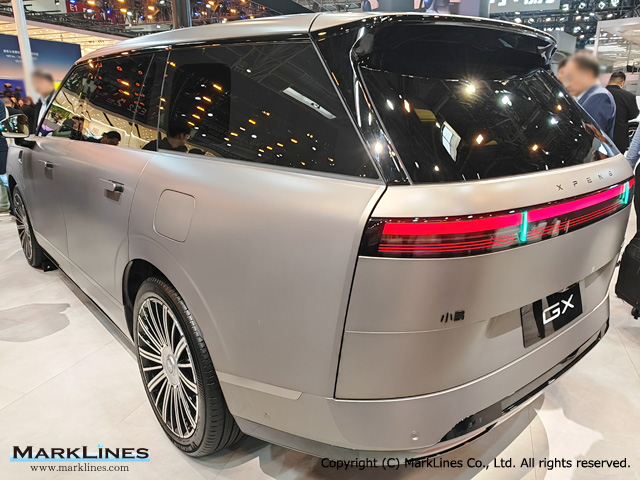
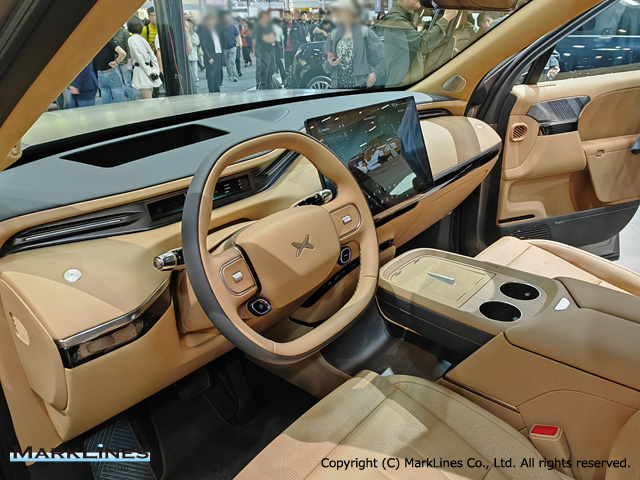
GX EREV
 4
4
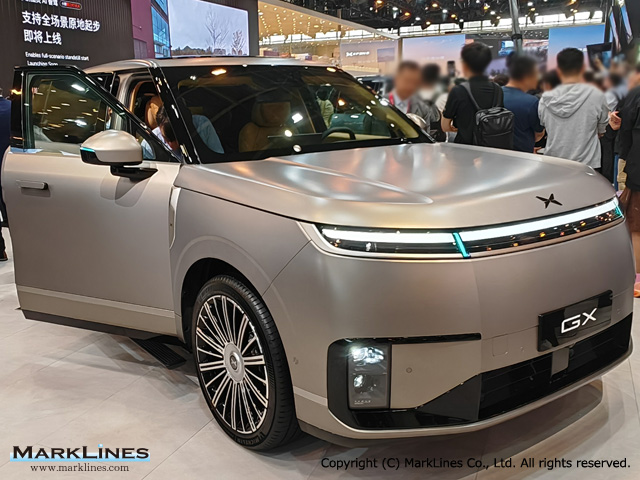
GX EV
 2
2
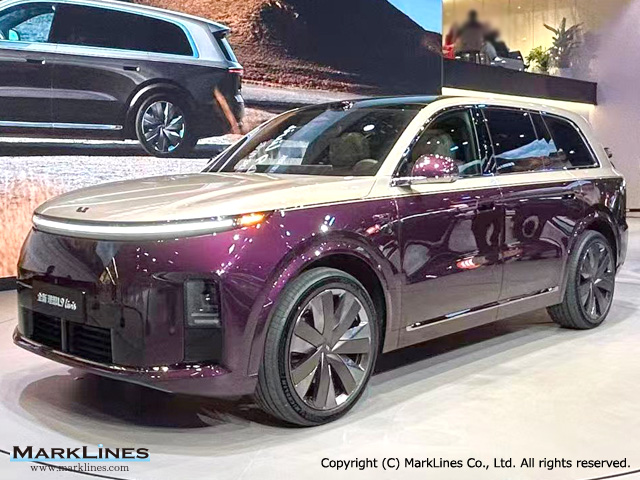
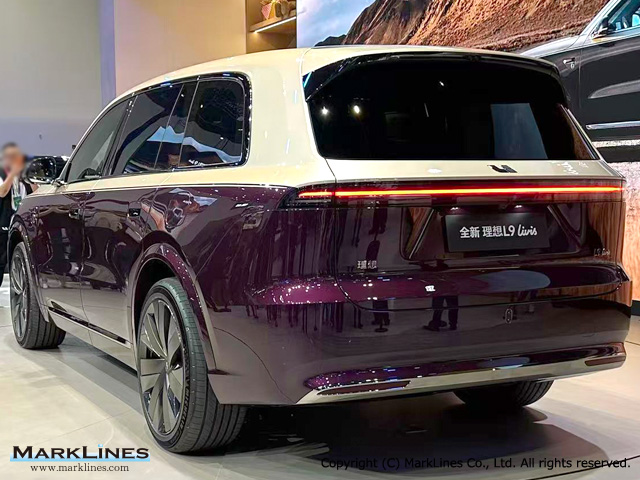
Li L9 Ultra/Livis
 3
3
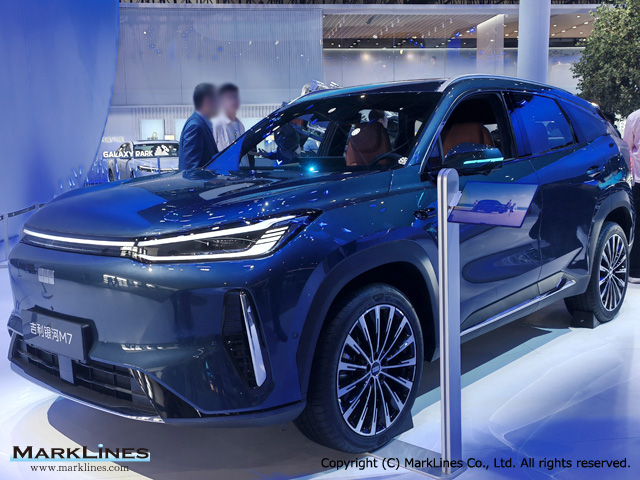
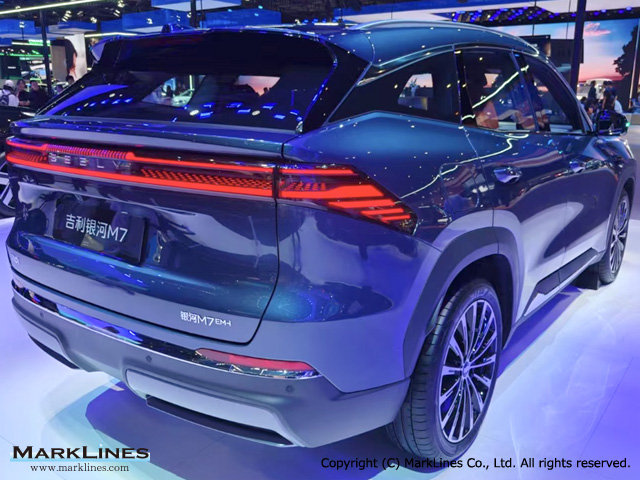
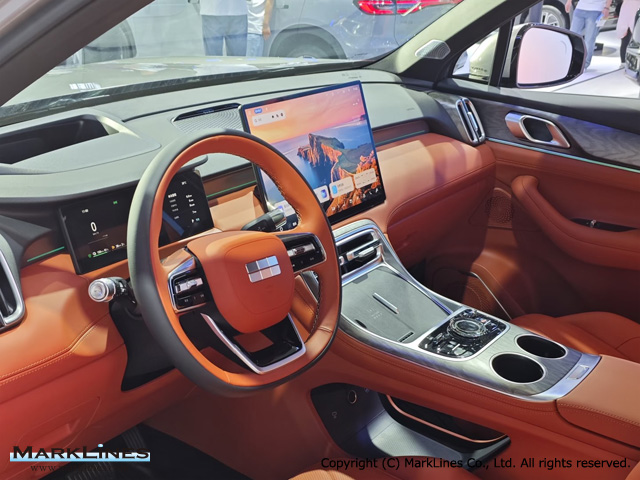
Galaxy M7
 6
6
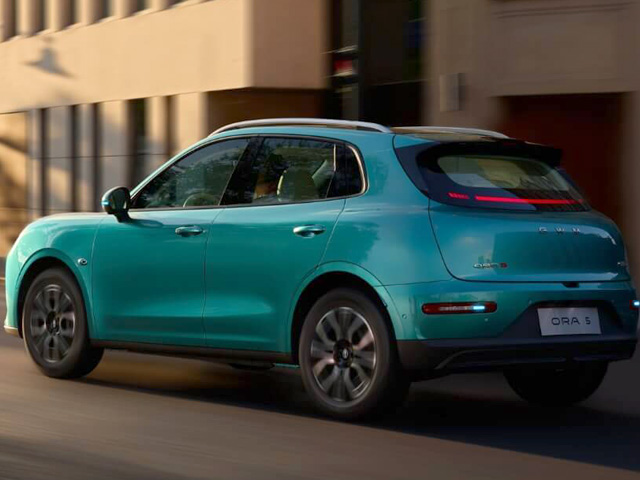
Ora 5 HEV
 3
3
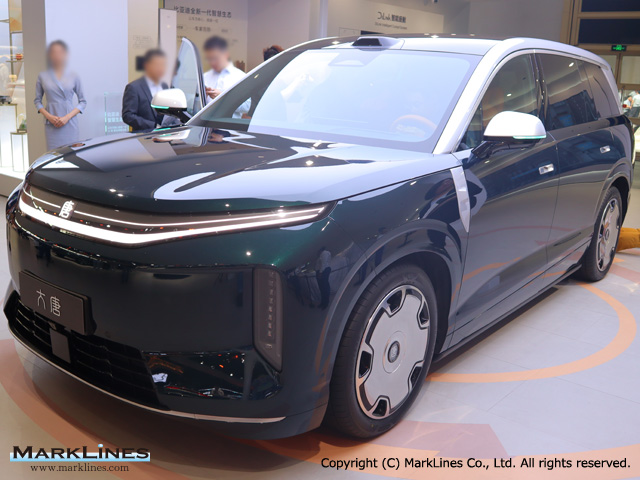
Da Tang EV
 2
2
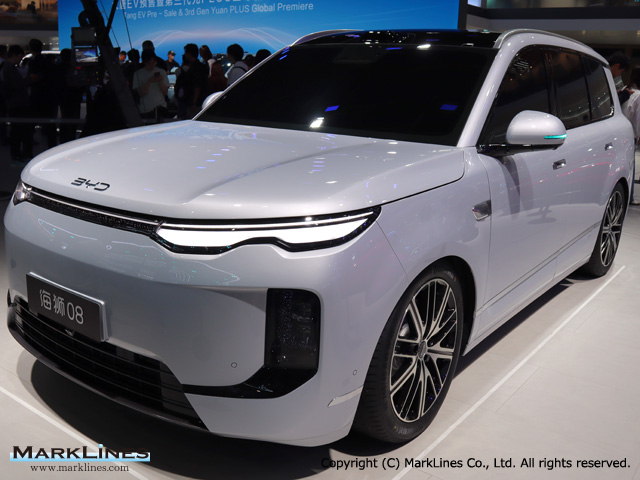
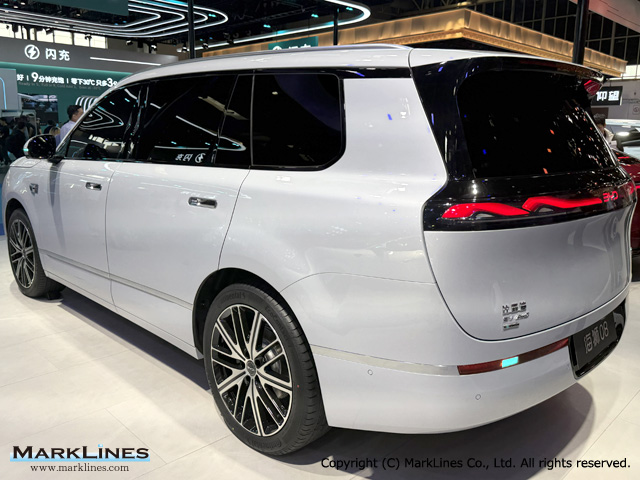
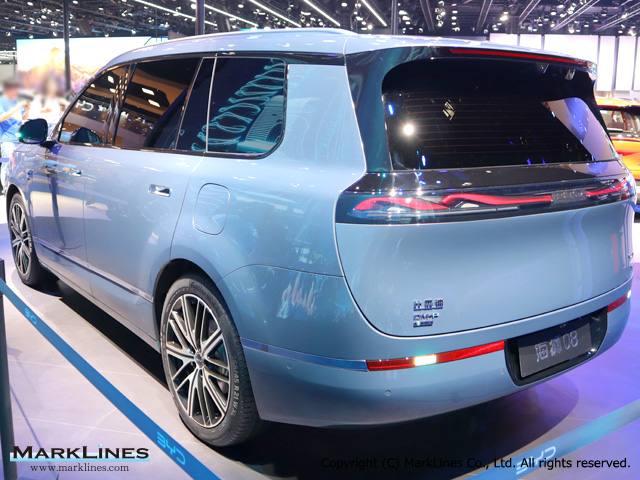
Sealion 08 EV
 3
3
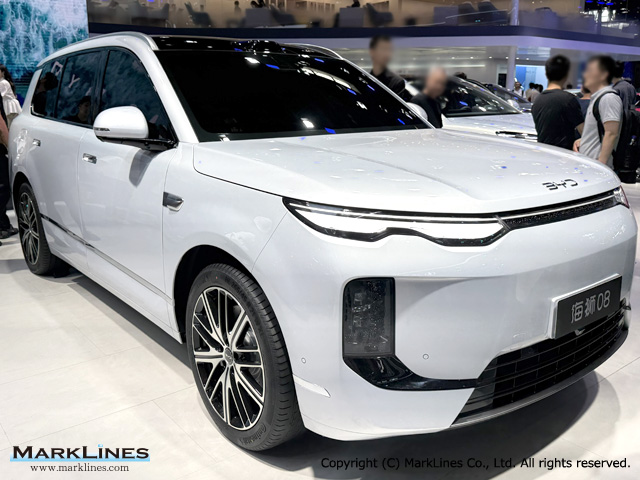
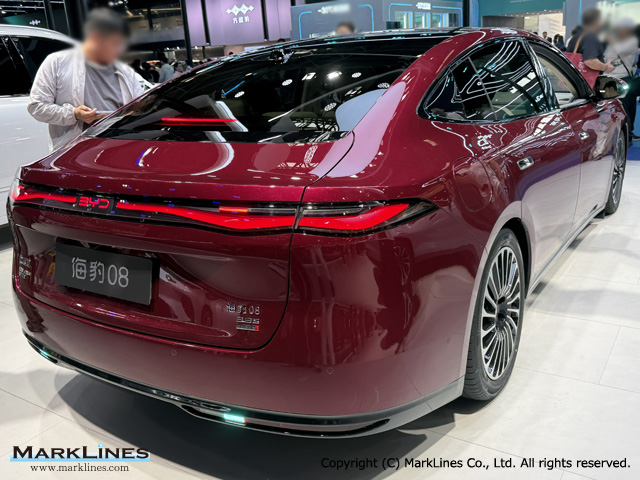
Haibao 08/Seal 08 EV
 2
2
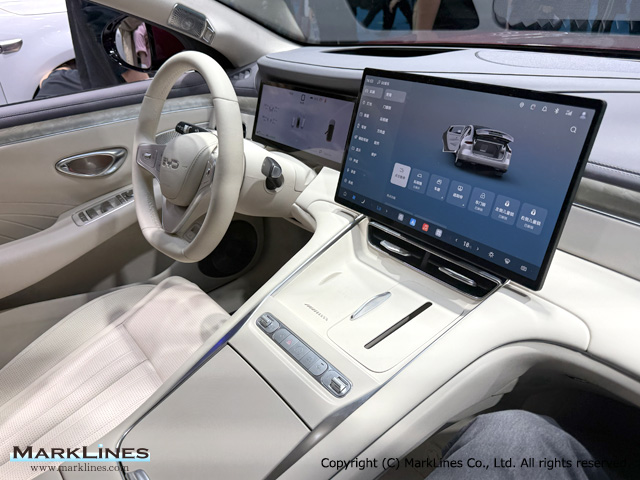
Sealion 08 DM-i/p
Sort by :
1 - 20 of 66 results
Data changes for Sales Statistics
e by model are available. February 27, 2026 IranMoroccoEcuador Starting from January 2026, monthly sales volume by model are available. February 27, 2026 Peru Starting from January 2026, passenger vehicle sales figures will be changed from OEM-based data to model-based data. February 13, 2026 China The number of commercial vehicles for January 2026 has been updated by OEM. February 12, 2026 USA Sales figures of Tesla in January 2026 have ...
Automotive Sales Data Updated at: 2026/05/22
China - New car sales in 2026 by OEM, model, vehicle type
China - New car sales in 2026 by OEM, model, vehicle type Flash report, Automotive sales volume, 2026 Jan. Feb. Mar. Apr. May Jun. Jul. Aug. Sep. Oct. Nov. Dec. Flash report, April 2026 May 11, 2026 *There are cases where recently released data and detailed information in the database do not match up for reasons including different information sources, and discrepancies between preliminary reports and confirmed data.China’s April vehicle produ...
Automotive Sales Data Updated at: 2026/05/15
Taiwan - New car sales in 2026 by OEM, vehicle type
irmed data. Taiwan - Sales of new vehicles Make Apr. 2026 Apr. 2025 Y-o-Y Passenger Cars Light Commercial Vehicles Commercial Vehicles Total Share Passenger Cars Light Commercial Vehicles Commercial Vehicles Total Share Kuozui 6,860 1,087 539 8,486 48.4% 5,578 1,407 314 7,299 43.7% 16.3% China Motor 960 2,398 0 3,358 19.2% 865 3,154 0 4,019 24.1% -16.4% Yulon 1,745 0 0 1,745 10.0% 1,418 0 0 1,418 8.5% 23.1% KGM 1,053 447 0 1,500 8....
Automotive Sales Data Updated at: 2026/05/12
Mexico - New car sales in 2026 by OEM, vehicle type
, including the normalization of supply chains amid improving semiconductor availability. In addition, vehicle lineups in the Mexican market have expanded. Meanwhile, on January 1, the Mexican government significantly raised tariffs on imported vehicles and auto parts from non-FTA countries such as China. Developments in U.S. trade policy will continue to warrant close monitoring going forward.Sales of new vehicles by type(including import cars) ...
Automotive Sales Data Updated at: 2026/05/12
Monthly Sales by Major Automakers and Groups, 2026
% - - -% - - -% 10 Honda 226.2 3.4% Geely 221.1 3.6% Geely 270.3 3.3% - - -% - - -% - - -% - - -% - - -% - - -% - - -% - - -% - - -% Source: MarkLines Data Center *Includes some estimated figures. *The sales volume (shipment volume) for China are aggregate figures excluding exports and including imports. *Values may differ from those announced by automaker. *Volume data may be revised...
Automotive Sales Data Updated at: 2026/05/11
Australia - New car sales in 2026 by OEM, vehicle type
ports and confirmed data. Australian new vehicle sales decrease 4.5% in FebruaryOn March 4, the Federal Chamber of Automotive Industries announced that new vehicle registrations of 90,712 units in February 2026 represented a 4.5% decrease from February 2025. Of these, sales of vehicles sourced from China amounted to 22,362 units, surpassing Japan for the first time in 28 years in a single month. Japan had been Australia’s leading source of vehi...
Automotive Sales Data Updated at: 2026/05/07
Representative models for each segment
Representative models for each segment Home Representative models for each segment Representative models for each segment These are typical models included in each segment. (Refer to sales volume in 2025) Segment Representative models North America Europe China Japan Other Sedan/Hatchback A (Basic) Fiat 500, JAC E10X, Auteco D2S Fiat Panda, Hyundai i10, Kia Morning BYD Seagull, Wuling Hongguang MINIEV, Changan Lumin Honda N-BOX, Su...
Automotive Sales Data Updated at: 2026/03/10
Monthly Sales by Major Automakers and Groups, 2025
uki 245.7 3.4% Nissan 243.9 3.3% Nissan 242.1 3.2% Nissan 253.4 3.4% Nissan 239.2 3.3% SAIC 269.2 3.3% Honda 291.1 3.6% Suzuki 281.7 3.5% Suzuki 288.3 3.5% Source: MarkLines Data Center *Includes some estimated figures. *The sales volume (shipment volume) for China are aggregate figures excluding exports and including imports. *Values may differ from those announced by automaker. *Volume data may be revised...
Automotive Sales Data Updated at: 2026/03/10
Taiwan - New car sales in 2025 by OEM, vehicle type
25 Dec. 2024 Y-o-Y Passenger Cars Light Commercial Vehicles Commercial Vehicles Total Share Passenger Cars Light Commercial Vehicles Commercial Vehicles Total Share Kuozui 5,942 859 160 6,961 44.9% 5,197 885 231 6,313 43.1% 10.3% Taiwan Honda 3,192 0 0 3,192 20.6% 2,979 0 0 2,979 20.3% 7.2% China Motor 759 2,040 0 2,799 18.1% 801 1,725 0 2,526 17.2% 10.8% KGM 1,107 251 0 1,358 8.8% 1,059 476 0 1,535 10.5% -11.5% Yulon 1,152 0 0 1,152 ...
Automotive Sales Data Updated at: 2026/02/12
China - New car sales in 2025 by OEM, model, vehicle type
China - New car sales in 2025 by OEM, model, vehicle type Flash report, Automotive sales volume, 2025 Jan. Feb. Mar. Apr. May Jun. Jul. Aug. Sep. Oct. Nov. Dec. Flash report, December 2025 Jan 9, 2026 *There are cases where recently released data and detailed information in the database do not match up for reasons including different information sources, and discrepancies between preliminary reports and confirmed data.China’s December vehicle ...
Automotive Sales Data Updated at: 2026/02/10
Australia - New car sales in 2025 by OEM, vehicle type
cutive Tony Weber said that in Australia, with more than 100 BEVs and more than 50 PHEVs available, manufacturers have worked hard to provide Australians with high-quality electric vehicles. What is needed now is a stronger focus on encouraging demand, in particular public recharging infrastructure.China’s rise as a source of new cars continued in September. In addition, China accounts for 77.5 per cent of all battery electric vehicle (BEV) sal...
Automotive Sales Data Updated at: 2026/02/04
USA - New car sales in 2025 by OEM, model, vehicle type
7,500 federal EV purchase tax credit at the end of September. Additionally, as tariffed vehicles gradually replace non-tariffed inventories, prices have been rising and sales have slowed. Furthermore, some OEMs faced production and sales disruptions from the global semiconductor shortage linked to China-backed Dutch chipmaker Nexperia, as well as a fire at Novelis’s New York plant, which constrained aluminum supplies.By vehicle type, November ...
Automotive Sales Data Updated at: 2026/02/04
Volume data search results
olet Silverado HV is available to search by monthly and annualy. Uruguay Not Available Not Available Not Available Chile Not Available Not Available Not Available Area/Country (The country which does not sell the EV/HV/PHV/FCV model is also included.) 2019 2020 2021~ Note Asia/Oceania China (Factory shipment) All EV/HV/PHV/FCV models (A+B) All EV/HV/PHV/FCV models (A+B) All EV/HV/PHV/FCV models (A+B) - Data cover local factory shipm...
Automotive Sales Data Updated at: 2025/12/09
Thailand - New car sales in 2024 by OEM, model, vehicle type
s, down 10.0% YoY. Exports to almost every country which are Thailand trading partners posted a YoY drop, excluding the North American market. The FTI said this YoY drop was attributable to the high base level in the same period in 2023, the Israel-Hamas conflict escalation disrupting shipping, and China’s economic slowdown. The vehicle export value in November was THB 58.0 billion, down 11.6% year over year. Vehicle exports in the first 11 mon...
Automotive Sales Data Updated at: 2025/07/03
Taiwan - New car sales in 2024 by OEM, vehicle type
ec. 2023 Y-o-Y Passenger Cars Light Commercial Vehicles Commercial Vehicles Total Share Passenger Cars Light Commercial Vehicles Commercial Vehicles Total Share Kuozui 5,197 885 231 6,313 48.1% 7,656 1,920 47 9,623 51.4% -34.4% Taiwan Honda 2,979 0 0 2,979 22.7% 3,418 0 0 3,418 18.3% -12.8% China Motor 801 1,725 0 2,526 19.2% 2,086 1,529 0 3,615 19.3% -30.1% Ford Lio Ho 295 385 0 680 5.2% 297 203 0 500 2.7% 36.0% Yulon 549 0 0 549 4.2...
Automotive Sales Data Updated at: 2025/07/03
Malaysia - New car sales in 2024 by vehicle type
he Overnight Policy Rate (OPR), which has remained at 3% since May 2023, the introduction of new models, and aggressive sales promotions by OEMs.In 2025, sales are forecast to decline 4.5% to 780,000 units, and while the Malaysian economy is expected to remain strong in 2025, the impact of the U.S.-China trade conflict and a review of petrol subsidies in mid-2025 are cited as downside risks. Malaysia - Sales and Production of new Vehicles Type...
Automotive Sales Data Updated at: 2025/07/02
China - New car sales in 2024 by OEM, model, vehicle type
China - New car sales in 2024 by OEM, model, vehicle type Flash report, Automotive sales volume, 2024 Jan. Feb. Mar. Apr. May Jun. Jul. Aug. Sep. Oct. Nov. Dec. Flash report, December 2024 Jan 14, 2025 *There are cases where recently released data and detailed information in the database do not match up for reasons including different information sources, and discrepancies between preliminary reports and confirmed data.China’s December vehicle...
Automotive Sales Data Updated at: 2025/07/02
Australia - Flash report, Automotive sales volume, 2023
d a 27.5 % increase, LCV sales of 19,244 units represented a 4.0 % decrease and MHCV sales of 3,456 units represented a 5.8 % decrease.Sales of zero and low emission vehicles continued to grow with 17.9 % being battery electric, hybrid or plug-in hybrid models. EVs accounted for 7.0 % of July sales.China continues to grow in importance as a country of origin with an increase of 130.1 % YoY to 15,853 units.Among the companies, Toyota sales decreas...
Automotive Sales Data Updated at: 2025/06/04
Taiwan - Flash report, Automotive sales volume, 2023
ec. 2022 Y-o-Y Passenger Cars Light Commercial Vehicles Commercial Vehicles Total Share Passenger Cars Light Commercial Vehicles Commercial Vehicles Total Share Kuozui 7,656 1,920 47 9,623 53.2% 6,276 1,261 540 8,077 46.8% 19.1% Taiwan Honda 3,418 0 0 3,418 18.9% 2,439 0 0 2,439 14.1% 40.1% China Motor 2,086 878 0 2,964 16.4% 608 1,639 0 2,247 13.0% 31.9% Sangyang 779 242 0 1,021 5.6% 512 220 0 732 4.2% 39.5% Yulon 540 0 0 540 3.0% 1,...
Automotive Sales Data Updated at: 2025/06/04
China - Flash report, Automotive sales volume, 2023
China - Flash report, Automotive sales volume, 2023 Flash report, Automotive sales volume, 2023 Jan. Feb. Mar. Apr. May Jun. Jul. Aug. Sep. Oct. Nov. Dec. Flash report, December 2023 Jan 11, 2024 *There are cases where recently released data and detailed information in the database do not match up for reasons including different information sources, and discrepancies between preliminary reports and confirmed data. China’s vehicle production an...
Automotive Sales Data Updated at: 2025/06/04

 Japan
Japan USA
USA Mexico
 Germany
 China (Shanghai)
 Thailand
 India
India