


Search Results by Category
All information related to {{ key_word }}.
AI Navigator will guide you. Click here for information about {{ key_word }}.
Images
 3
3
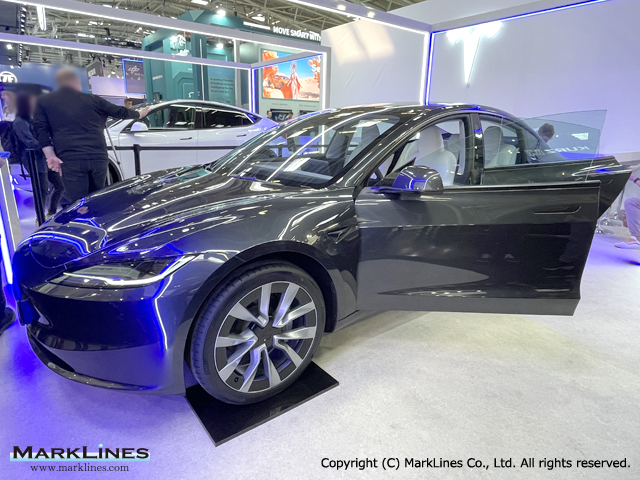
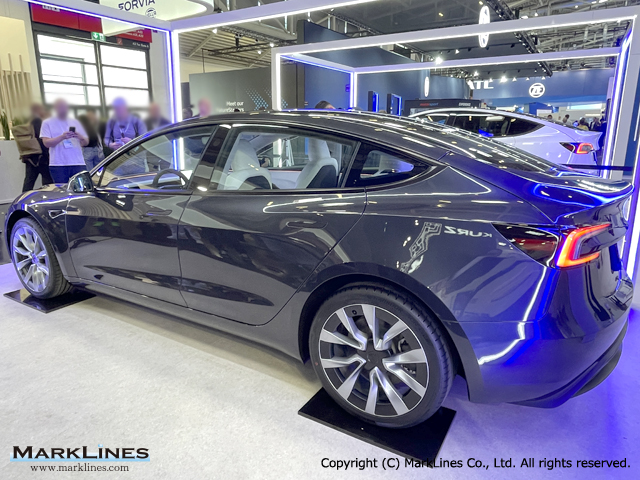
Model 3
 1
1
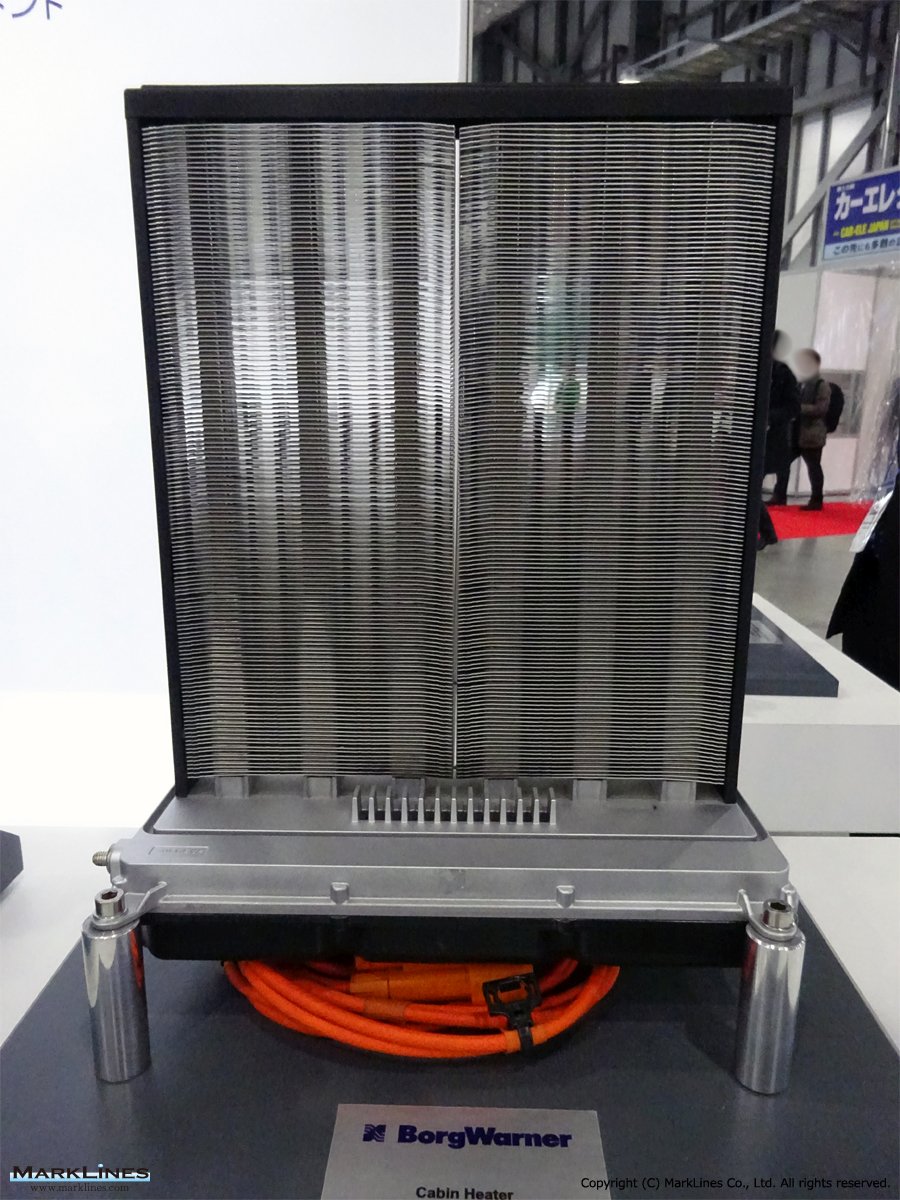
Cabin heater
 2
2
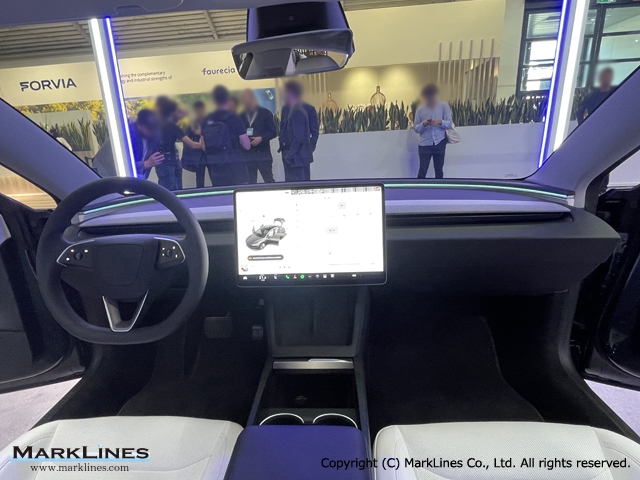
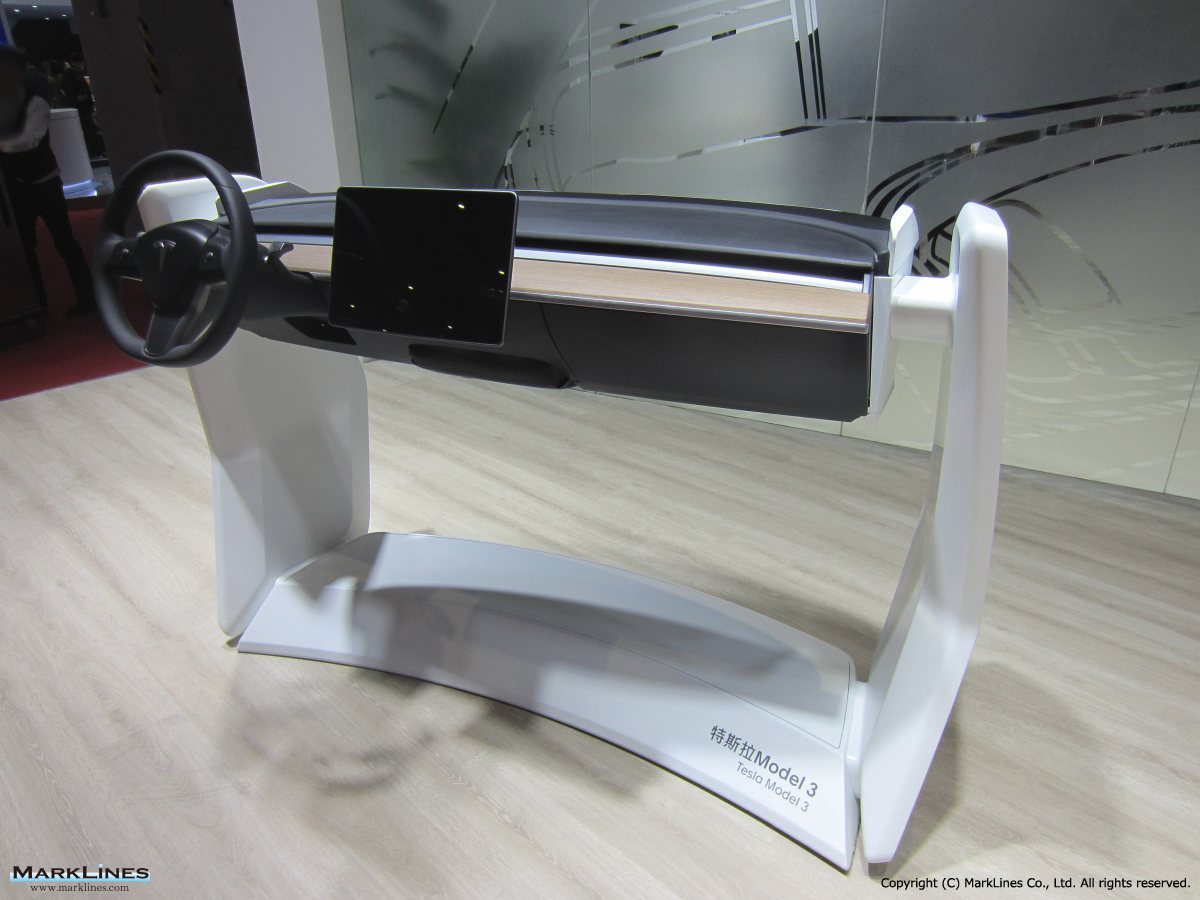
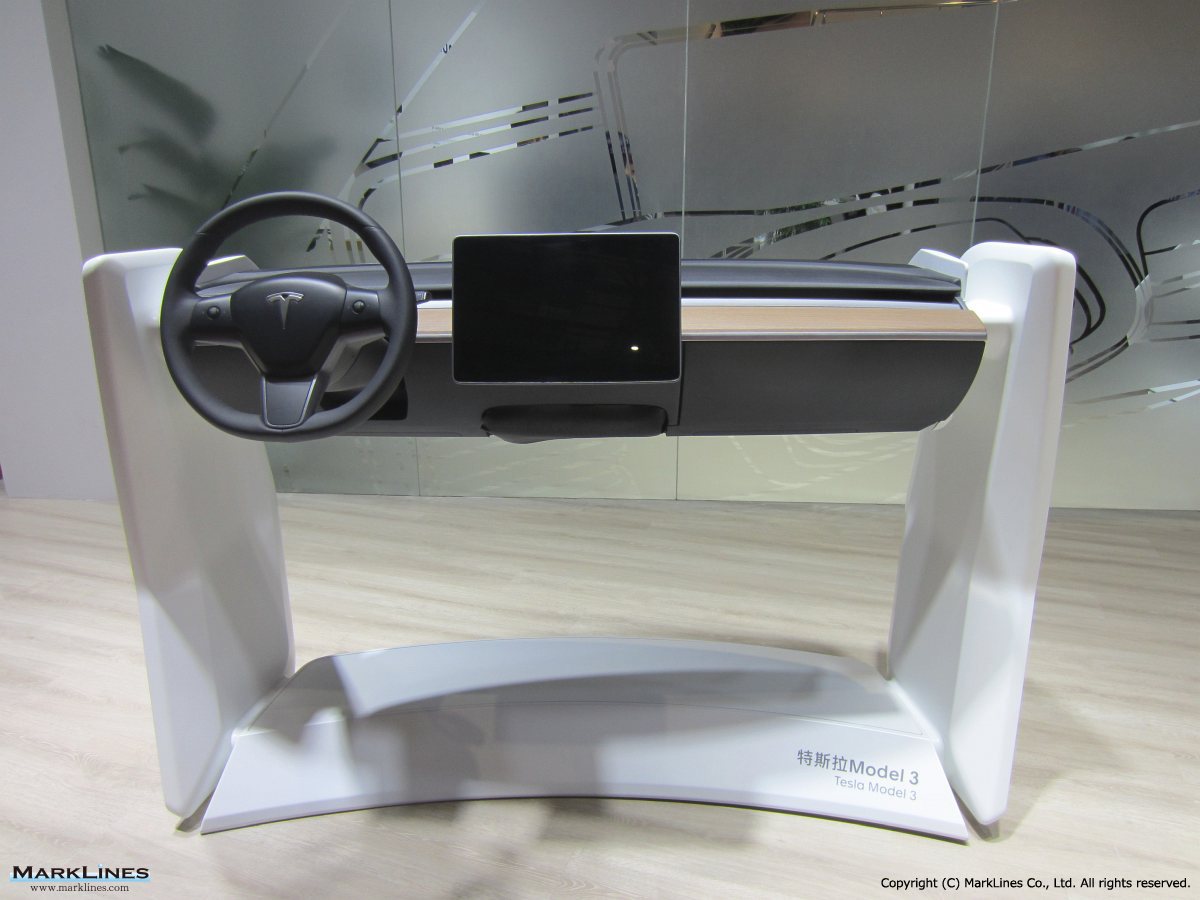
Instrument panel
 3
3
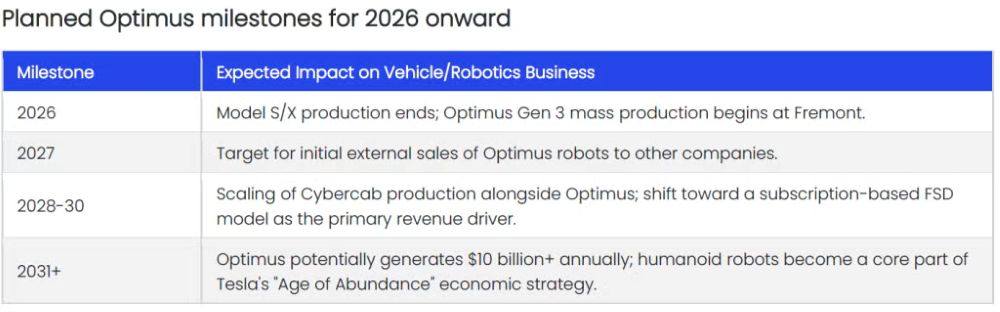
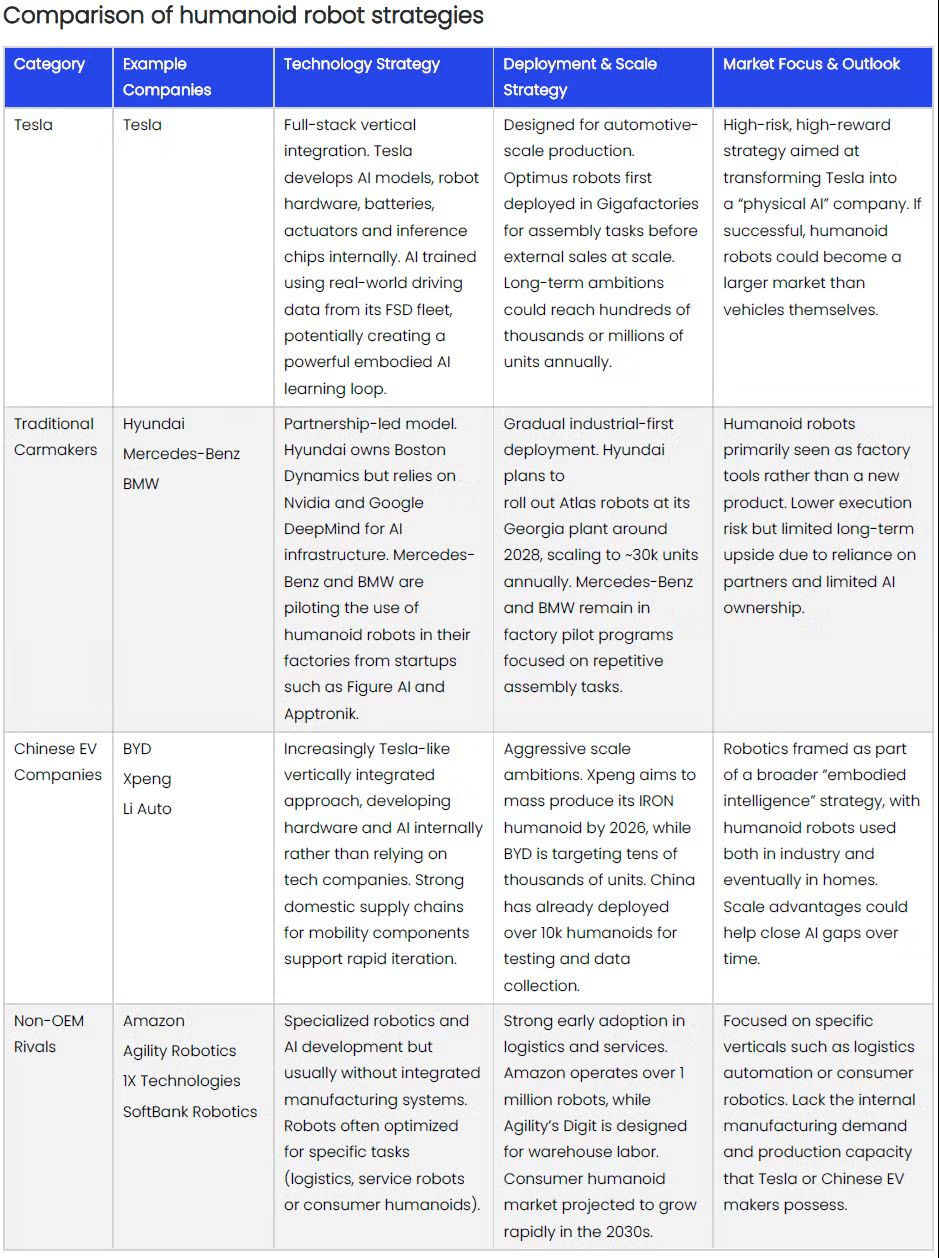
GlobalData blog: How is Tesla’s pivot to robotics and AI likely to affect it going forward?
 1
1
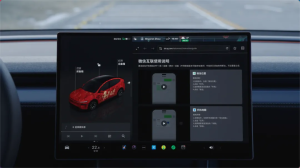
Tesla teams up with Tencent to enhance cockpit experience, launching WeChat Link and Destination Service
 1
1
Tesla previews 15% drop in upcoming Q4 2025 deliveries in unusual manner
 1
1
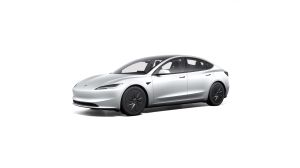
Tesla opens sales for affordable Model 3 Standard in Europe
 1
1
Thai government - Tesla discuss cooperation on EV technology, Full Self-Driving, and sustainability
 1
1
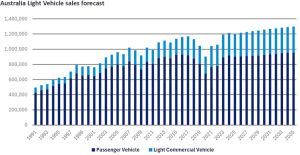
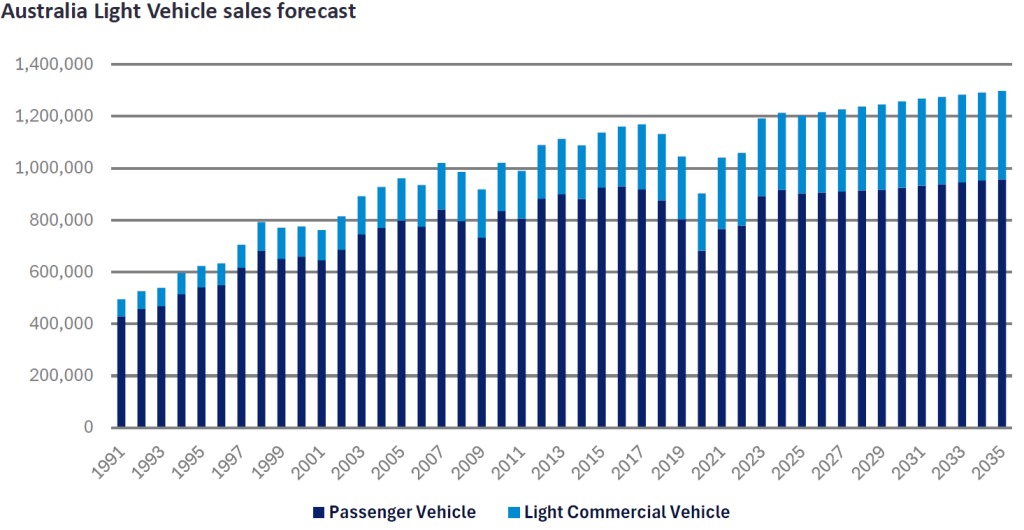
GlobalData blog: Australia: Asia’s mature market down under
 4
4
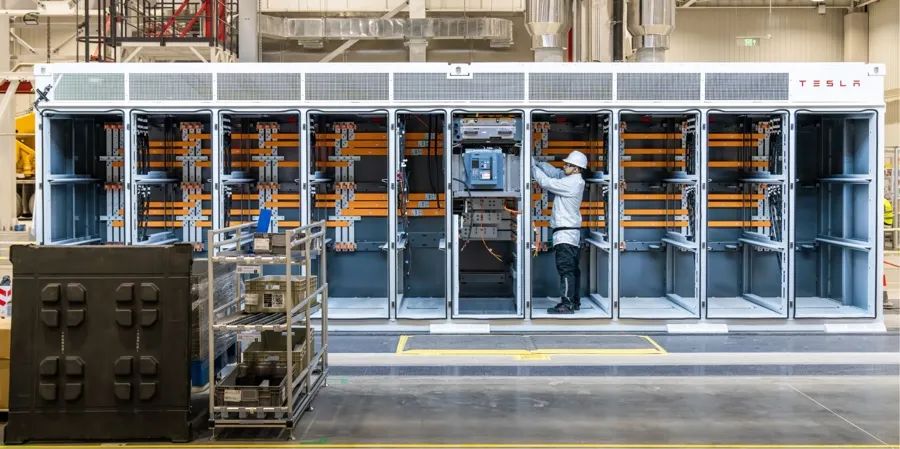
Tesla commissions Megafactory Shanghai
Sort by :
1 - 6 of 6 results
China - Automotive production in 2026 by OEM, model, vehicle type
unted for 1.625 million units and 901,000 units, down 21.6% y/y and up 74.4% y/y, respectively.Year-to-date (YTD) production and sales volumes were 9.614 million units and 9.574 million units, down 5.5% y/y and 4.8% y/y, respectively. Domestic sales and exports accounted for 6.447 million units and 3.127 million units, down 20.6% y/y and up 61.5% y/y, respectively.In April, PV production and sales volumes totaled 2.197 million units and 2.129 mil...
Automotive Production Data Updated at: 2026/05/13
China - Automotive production in 2025 by OEM, model, vehicle type
ver 50% of the domestic new vehicle sales volume and becoming the dominant force in China’s automotive market. Foreign trade demonstrated robust resilience, as exports exceeded 7 million units (including 2.615 million NEVs), a new record high.In December, vehicle production and sales volumes were 3.296 million units and 3.272 million units, down 2.1% y/y and 6.2% y/y, respectively. Year-to-date (YTD) production and sales volumes were 34.531 mil...
Automotive Production Data Updated at: 2026/02/12
China - Automotive production in 2024 by OEM, model, vehicle type
Jan 14, 2025 *There are cases where recently released data and detailed information in the database do not match up for reasons including different information sources, and discrepancies between preliminary reports and confirmed data. China’s December vehicle production, sales volumes increase 9.3% y/y, 10.5% y/y, respectivelyOn January 13, the China Association of Automobile Manufacturers (CAAM) announced China’s vehicle production and sale...
Automotive Production Data Updated at: 2025/06/04
China - Flash report, Automotive production volume, 2023
China - Flash report, Automotive production volume, 2023 Flash report, Automotive Production volume, 2023 Jan. Feb. Mar. Apr. May Jun. Jul. Aug. Sep. Oct. Nov. Dec. Flash report, December 2023 Jan 11, 2024 *There are cases where recently released data and detailed information in the database do not match up for reasons including different information sources, and discrepancies between preliminary reports and confirmed data. China’s vehicle pr...
Automotive Production Data Updated at: 2025/06/04
China - Flash report, Automotive production volume, 2022
China - Flash report, Automotive production volume, 2022 Flash report, Automotive Production volume, 2022 Jan. Feb. Mar. Apr. May Jun. Jul. Aug. Sep. Oct. Nov. Dec. Flash report, Dec 2022 Jan 12, 2023 *There are cases where recently released data and detailed information in the database do not match up for reasons including different information sources, and discrepancies between preliminary reports and confirmed data. China vehicle production a...
Automotive Production Data Updated at: 2025/06/04
China - Flash report, Automotive production volume, 2021
onth of December, 2021.From the perspective of annual performance, vehicle production and sales in 2021 registered a year-over-year (y/y) increase, putting an end to the three consecutive years of decline since 2018. New Energy Vehicle (NEV) became the brightest star, having deliveries of more than 3.5 million units, increasing its market share to 13.4%. China’s car exports delivered excellent performance, with annual exports exceeding 2 millio...
Automotive Production Data Updated at: 2025/06/04


 Japan
Japan USA
USA Mexico
 Germany
 China (Shanghai)
 Thailand
 India
India