


Search Results by Category
All information related to {{ key_word }}.
AI Navigator will guide you. Click here for information about {{ key_word }}.
Images
 3
3
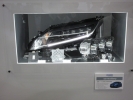
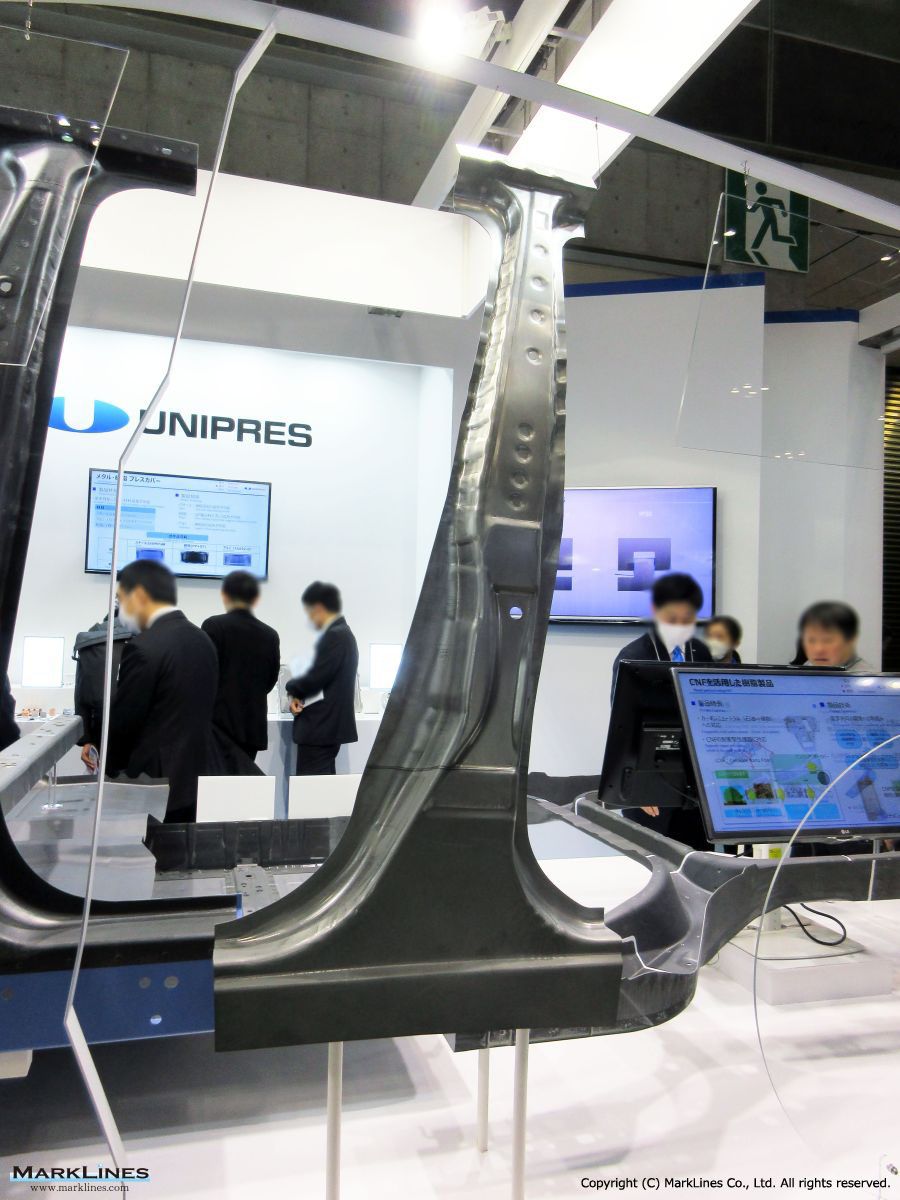
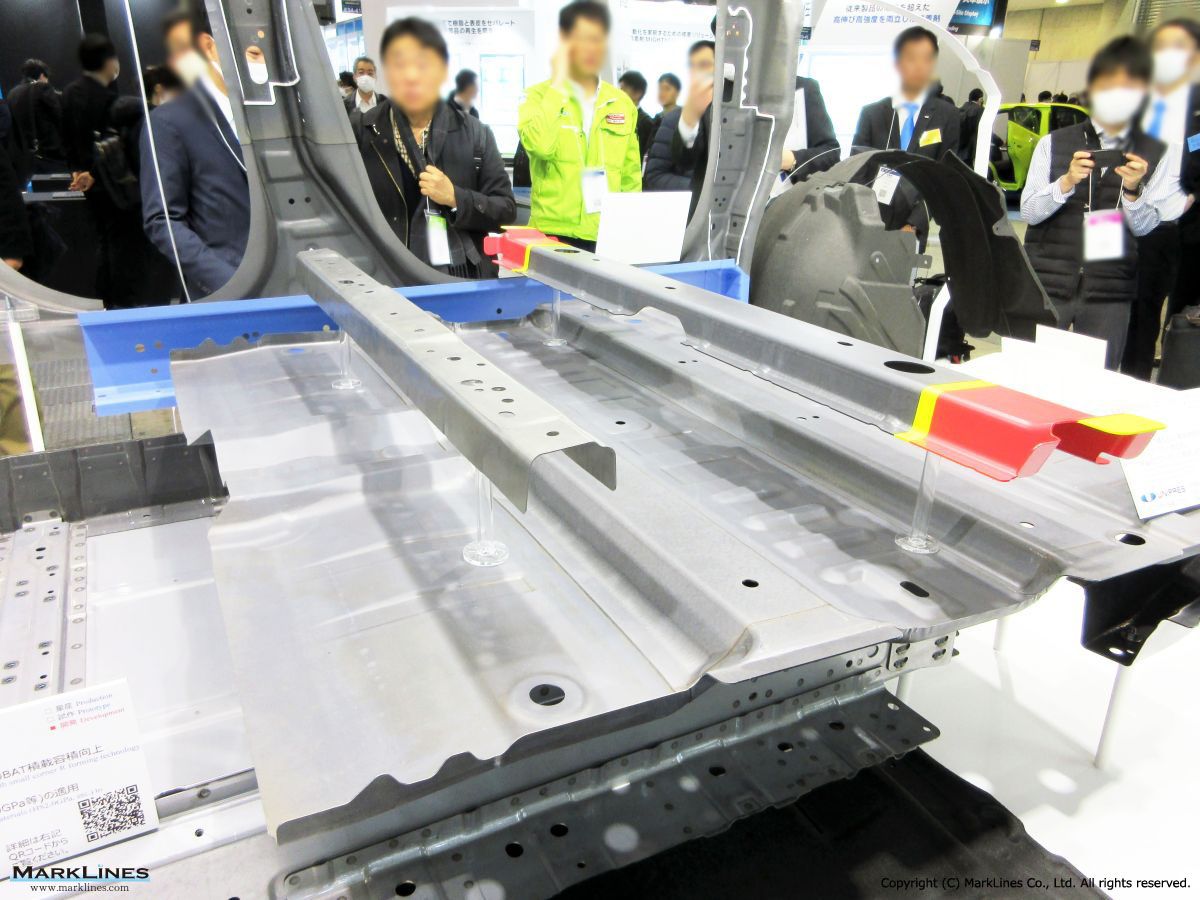
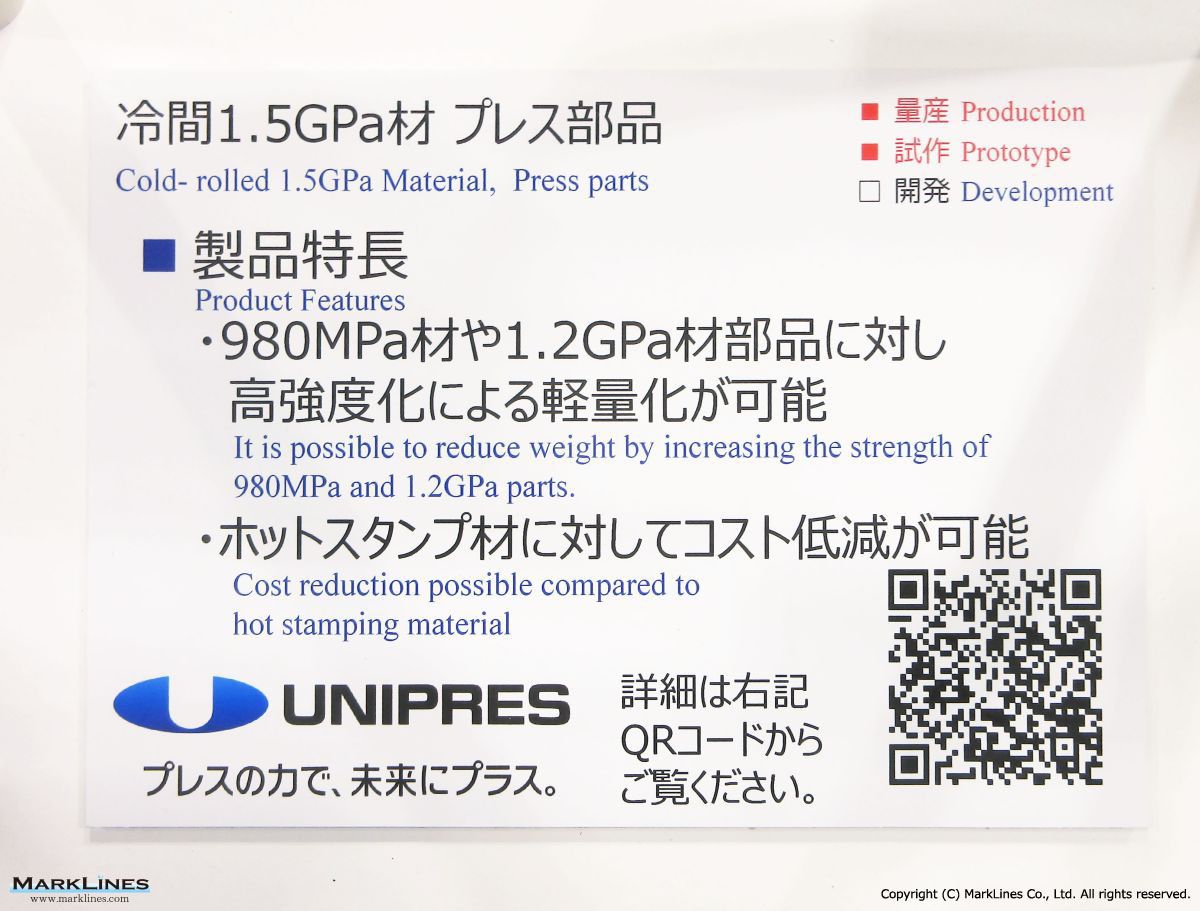
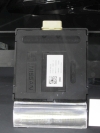
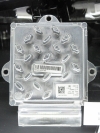
Cold-rolled 1.5GPa material, press parts
 2
2
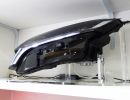
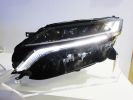
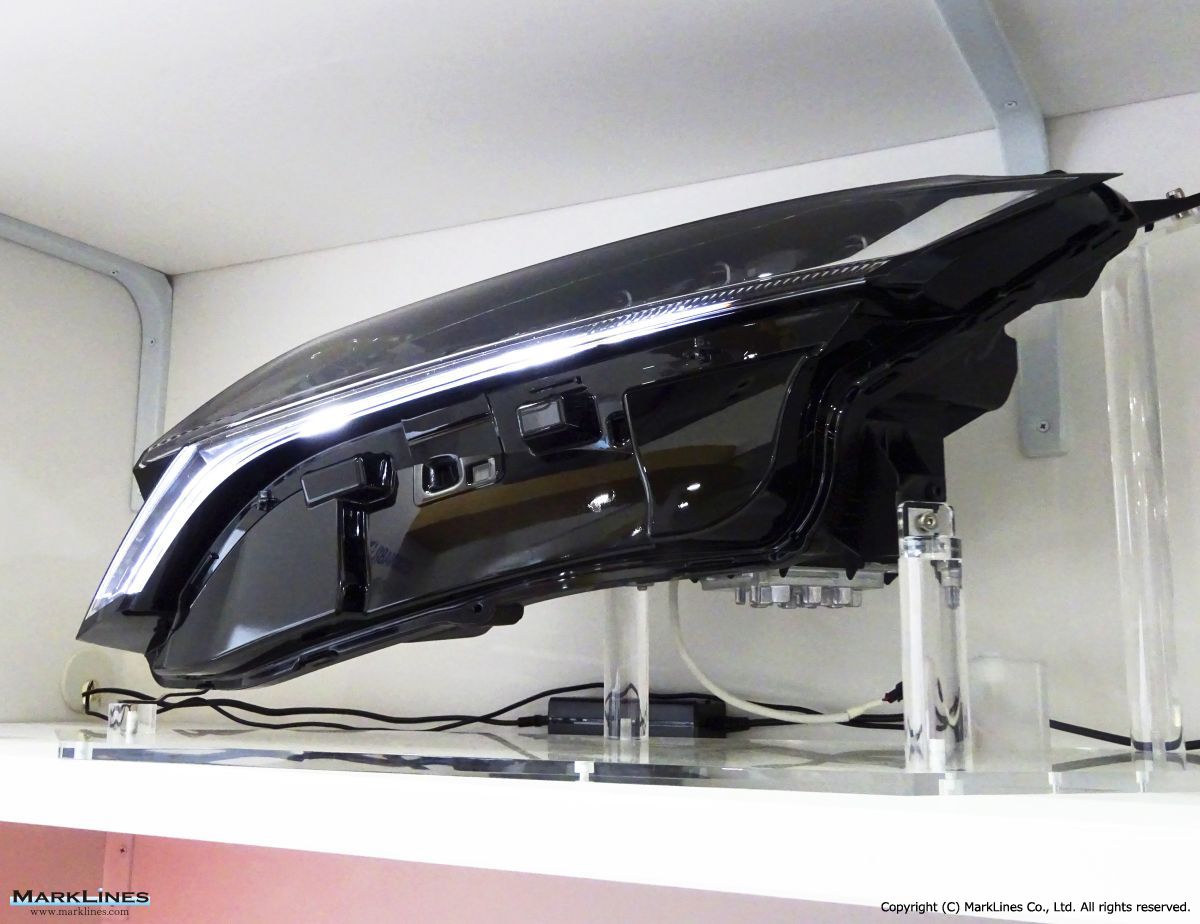
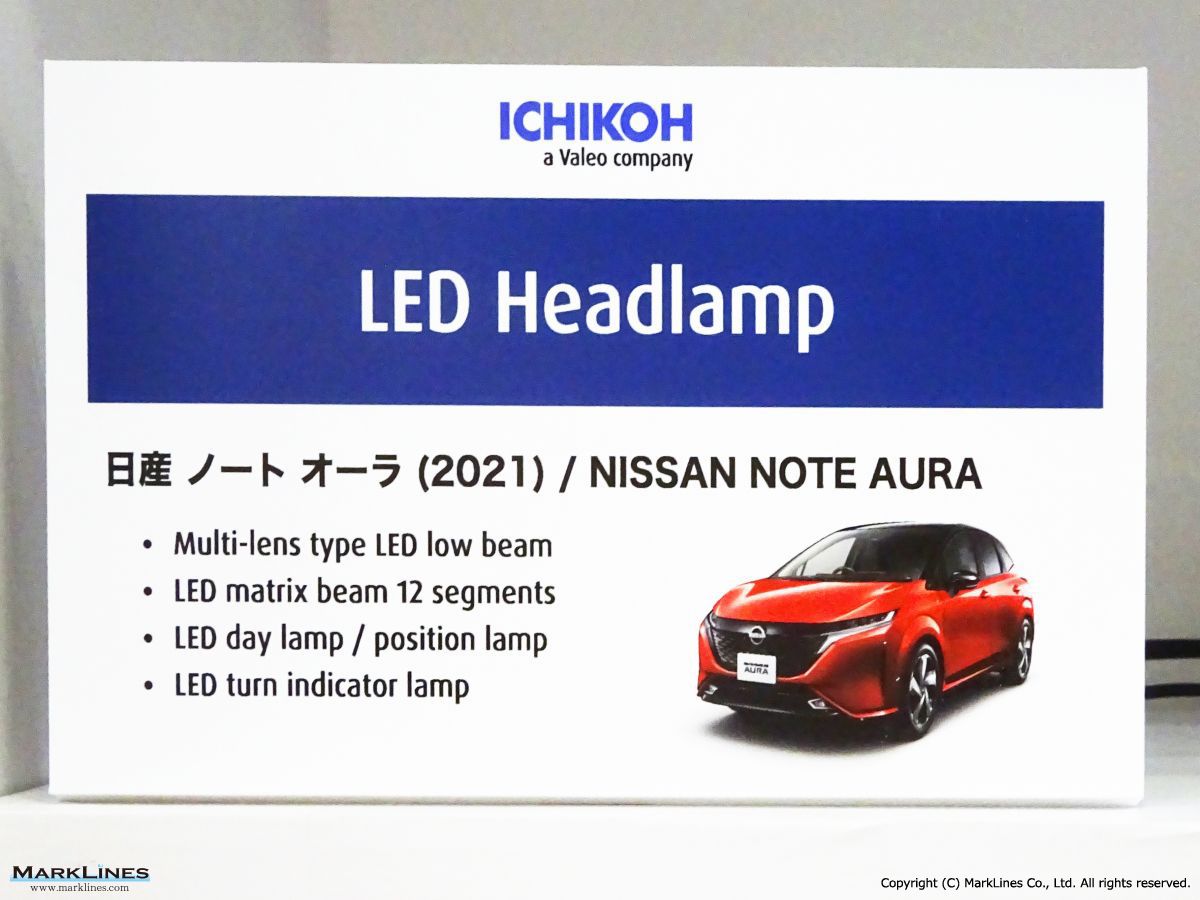
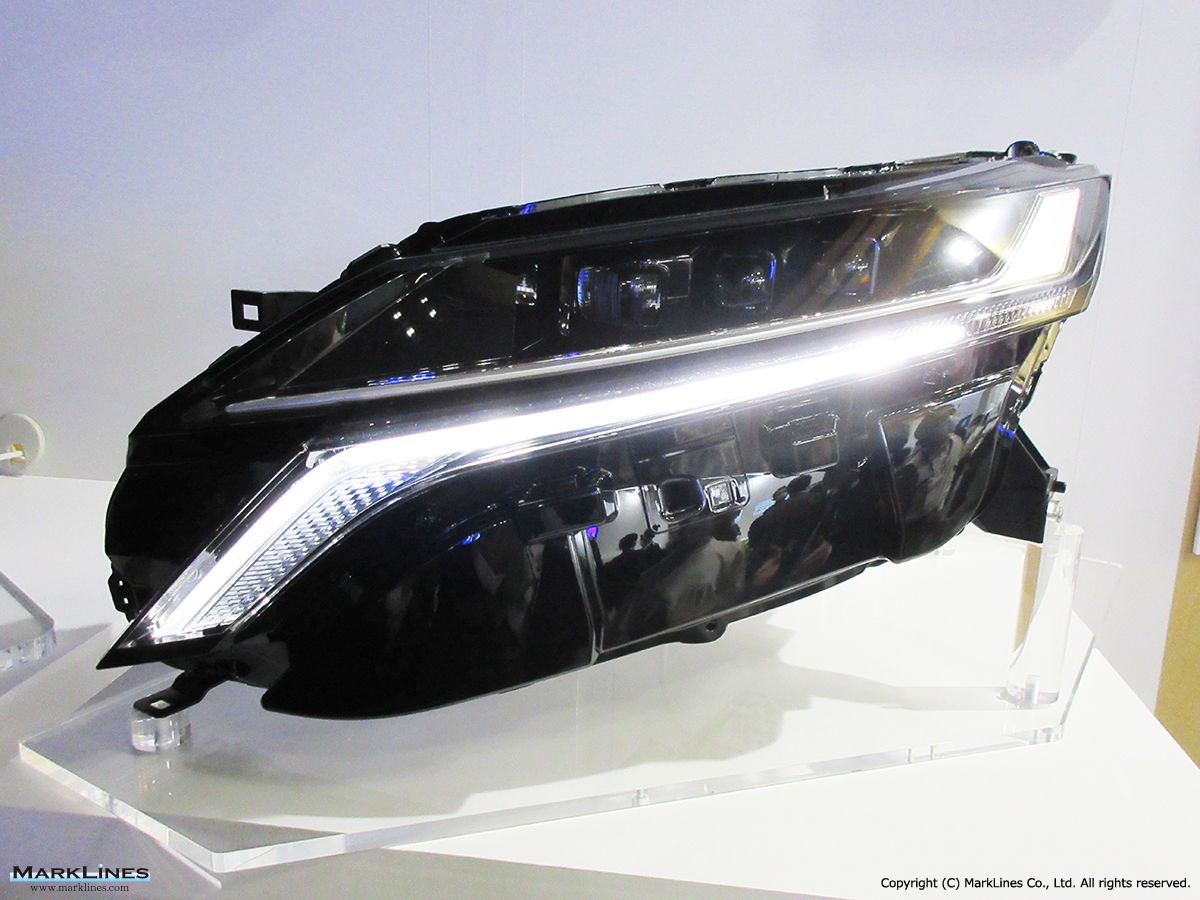
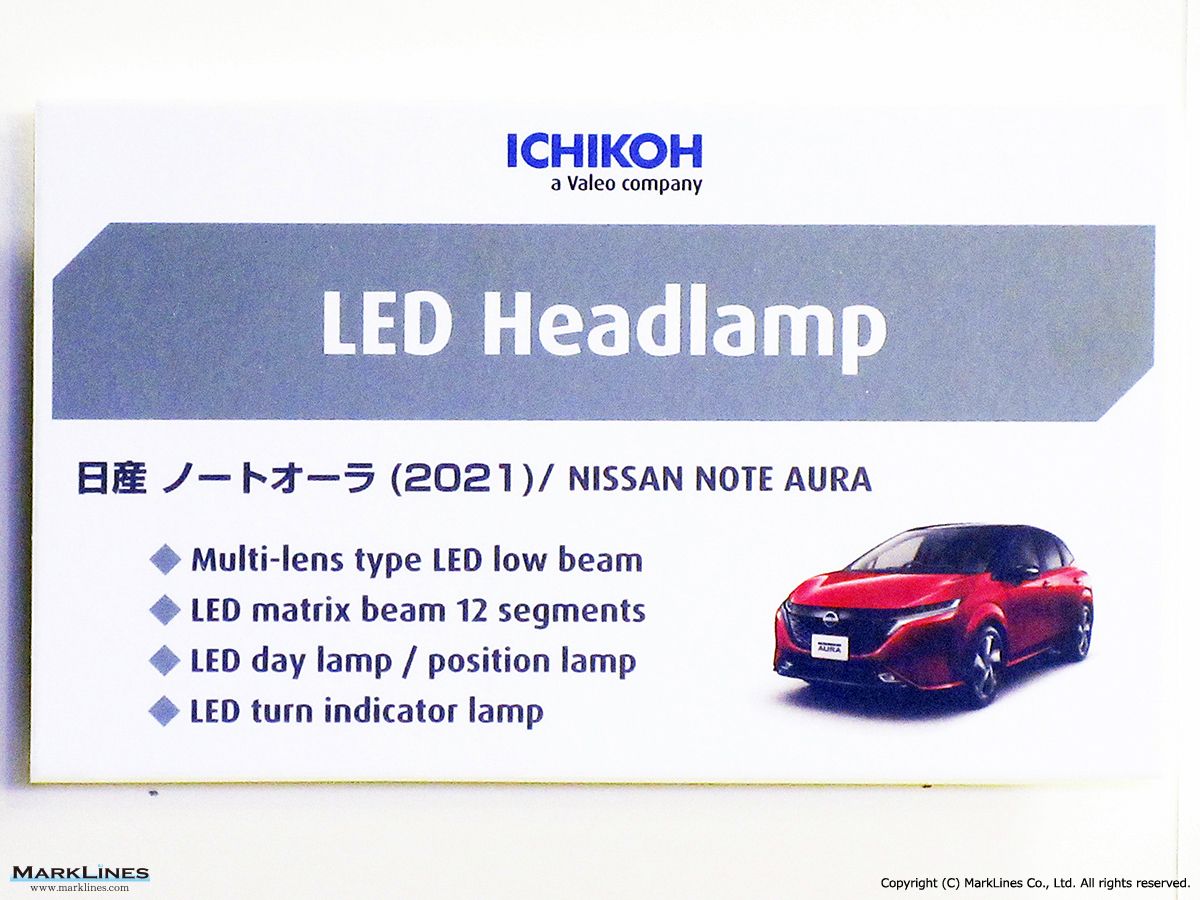
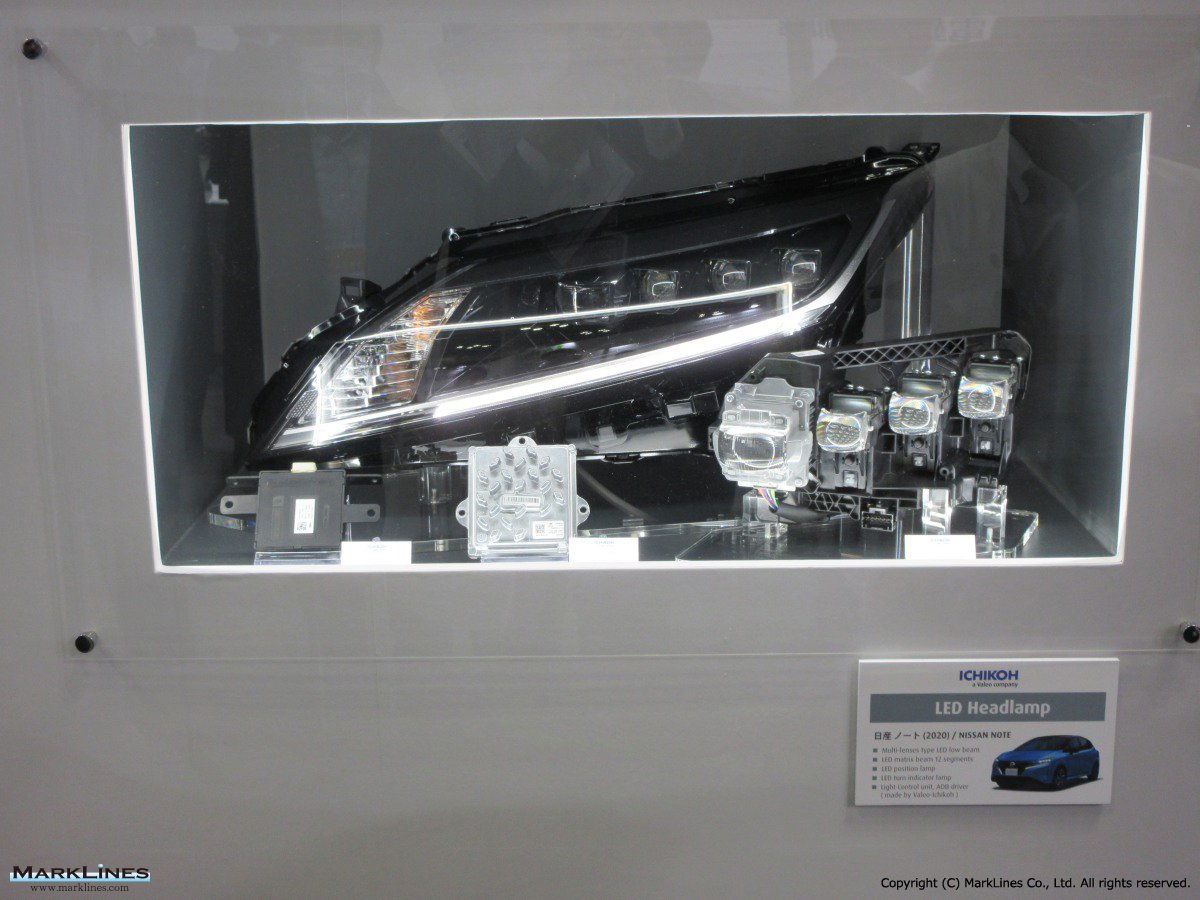
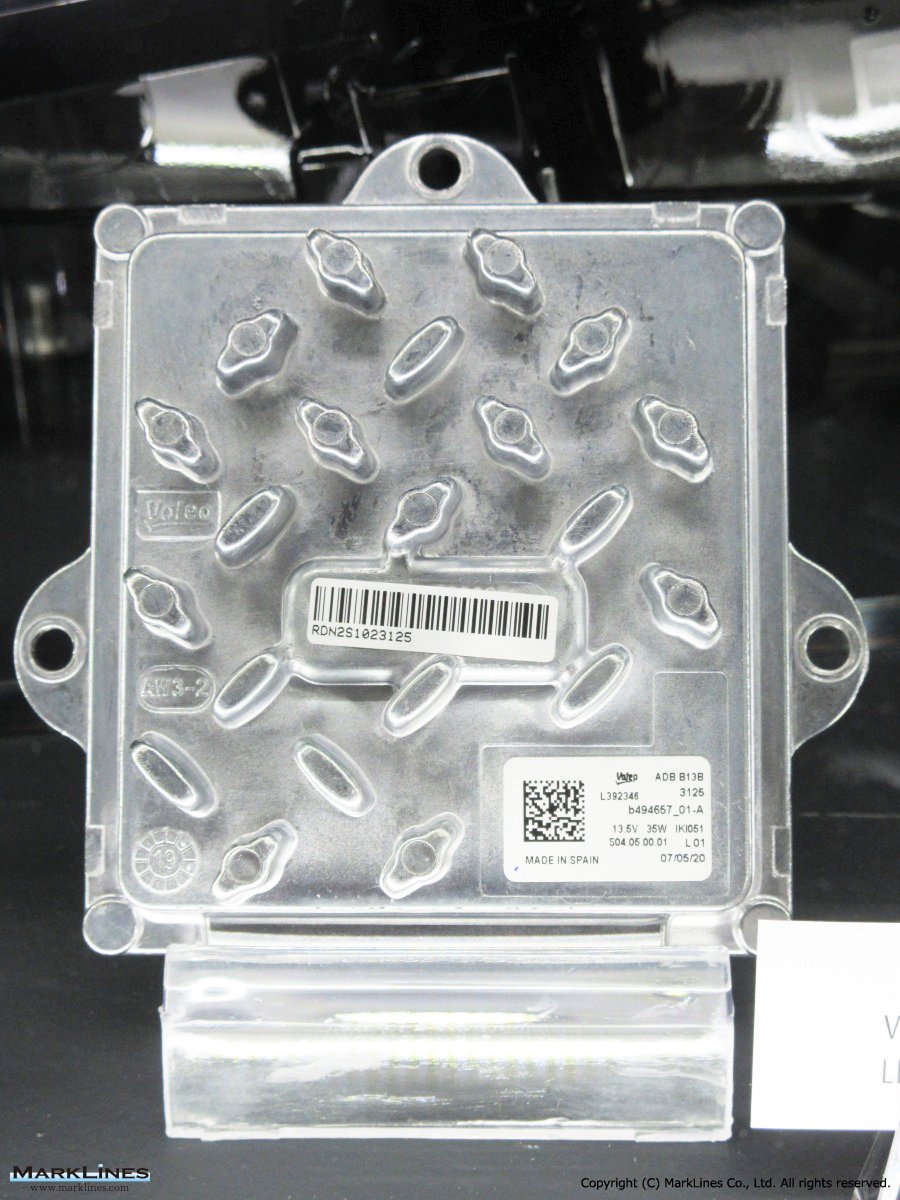
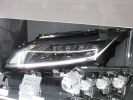
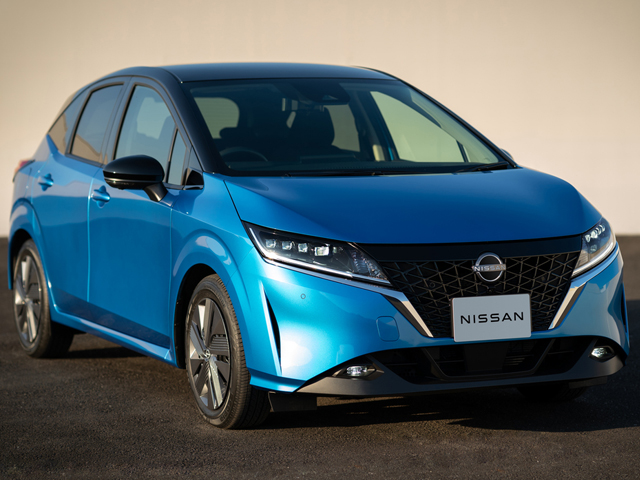
LED headlamp
 2
2
LED head lamp
 5
5
LED headlamp
 6
6
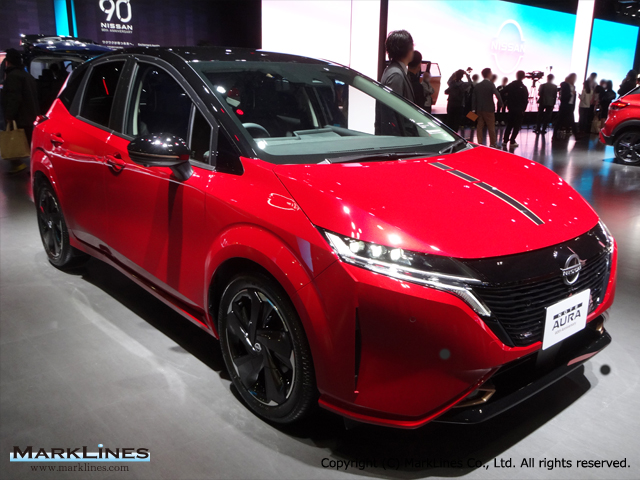
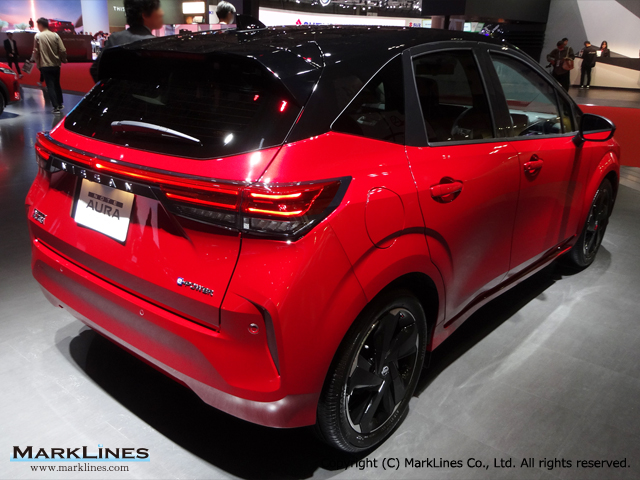
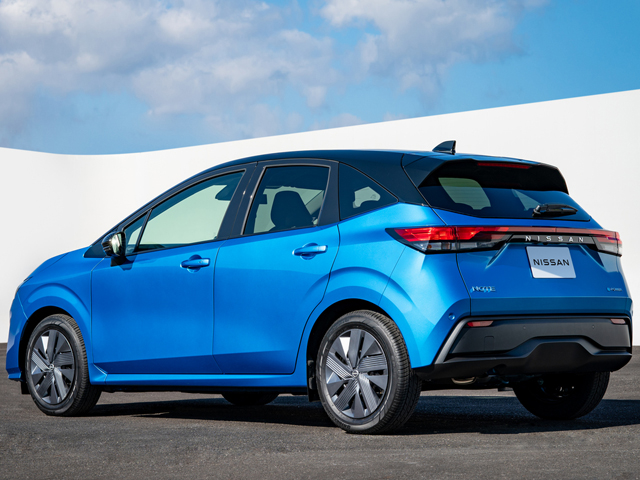
Note/Note Aura
 2
2
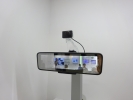
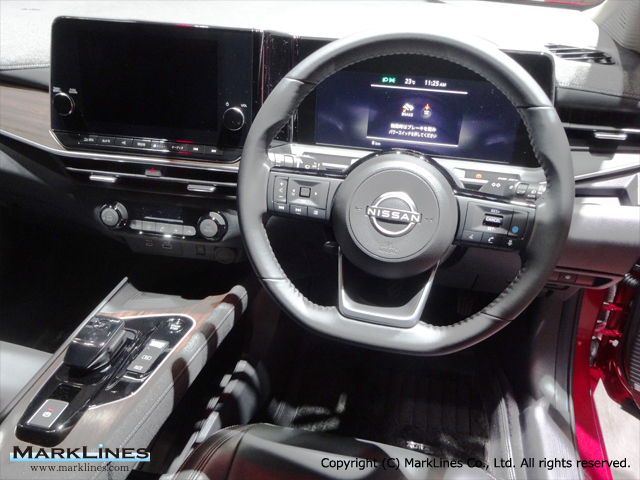
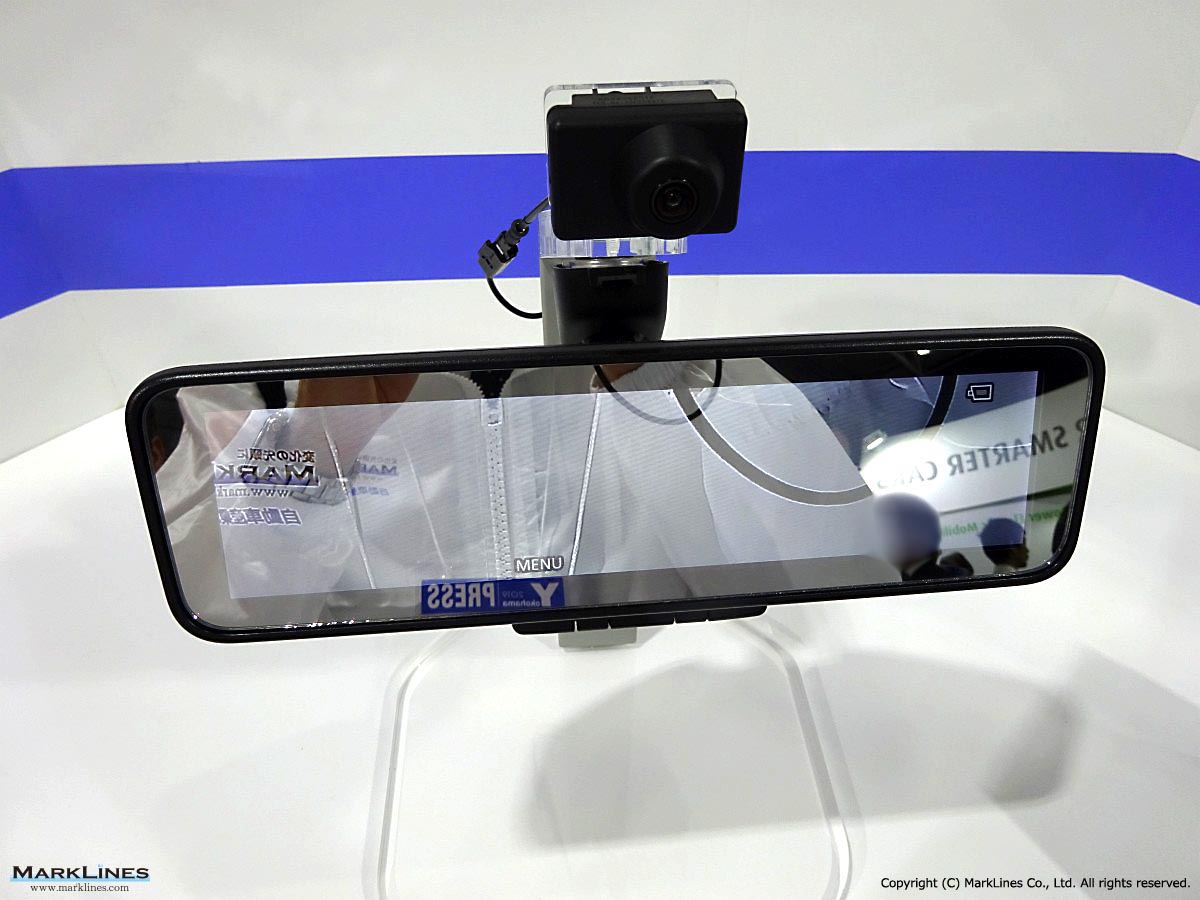
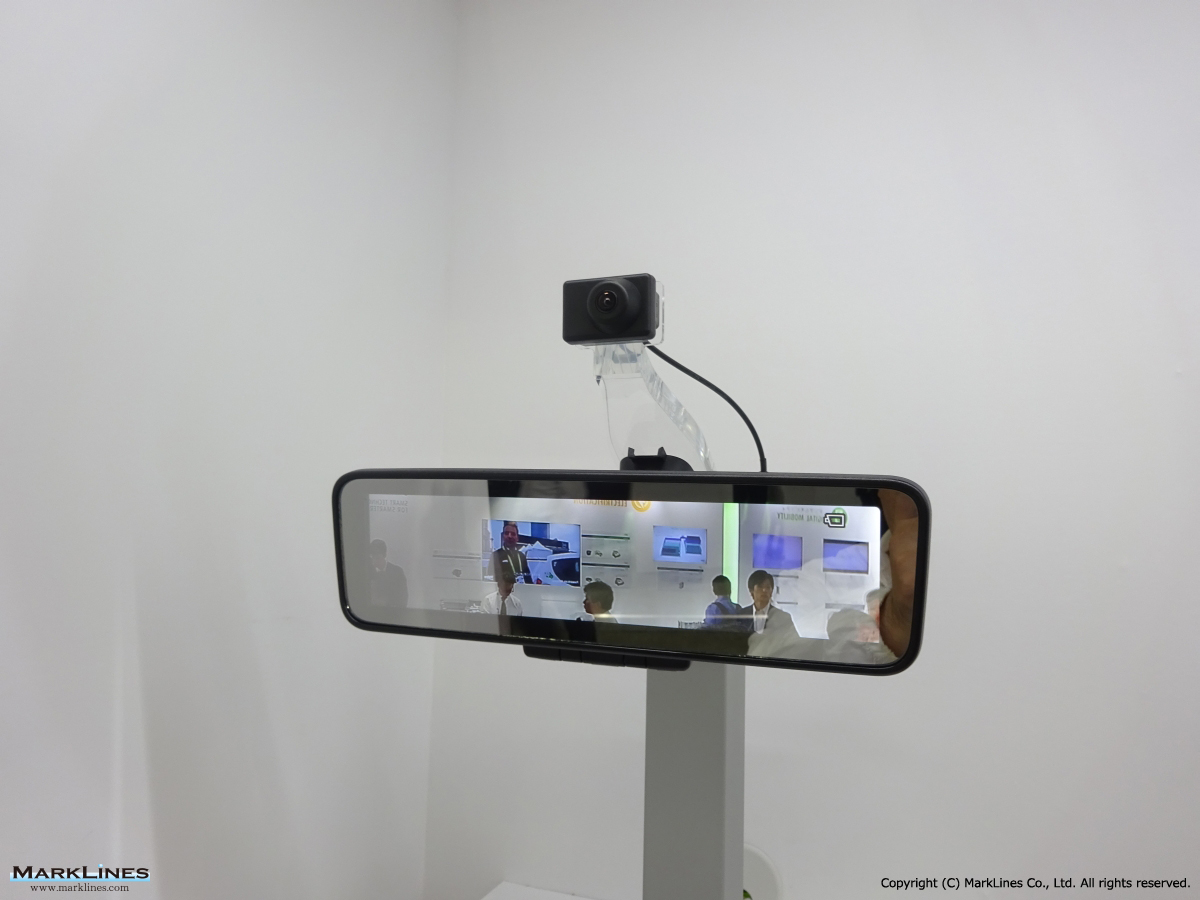
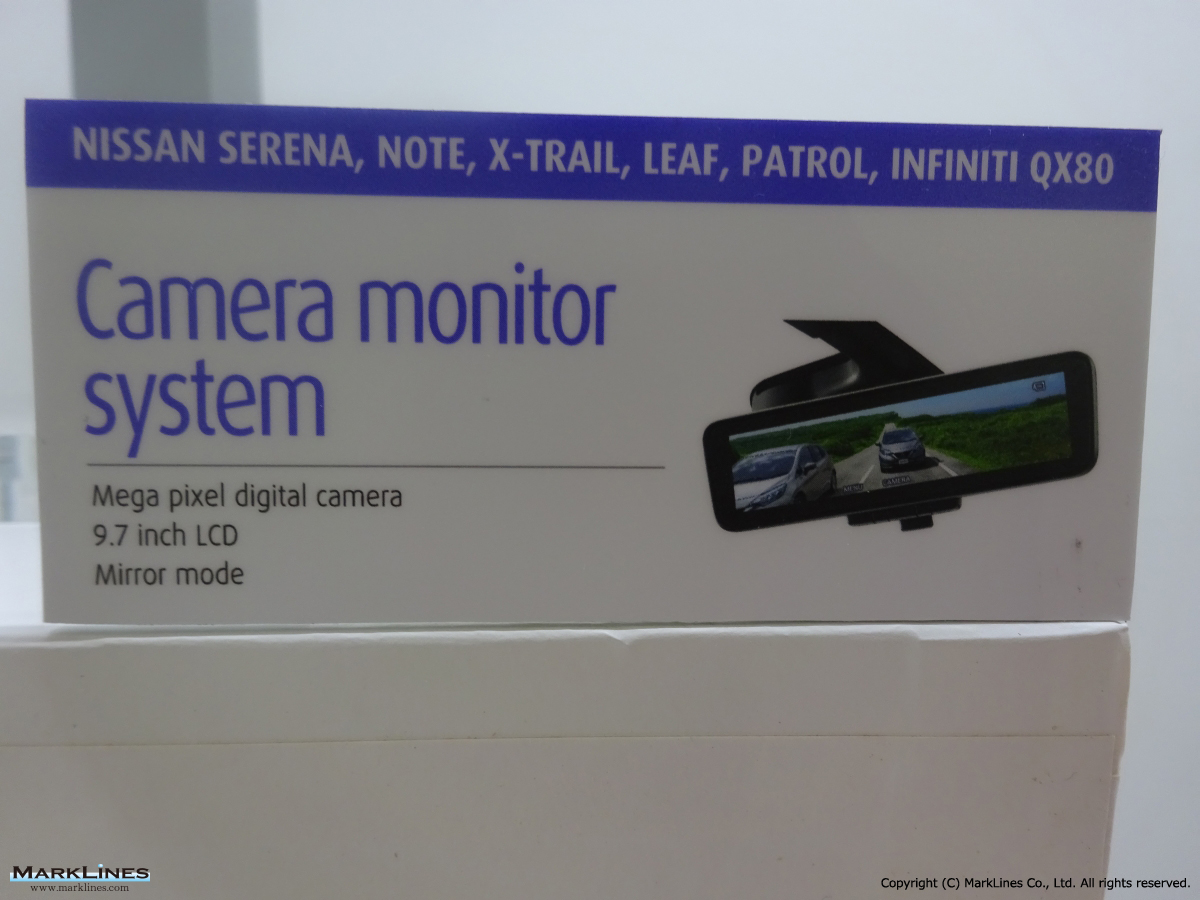
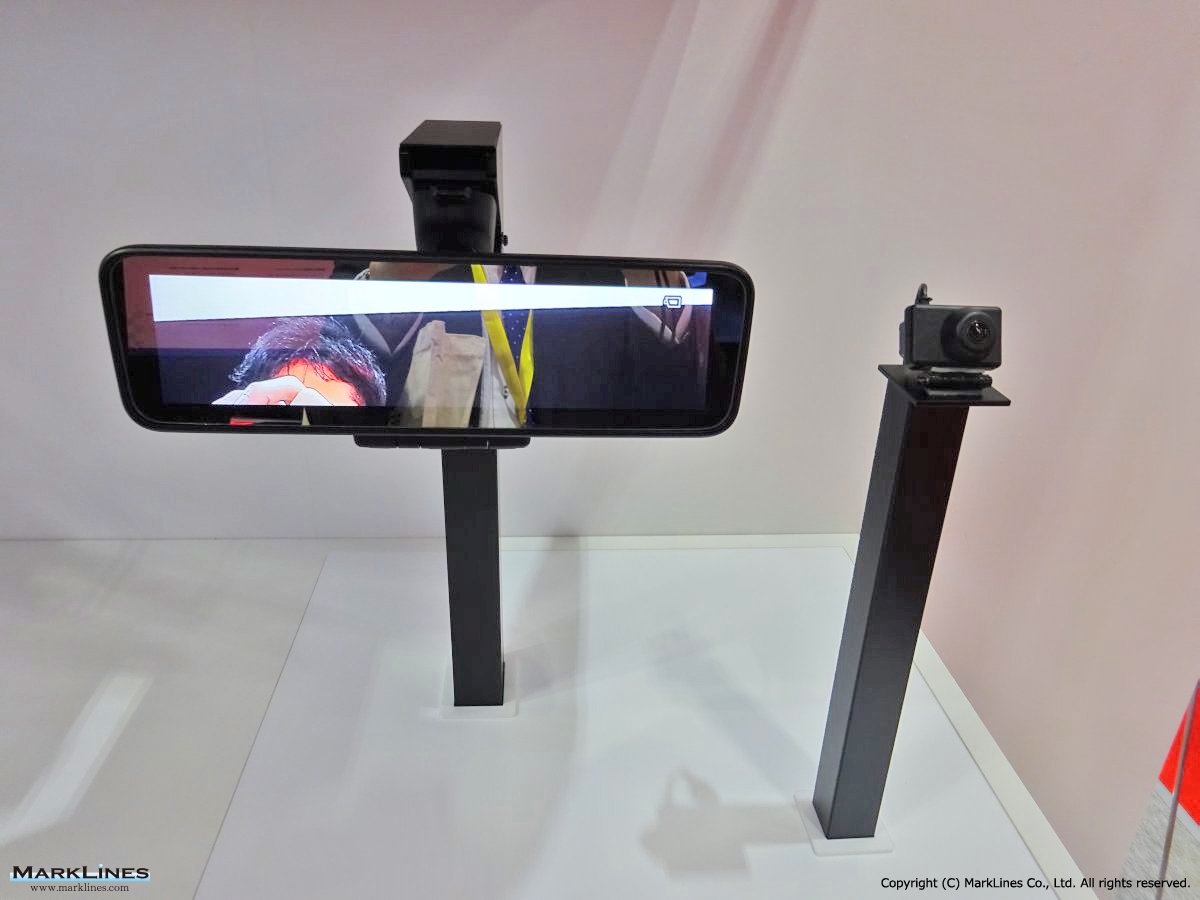
Camera monitor system
 6
6
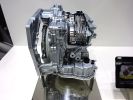
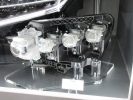
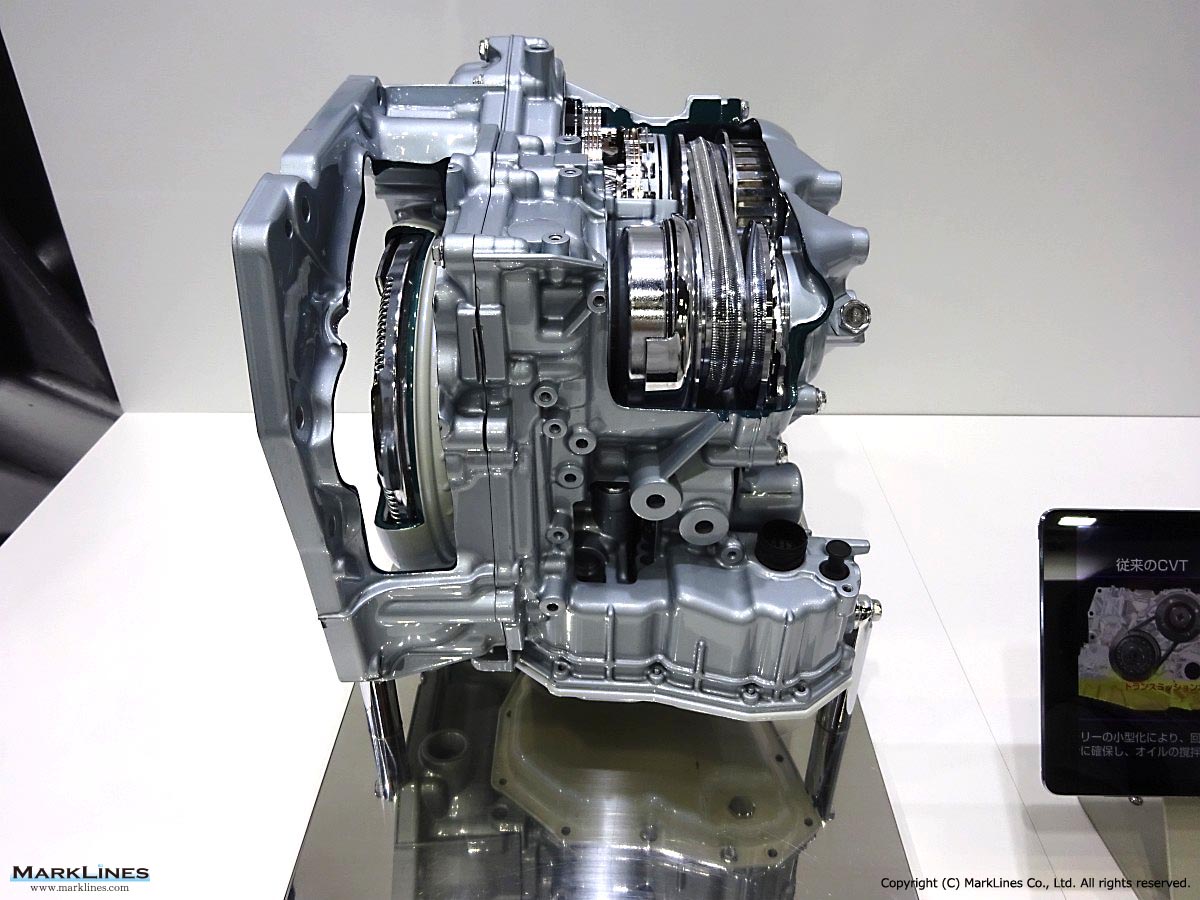
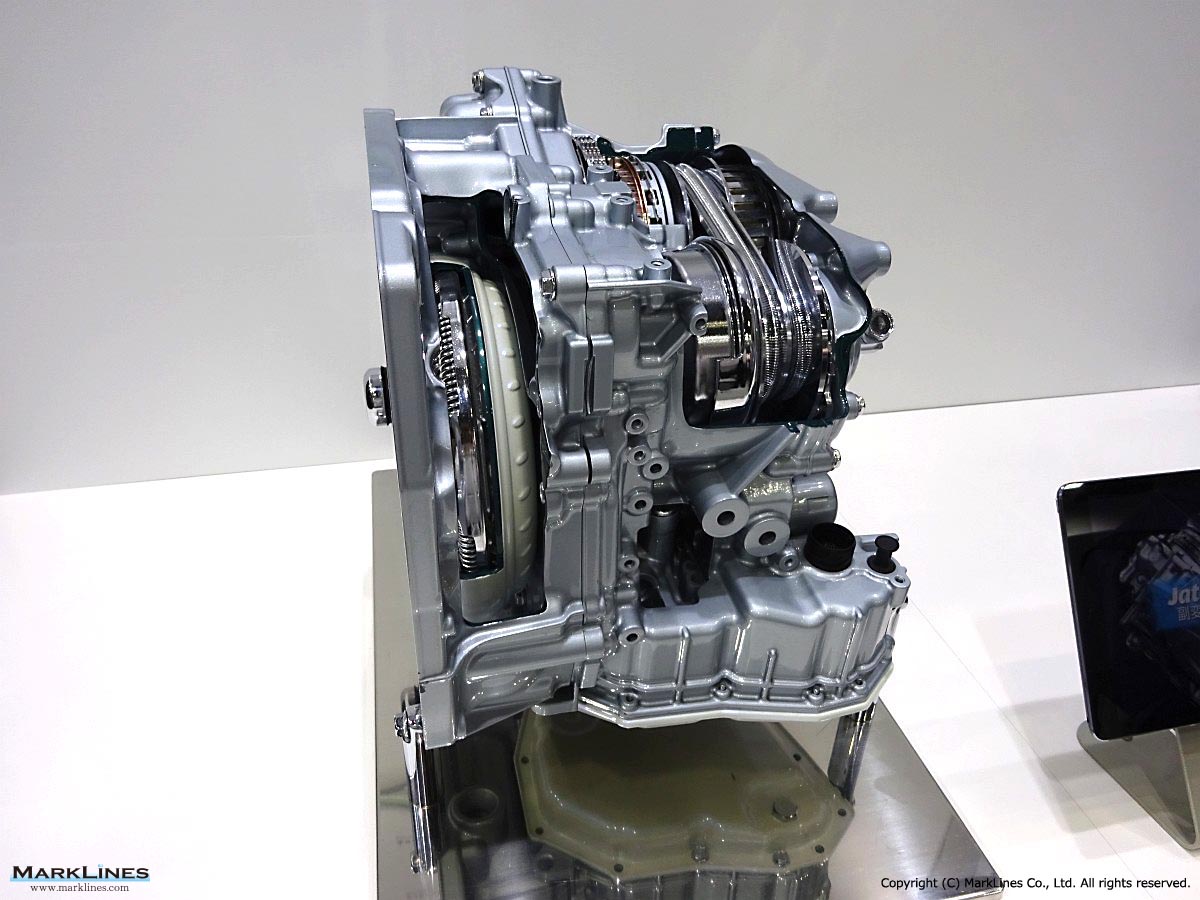
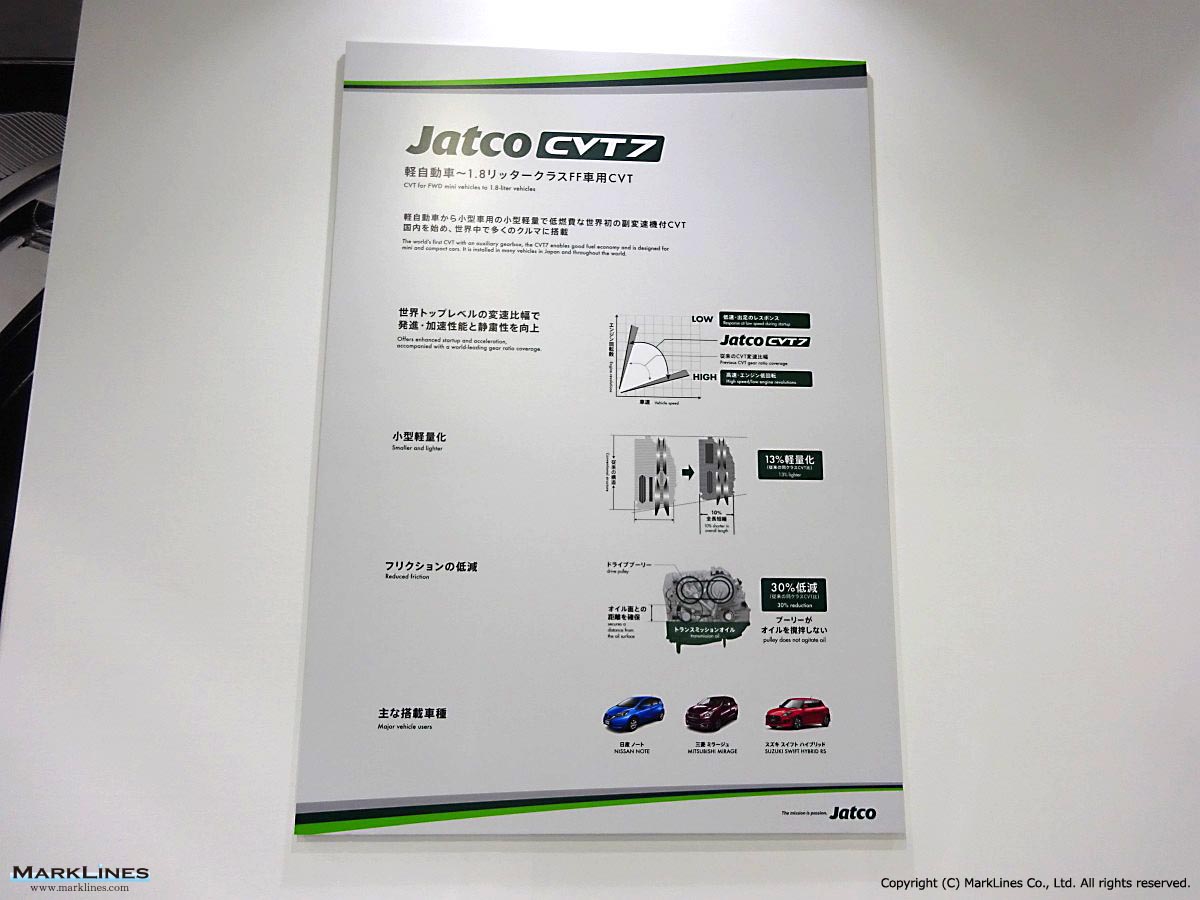
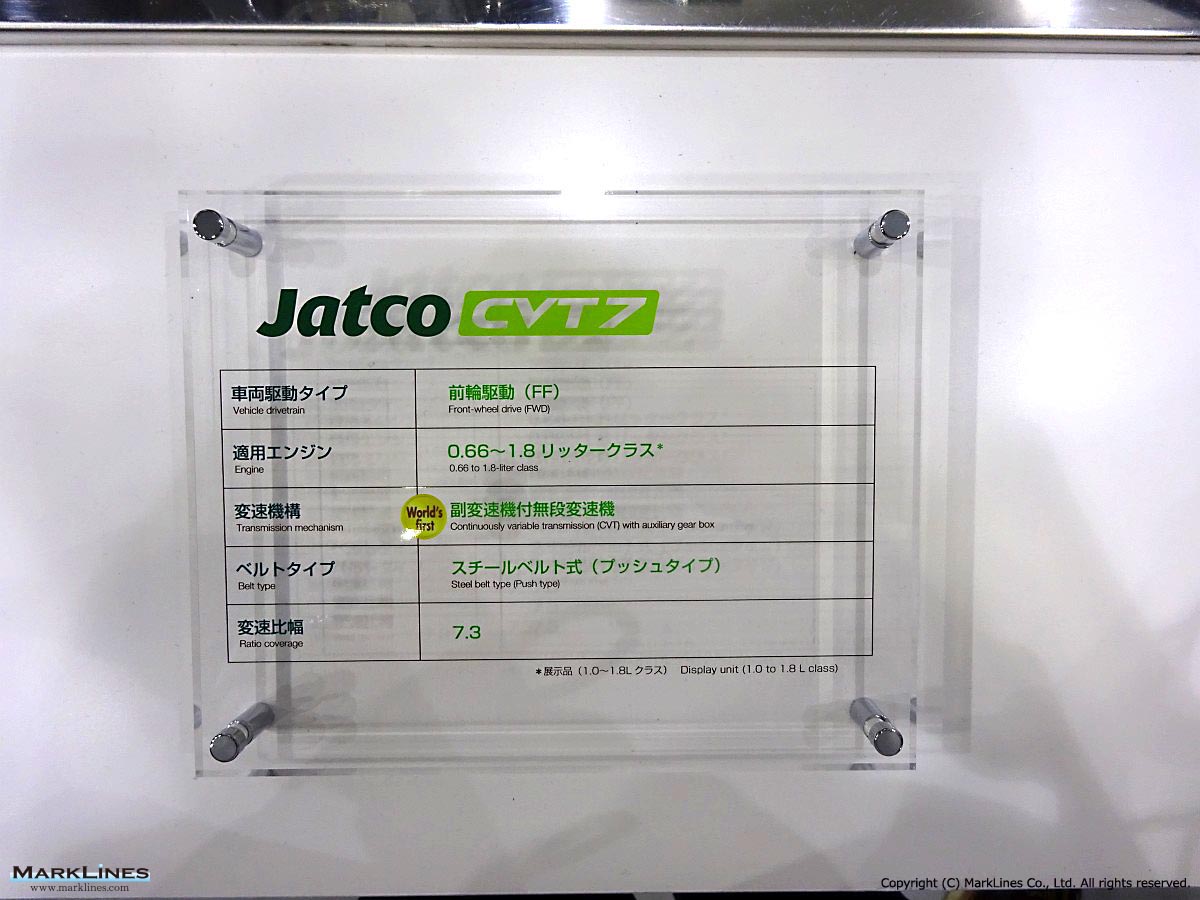
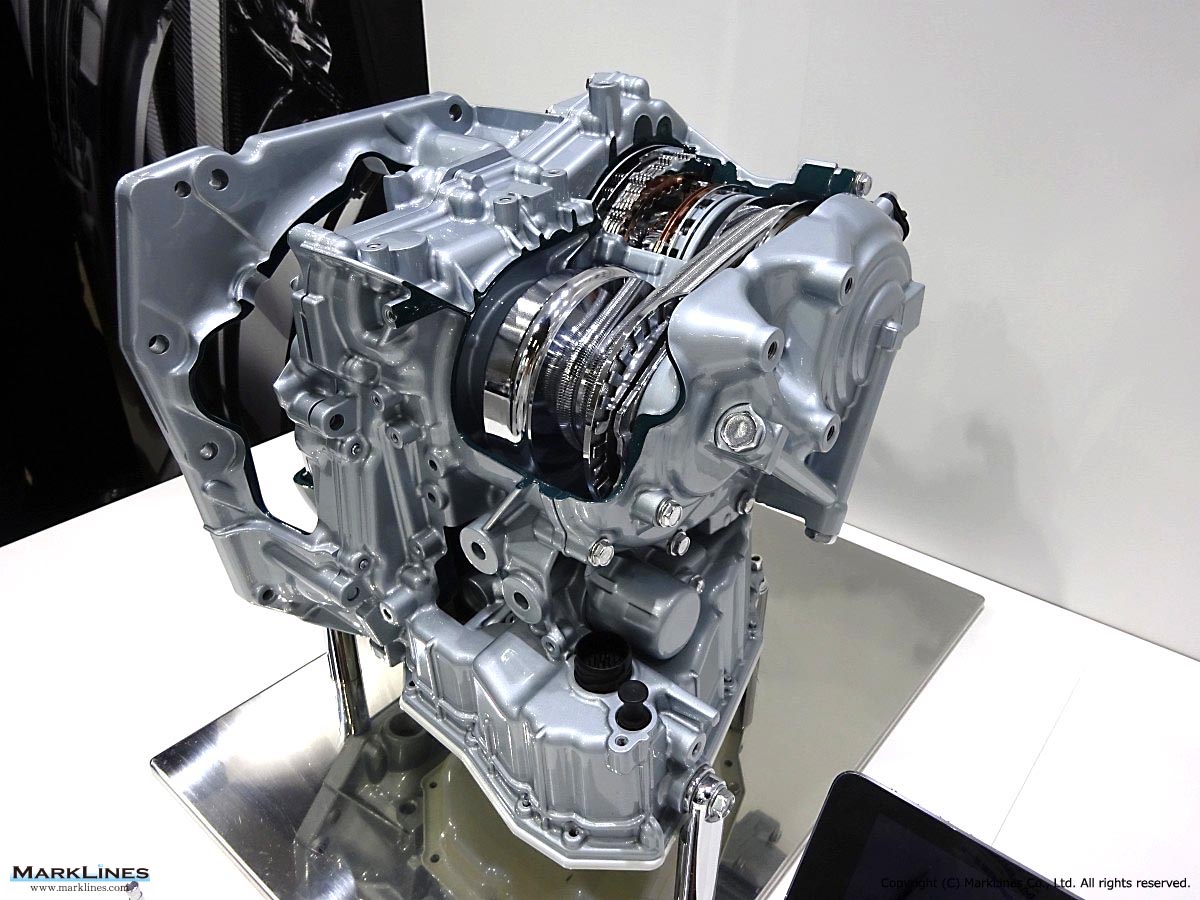
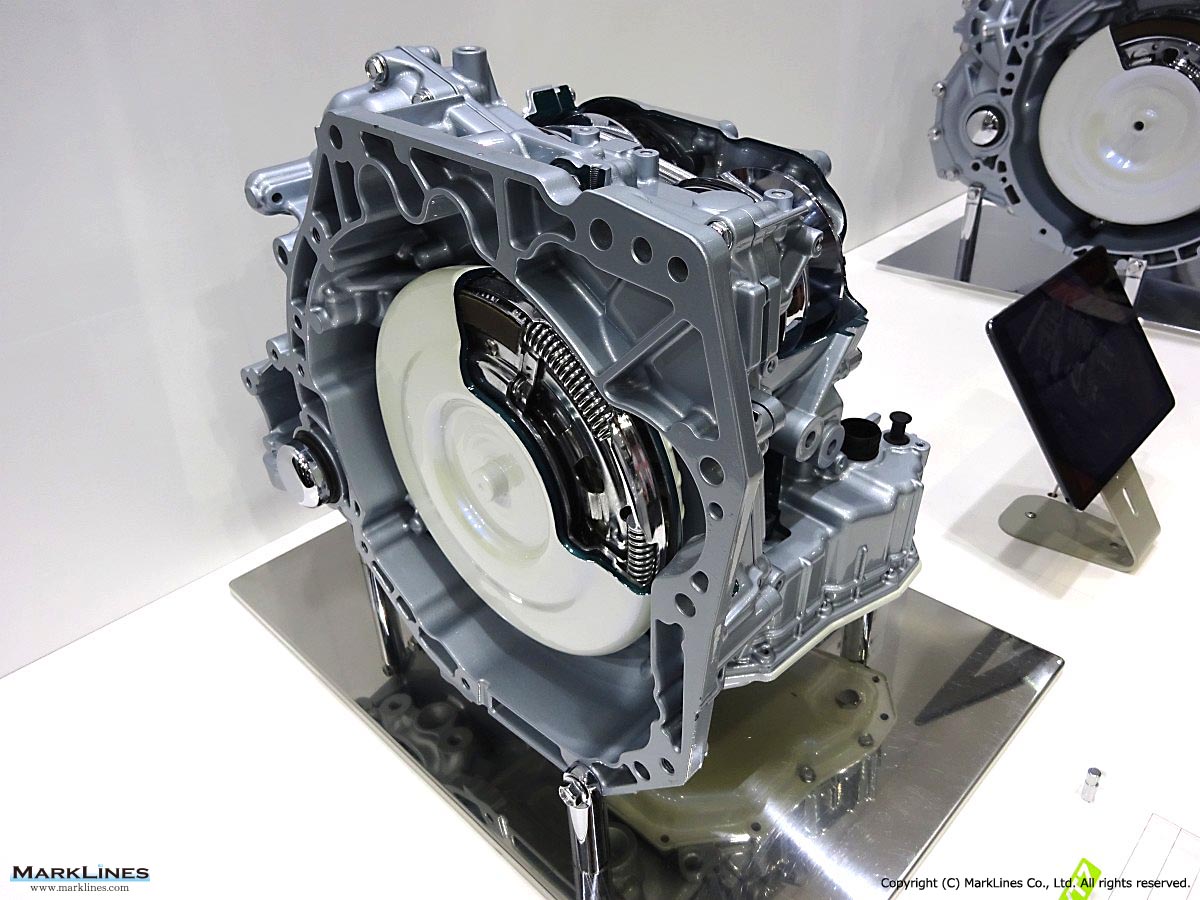
CVT7
 3
3
Camera monitor system
 1
1
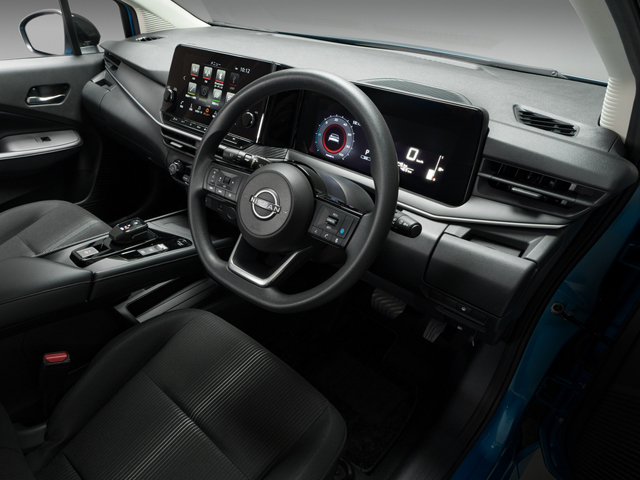
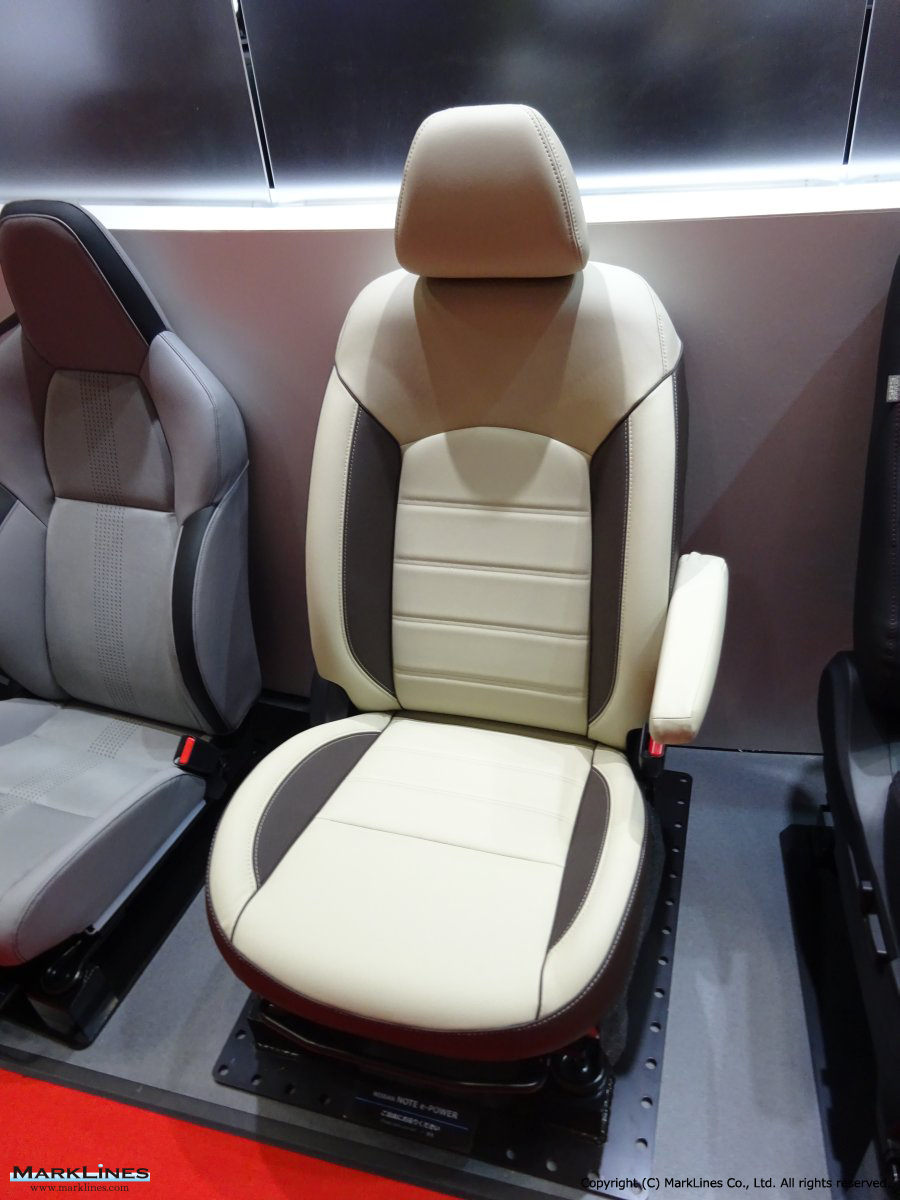
Seat
 3
3
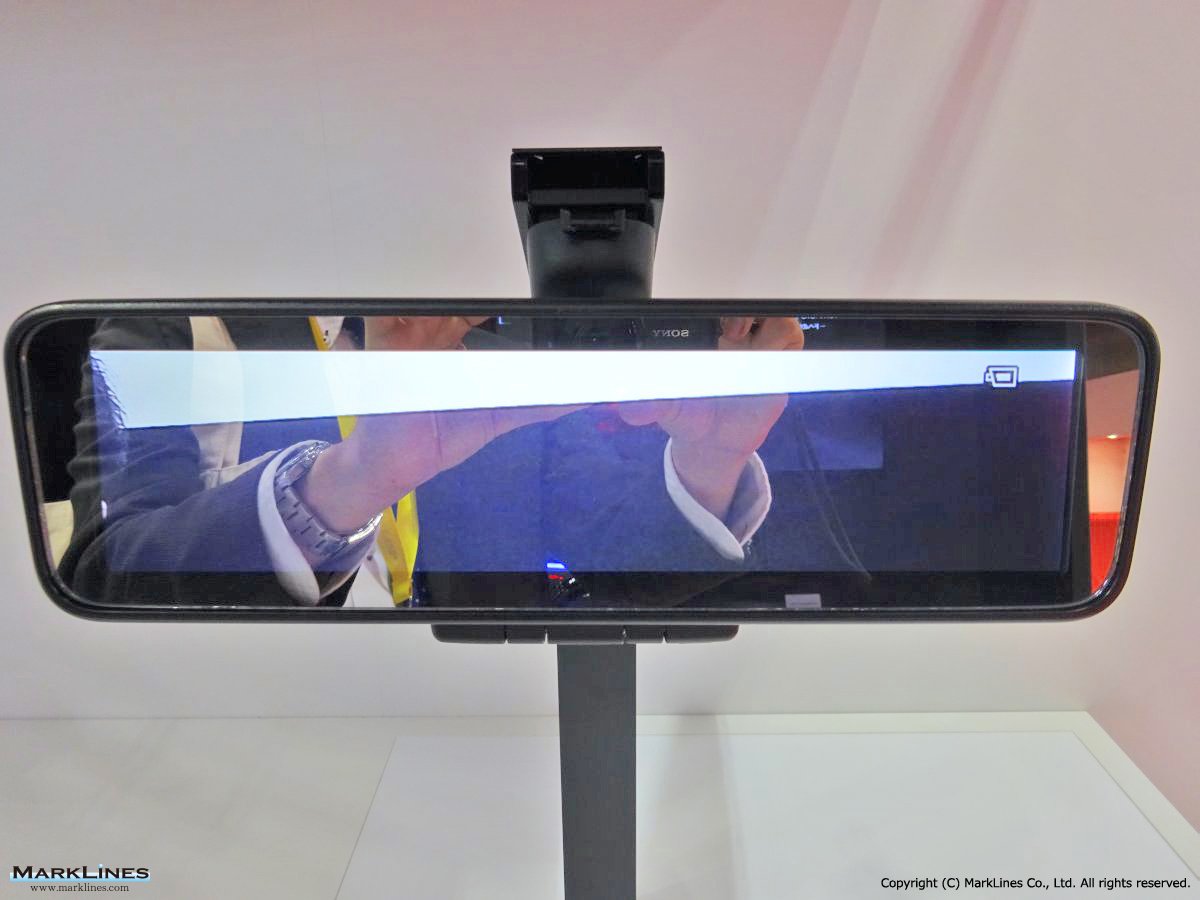
Camera Monitor System
Sort by :
1 - 16 of 16 results
Data changes for Production Statistics
brands has been changed. As a result, by-group figures will also change.- Baojun, Wuling, TQ WulingPrevious Group: GM GroupNew Group: SAIC (Shanghai Automotive Industry Corporation (Group)) Oct. 29, 2025 The "Hyundai/Inokom" and "Inokom" has been changed to "Hyundai". Mar. 7, 2025 The "Renault-Nissan" group has been changed and is now listed separately as "Renault" and "Nissan."As a result, the maker/brand group has also been changed. See he...
Automotive Production Data Updated at: 2026/05/26
2025 global production volume by Japanese OEMs
GlobalProduction Production in Japan Overseas Production Total Pct.chg. Total Pct.chg. PCs CVs Total Pct.chg. Toyota 9,950,904 4.5% 3,275,628 4.7% - - 6,675,276 4.4% Suzuki 3,423,403 3.8% 956,204 -7.2% - - 2,467,199 8.7% Honda 3,396,057 -8.9% 689,802 -0.5% - - 2,706,255 -10.8% Nissan 2,950,035 -5.7% 565,444 -13.9% 503,245 62,199 2,384,591 -3.5% Daihatsu 1,530,549 16.3% 779,101 50.2% - - 751,448 -5.7% Mazda 1,156,707 ...
Automotive Production Data Updated at: 2026/03/03
India - Flash report, Production volume, 2020
Vehicles Make 2020 Y-o-Y (%) Dec. Share (%) Maruti Suzuki India Ltd 153,475 48.6 33.5 Hyundai Motor India Ltd 71,178 22.5 52.6 Kia Motors India Pvt Ltd 20,351 6.4 24.2 Mahindra & Mahindra Ltd 16,400 5.2 6.9 Renault India Pvt Ltd 11,234 3.6 -11.6 Honda Cars India Ltd 9,807 3.1 3.8 Nissan Motor India Pvt Ltd 9,664 3.1 42.8 Ford India Private Ltd 6,943 2.2 -43.0 Volkswagen India Pvt Ltd 5,692 1.8 24.9 MG Motor India Pvt Ltd ...
Automotive Production Data Updated at: 2025/06/04
China - Flash report, Production volume, 2020
aval H6 55,321 45,090 22.7% 370,697 386,657 -4.1% 3 Toyota Corolla/New Corolla 38,480 38,856 -1.0% 349,811 358,926 -2.5% 4 VW Bora 30,523 36,968 -17.4% 328,137 340,744 -3.7% 5 VW Sagitar 30,163 32,870 -8.2% 301,036 296,492 1.5% 6 Buick Excelle GT 41,682 26,012 60.2% 294,850 270,326 9.1% 7 Nissan Bluebird Sylphy/Sylphy 31,092 27,800 11.8% 281,552 348,182 -19.1% 8 Changan/Chana CS75 37,455 27,804 34.7% 276,165 195,566 41.2% 9 Wuling W...
Automotive Production Data Updated at: 2025/06/04
2023 global production volume by Japanese OEMs
2018 2019 2020 2021 2022 GlobalProduction Production in Japan Overseas Production Total Pct.chg. Total Pct.chg. PCs CVs Total Pct.chg. Toyota 10,033,171 11.1% 3,370,752 26.9% - - 6,662,419 4.6% Honda 4,188,039 8.2% 718,521 11.6% - - 3,469,518 7.5% Nissan 3,444,164 5.9% 718,527 28.5% 647,945 70,582 2,725,637 1.3% Suzuki 3,224,996 1.7% 995,948 8.3% - - 2,229,048 ...
Automotive Production Data Updated at: 2025/04/14
2022 global production volume by Japanese OEMs
2017 2018 2019 2020 2021 GlobalProduction Production in Japan Overseas Production Total Pct.chg. Total Pct.chg. PCs CVs Total Pct.chg. Toyota 9,026,713 5.2% 2,656,009 -7.7% 6,370,704 11.7% Honda 3,870,161 -6.4% 643,973 4.6% 3,226,188 -8.3% Nissan 3,250,800 -9.4% 559,314 12.6% 503,791 55,523 2,691,486 -12.9% Suzuki 3,172,192 10.7% 919,891 5.1% 2,252,3...
Automotive Production Data Updated at: 2025/04/14
2024 global production volume by Japanese OEMs
GlobalProduction Production in Japan Overseas Production Total Pct.chg. Total Pct.chg. PCs CVs Total Pct.chg. Toyota 9,521,876 -5.1% 3,128,351 -7.2% - - 6,393,525 -4.0% Honda 3,733,602 -10.9% 693,259 -3.5% - - 3,040,343 -12.4% Suzuki 3,299,602 2.3% 1,029,910 3.4% - - 2,269,692 1.8% Nissan 3,144,470 -8.7% 656,990 -8.6% 594,593 62,397 2,487,480 -8.7% Daihatsu 1,315,564 -21.2% 518,881 -36.8% - - 796,683 -6.0% Mazda 1,201,049...
Automotive Production Data Updated at: 2025/03/28
2021 global production volume by Japanese OEMs (Preliminary)
16 2017 2018 2019 2020 GlobalProduction Production in Japan Overseas Production Total Pct.chg. Total Pct.chg. PCs CVs Total Pct.chg. Toyota 8,583,985 8.5% 2,877,962 -1.5% - - 5,706,023 14.4% Honda 4,136,018 -6.0% 615,587 -15.6% - - 3,520,431 -4.1% Nissan 3,585,153 -1.2% 496,577 -2.5% 425,946 70,631 3,088,576 -1.0% Suzuki 2,865,652 11.1% 874,927 -5.8% - - 1,990,7...
Automotive Production Data Updated at: 2024/03/29
Production in Egypt by make
Production in Egypt by make Home Automotive Production Data Production data by models Production in Egypt by make Production in Egypt by make Type Make/Brand 2015 2016 2017 2018 2019 2020 2021 Cars Toyota N/A N/A N/A N/A N/A N/A N/A Nissan N/A N/A N/A N/A N/A N/A N/A Other/adjustment 12,000 10,930 9,970 18,500 18,500 23,754 N/A Total 12,000 10,930 9,970 18,500 18,500 23,754 N/A Light Comm. N/A N/A N/A N/A N/A N/A ...
Automotive Production Data Updated at: 2024/03/27
2020 global production volume by Japanese OEMs (Preliminary)
on volume by Japanese OEMs 2016 2017 2018 2019 GlobalProduction Production in Japan Overseas Production Total Pct.chg. Total Pct.chg. PCs CVs Total Pct.chg. Toyota 7,909,488 -12.6% 2,922,605 -14.4% - - 4,986,883 -11.5% Honda 4,398,583 -14.9% 729,500 -13.5% - - 3,669,083 -15.2% Nissan 3,629,672 -26.8% 509,224 -37.0% 428,017 81,207 3,120,448 -24.8% Suzuki 2,578,901 -15.5% 928,387 -1.9% - - 1,650,514 -21.7% Daihatsu 1,3...
Automotive Production Data Updated at: 2021/02/05
2019 global production volume by Japanese OEMs (Preliminary)
(Preliminary) 2016 2017 2018 GlobalProduction Production in Japan Overseas Production Total Pct.chg. Total Pct.chg. PCs CVs Total Pct.chg. Toyota 9,053,517 1.9% 3,415,864 8.8% - - 5,637,653 -1.9% Honda 5,170,595 -3.5% 843,056 -5.4% - - 4,327,539 -3.1% Nissan 4,958,200 -9.6% 807,744 -13.2% 708,820 98,924 4,150,456 -8.9% Suzuki 3,055,860 -11.1% 946.768 -6.6% - - 2,109,092 ...
Automotive Production Data Updated at: 2020/07/09
2018 global production volume by Japanese OEMs (Preliminary)
ary) 2018 global production volume by Japanese OEMs (Preliminary) 2015 2016 2017 GlobalProduction Production in Japan Overseas Production Total Pct.chg. Total Pct.chg. PCs CVs Total Pct.chg. Toyota 8,885,533 -1.4% 3,138,751 -1.6% 2,825,147 313,604 5,746,782 -1.2% Nissan 5,486,906 -4.9% 930,997 -8.7% 823,515 107,482 4,555,909 -4.1% Honda 5,357,013 2.3% 891,248 9.0% - - 4,465,765...
Automotive Production Data Updated at: 2019/02/01
2017 global production volume by Japanese OEMs (Preliminary)
Japanese OEMs (Preliminary) 2017 global production volume by Japanese OEMs (Preliminary) 2015 2016 GlobalProduction Production in Japan Overseas Production Total Pct.chg. Total Pct.chg. PCs CVs Total Pct.chg. Toyota 9,007,511 0.4% 3,189,556 0.7% 2,869,600 319,956 5,817,955 0.2% Nissan 5,769,277 3.8% 1,019,972 7.4% 921,505 98,467 4,749,305 3.1% Honda 5,236,842 4.8% 817,500 -0.3% - - 4,419,342 5.8% Suzuki 3,302,336 12....
Automotive Production Data Updated at: 2018/02/01
2016 global production volume by Japanese OEMs (Preliminary)
e by Japanese OEMs (Preliminary) 2016 global production volume by Japanese OEMs (Preliminary) 2015 GlobalProduction Production in Japan Overseas Production Total Pct.chg. Total Pct.chg. PCs CVs Total Pct.chg. Toyota 8,973,988 0.5% 3,166,338 -0.7% 2,847,367 318,971 5,807,650 1.2% Nissan 5,556,241 7.5% 950,102 8.9% 835,058 115,044 4,606,139 7.2% Honda 4,999,266 10.0% 820,226 12.3% - - 4,179,040 9.6% Suzuki 2,945,295 -2....
Automotive Production Data Updated at: 2017/01/31
2014 Global production volume by Japanese OEMs (Preliminary)
volume by Japanese OEMs (Preliminary) 2014 global production volume by Japanese OEMs (Preliminary) Global Production Production in Japan OverseasProduction Total Pct.chg. Total Pct.chg. PCs CVs Total Pct.chg. Toyota * 9,004,825 1.3% 3,266,805 -2.7% 2,915,185 351,620 5,738,020 3.7% Nissan 5,097,772 3.0% 880,887 -8.7% 764,230 116,657 4,216,885 5.8% Honda 4,513,769 5.0% 958,179 14.0% - - 3,555,590 2.8% Suzuki 3,016,710 6.0...
Automotive Production Data Updated at: 2016/04/28
2015 Global production volume by Japanese OEMs (Preliminary)
by Japanese OEMs (Preliminary) 2015 global production volume by Japanese OEMs (Preliminary) 2014 Global Production Production in Japan Overseas Production Total Pct.chg. Total Pct.chg. PCs CVs Total Pct.chg. Toyota 8,929,075 -0.8% 3,188,444 -2.4% 2,827,349 361,095 5,740,631 0.1% Nissan 5,170,056 1.4% 872,831 -0.9% 755,742 117,089 4,297,225 1.9% Honda 4,543,838 0.7% 730,493 -23.8% - - 3,813,345 7.2% Suzuki 3,034,081 0....
Automotive Production Data Updated at: 2016/04/27


 Japan
Japan USA
USA Mexico
 Germany
 China (Shanghai)
 Thailand
 India
India