


Search Results by Category
All information related to {{ key_word }}.
AI Navigator will guide you. Click here for information about {{ key_word }}.
Images
 2
2
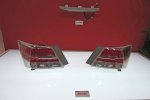
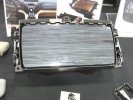
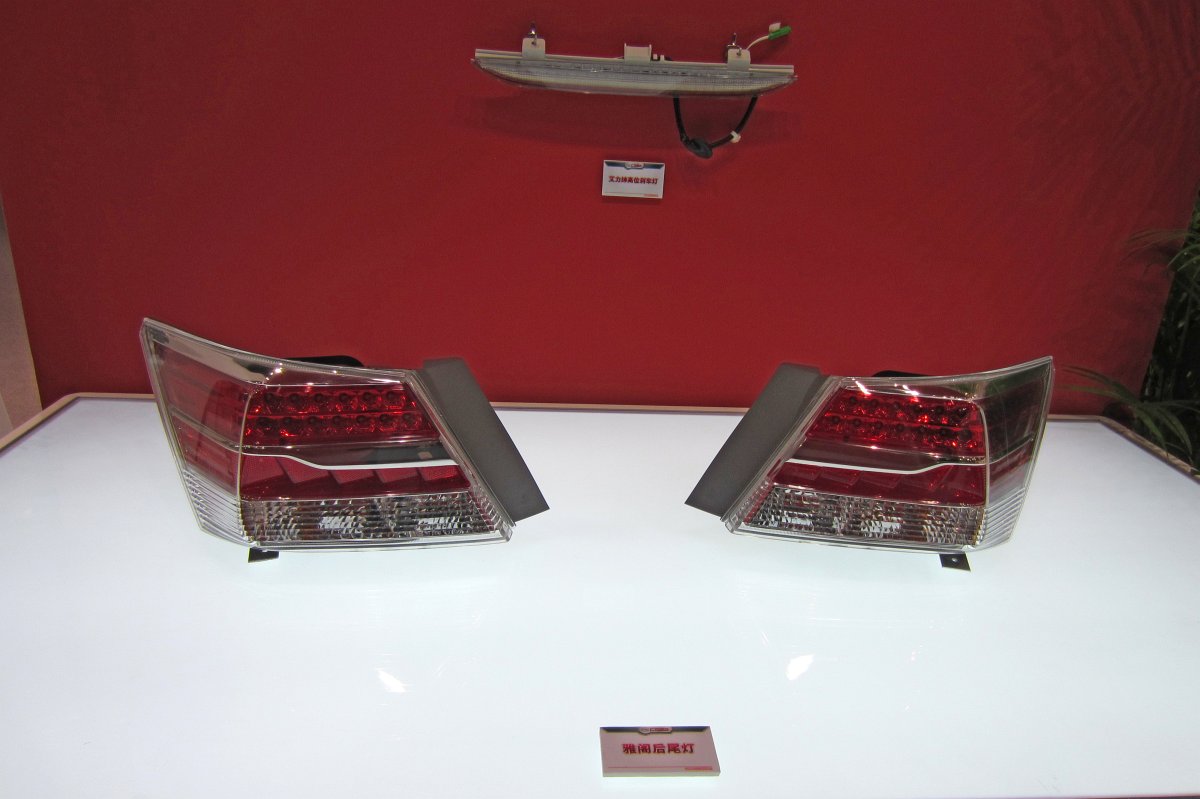
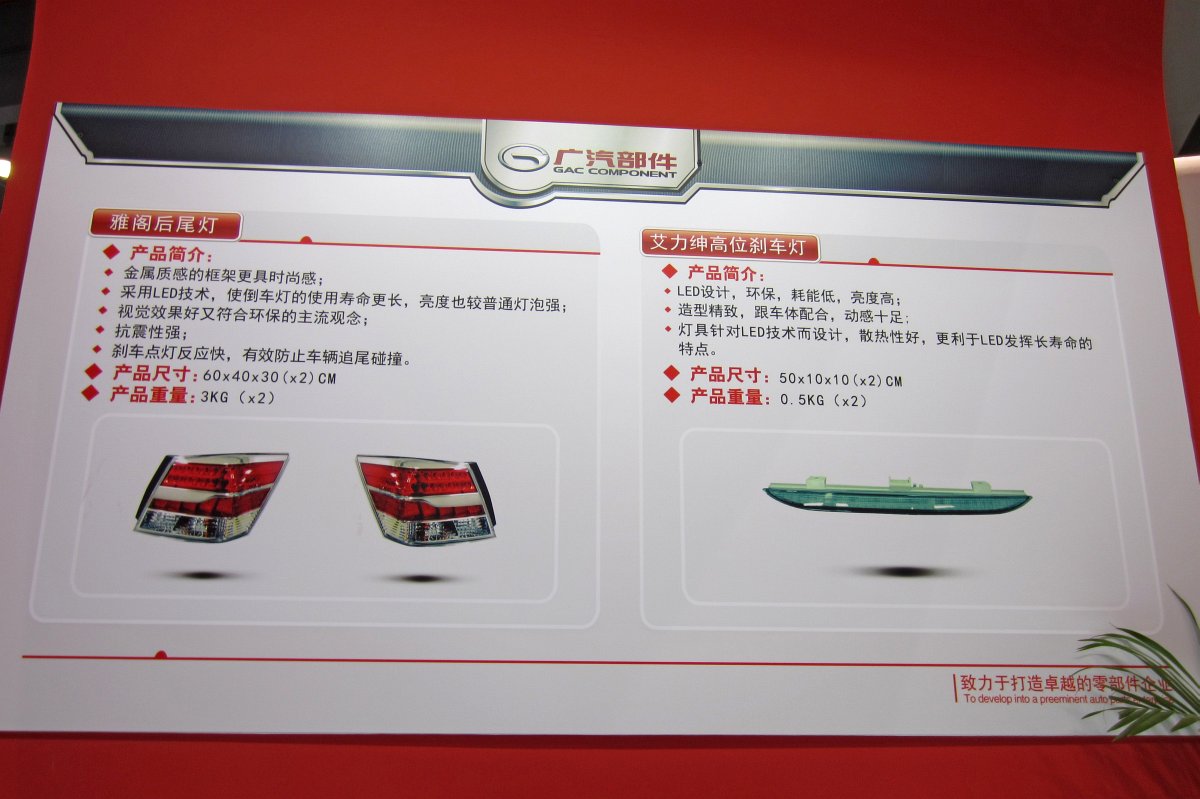
[Guangzhou Stanley Electric Co., Ltd.] Taillight and high-mounted stop lamp
 1
1
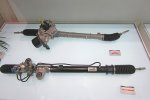
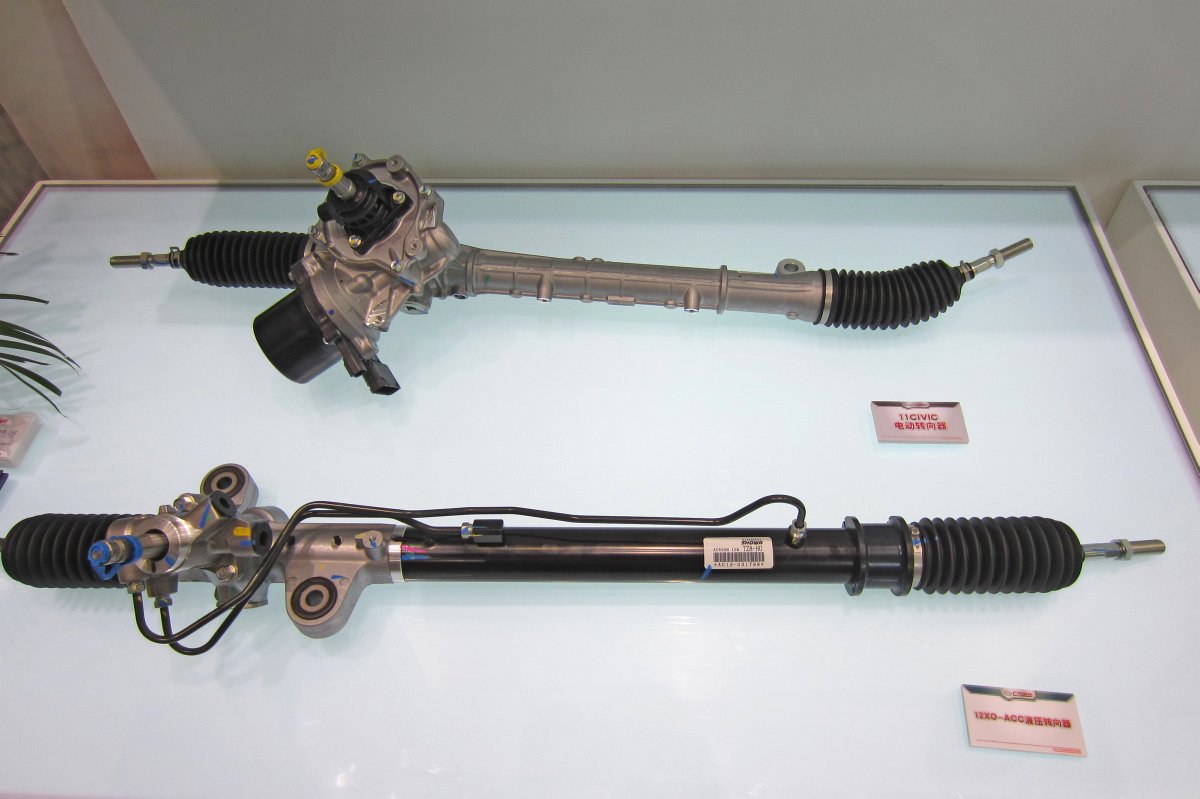
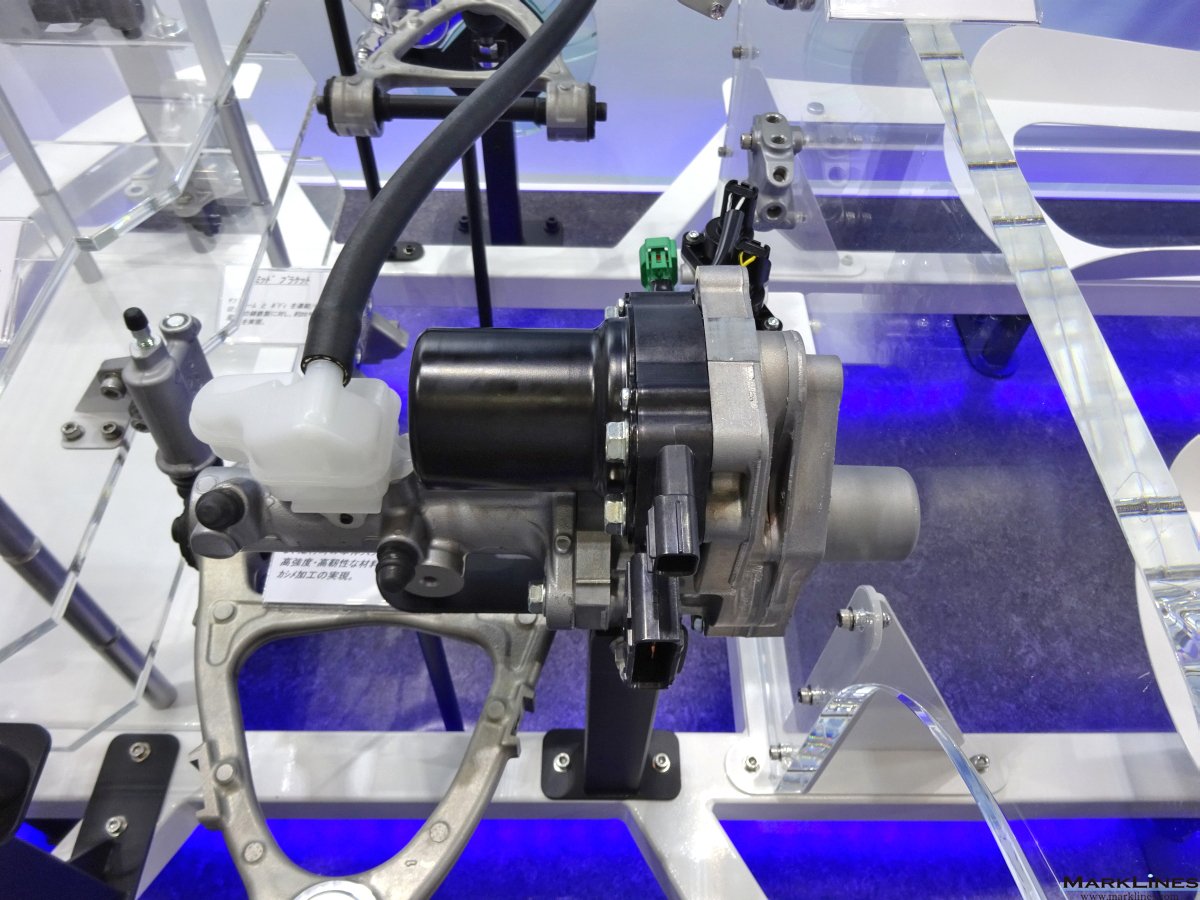
[Guangzhou Showa Auto Parts Co., Ltd.] Hydraulic Power Steering System Steering Unit
 4
4
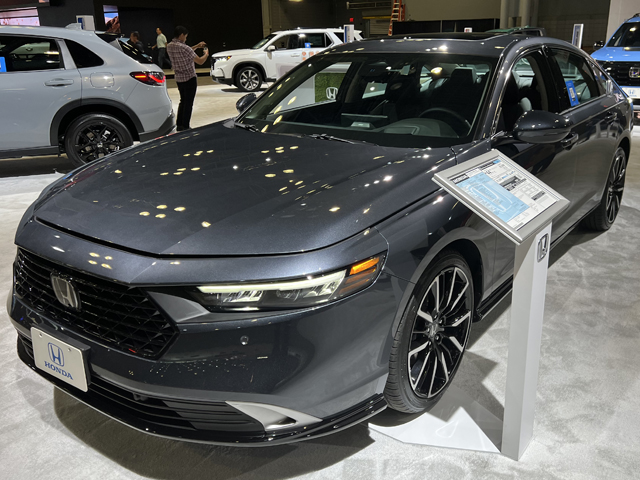
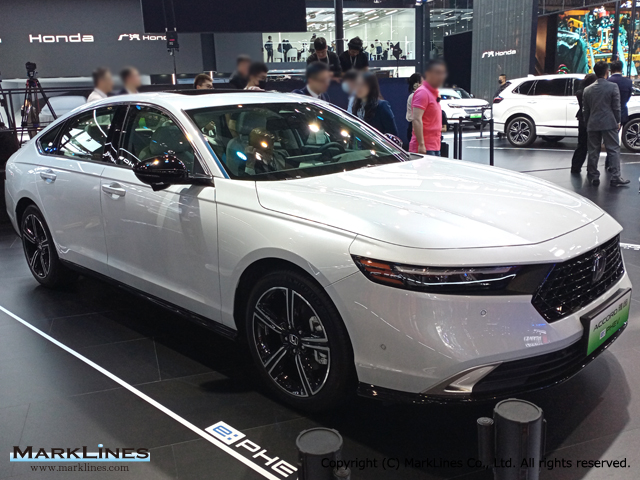
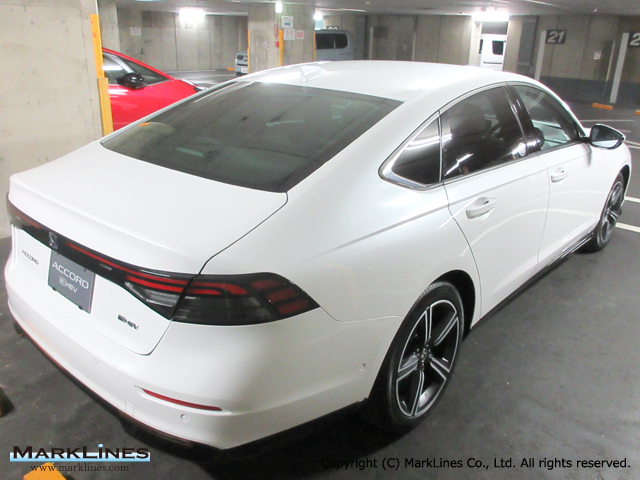
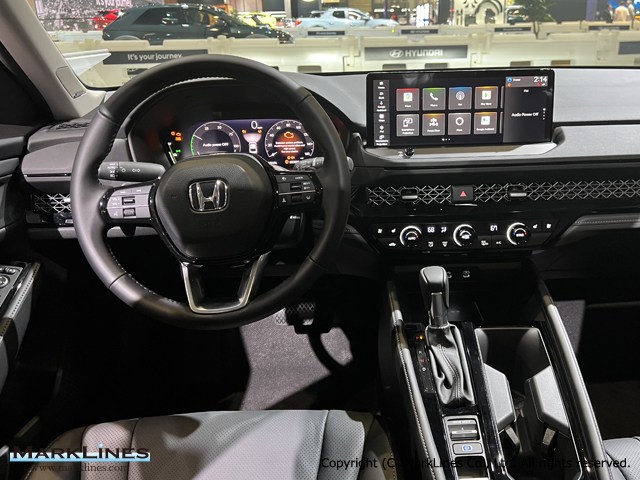
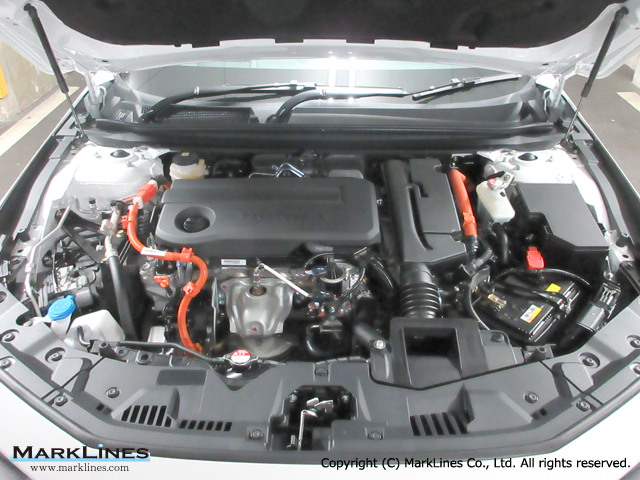
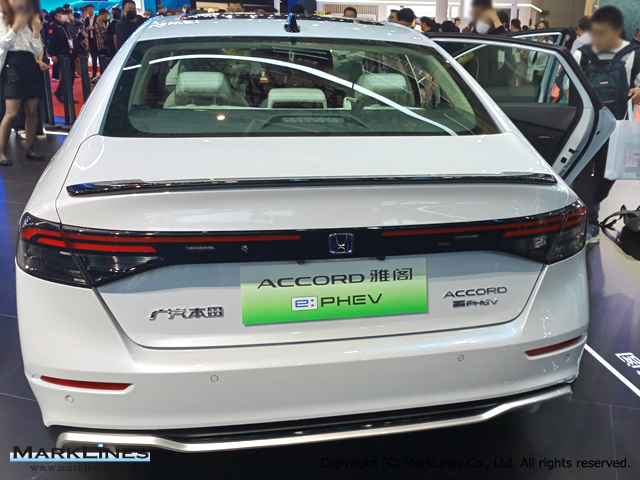
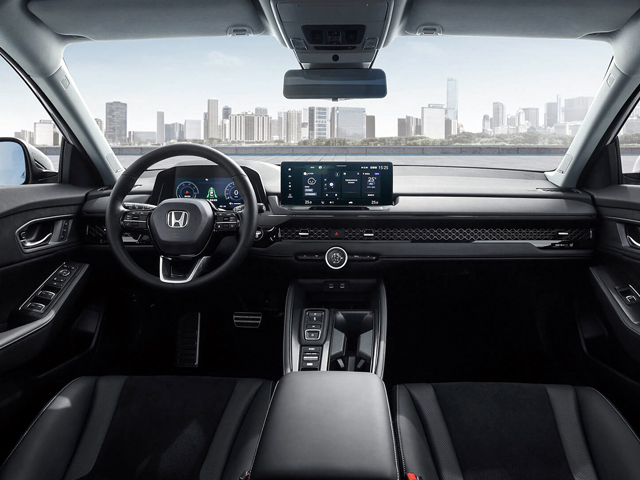
Accord Hybrid
 3
3
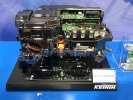
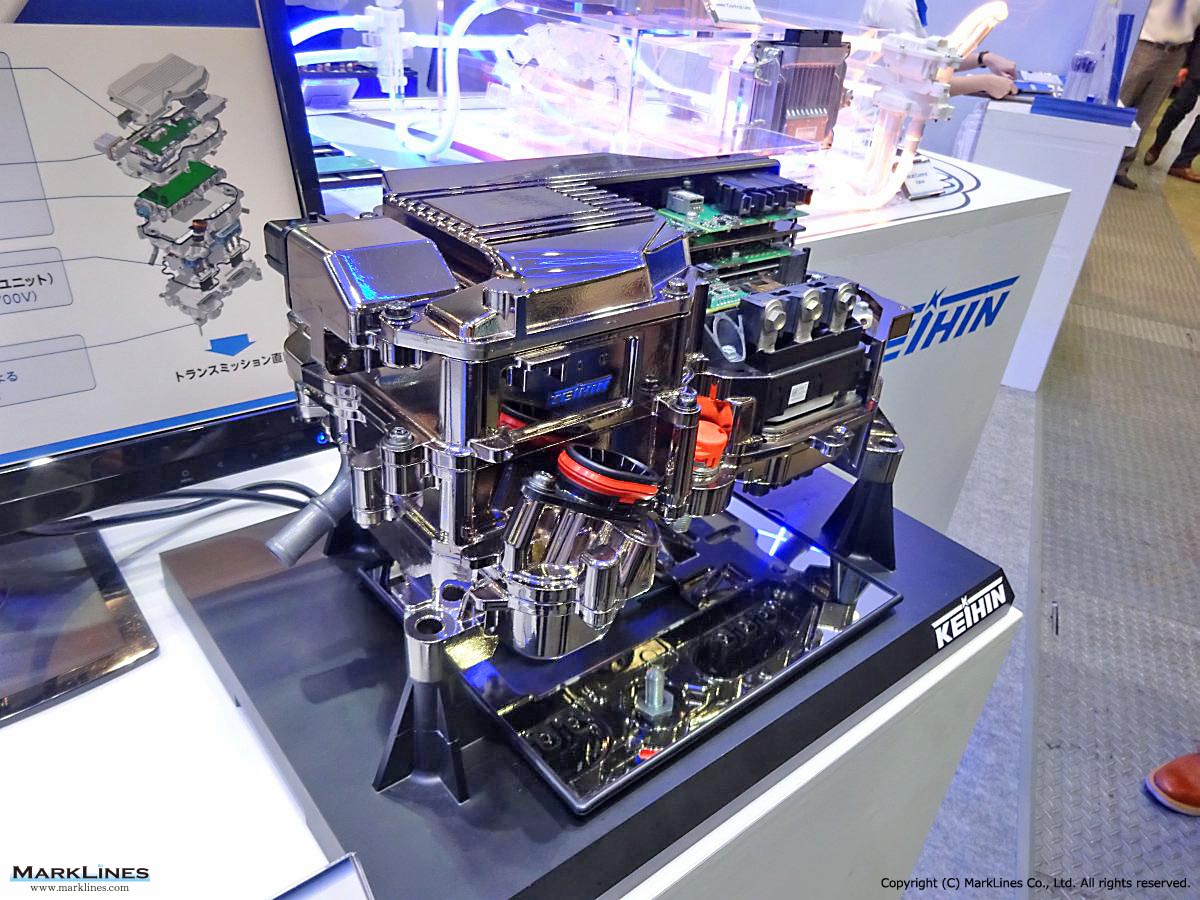
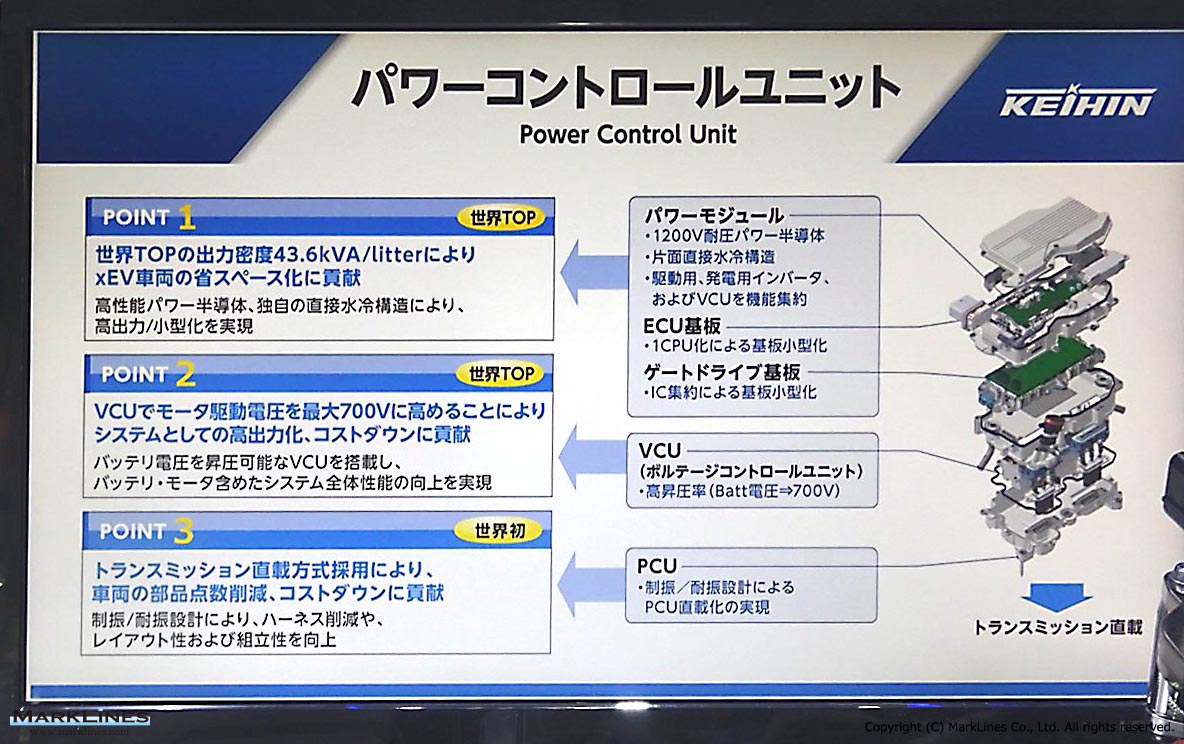
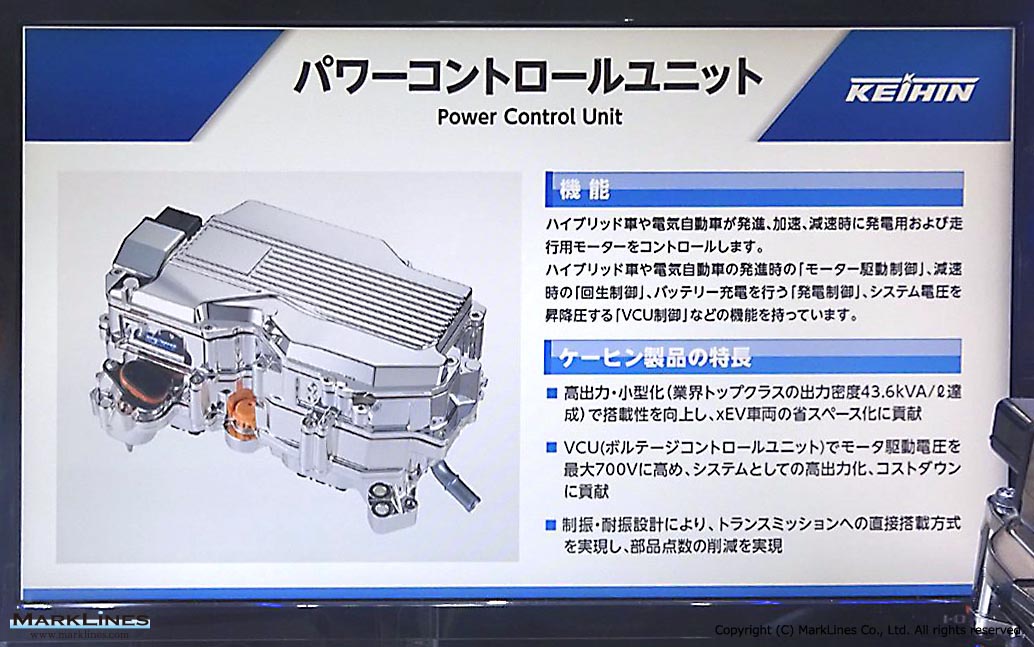
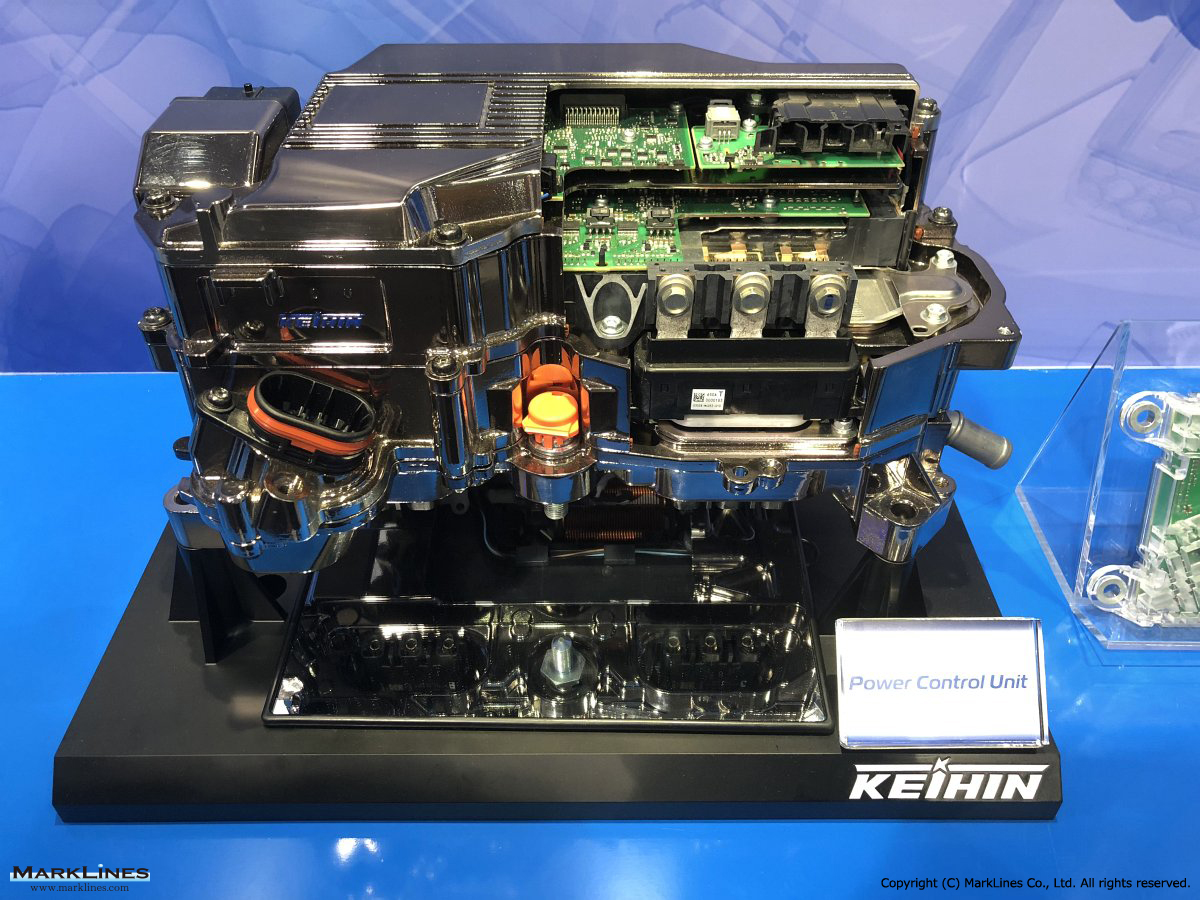
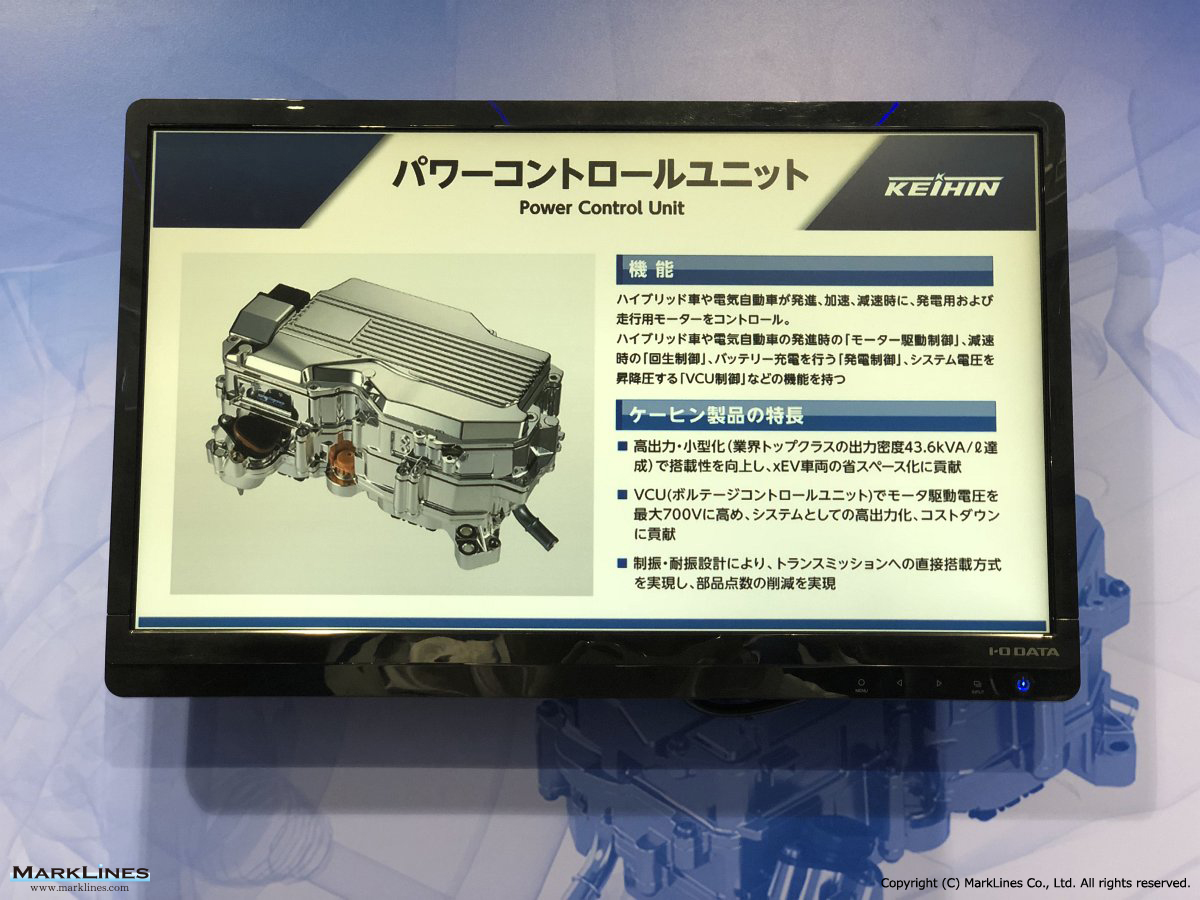
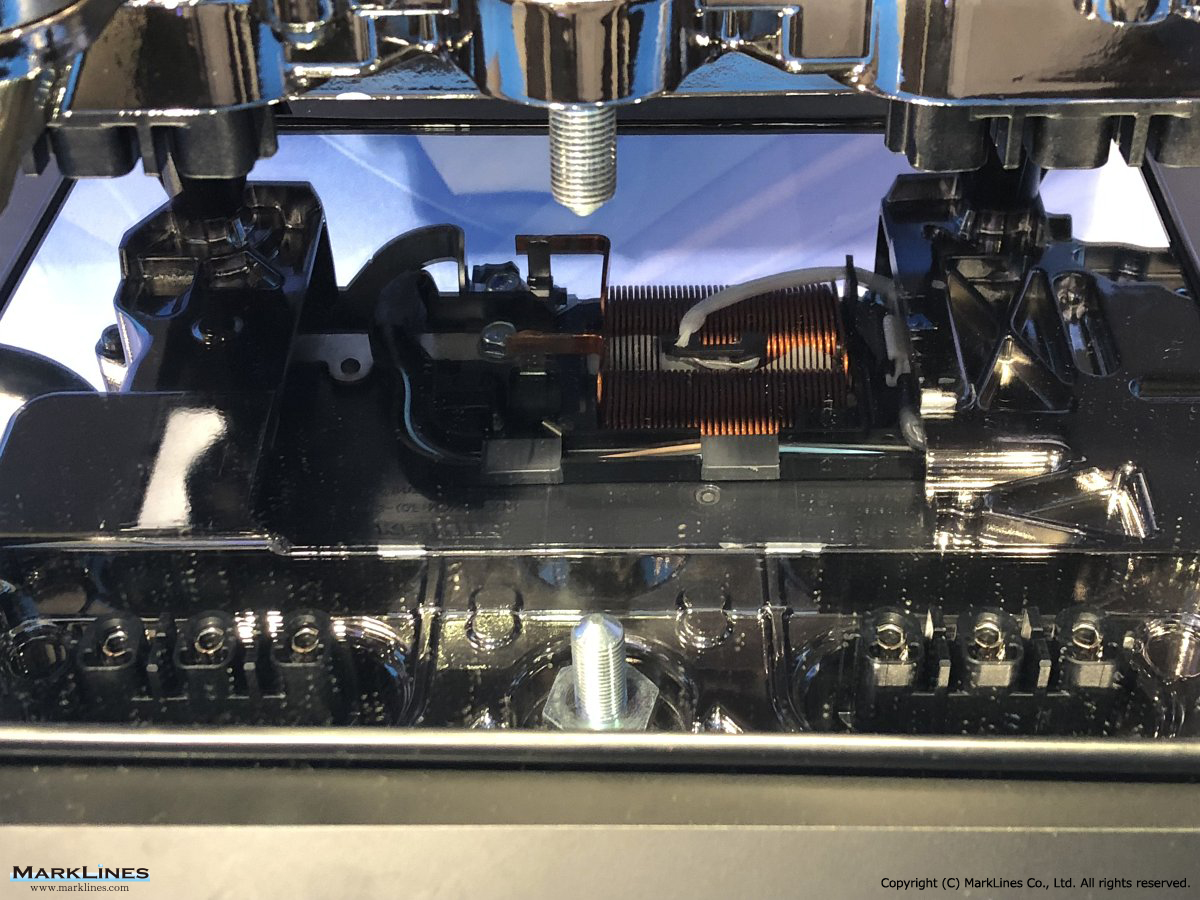
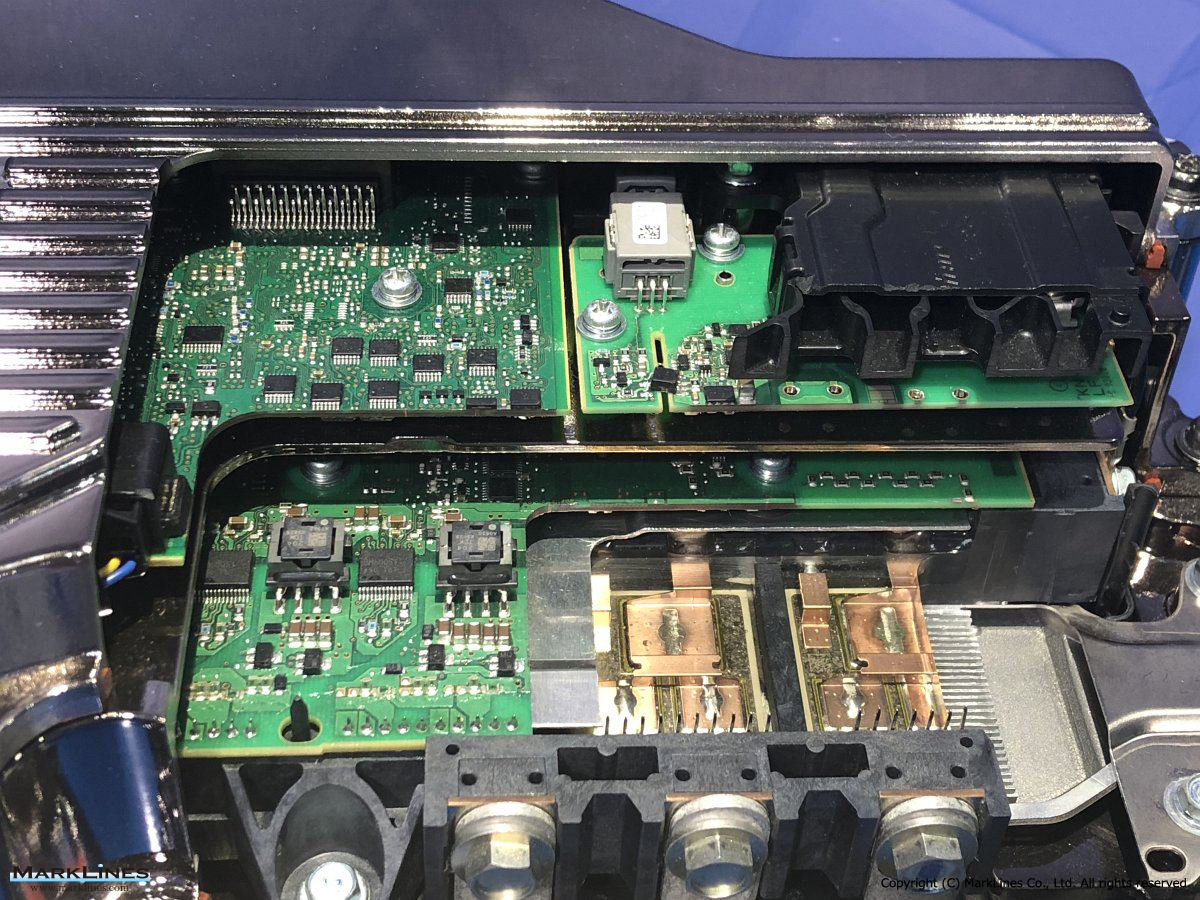
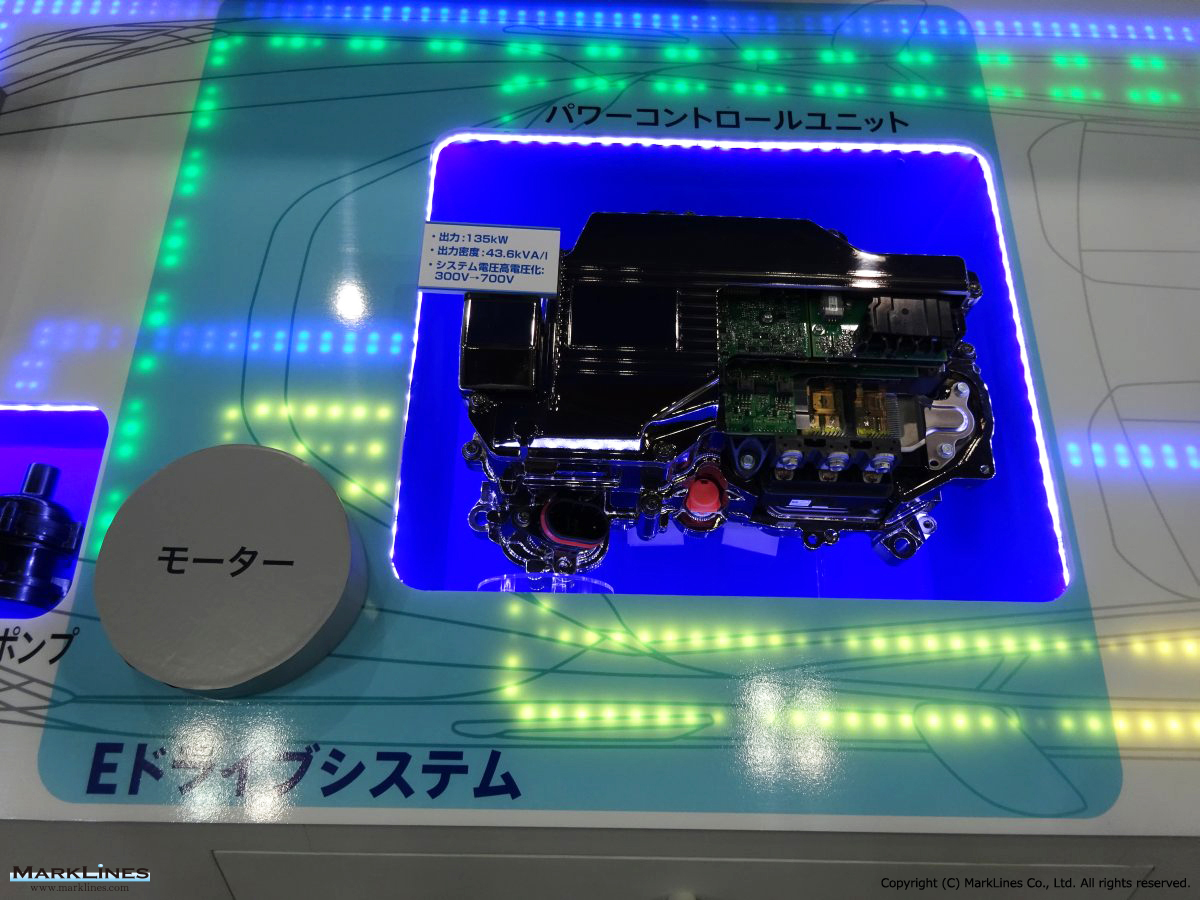
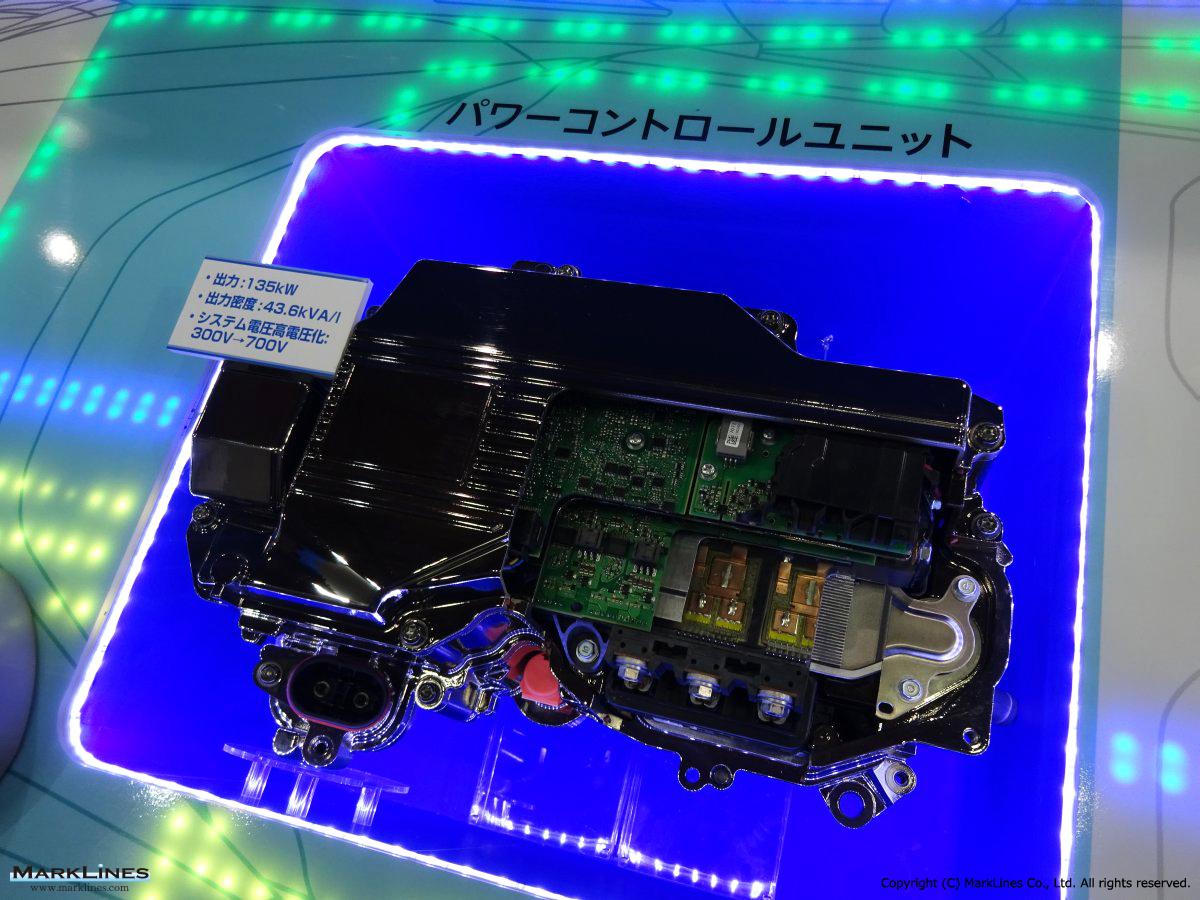
Power Control Unit
 4
4
Power Control Unit
 2
2
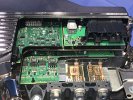
Power control unit
 3
3
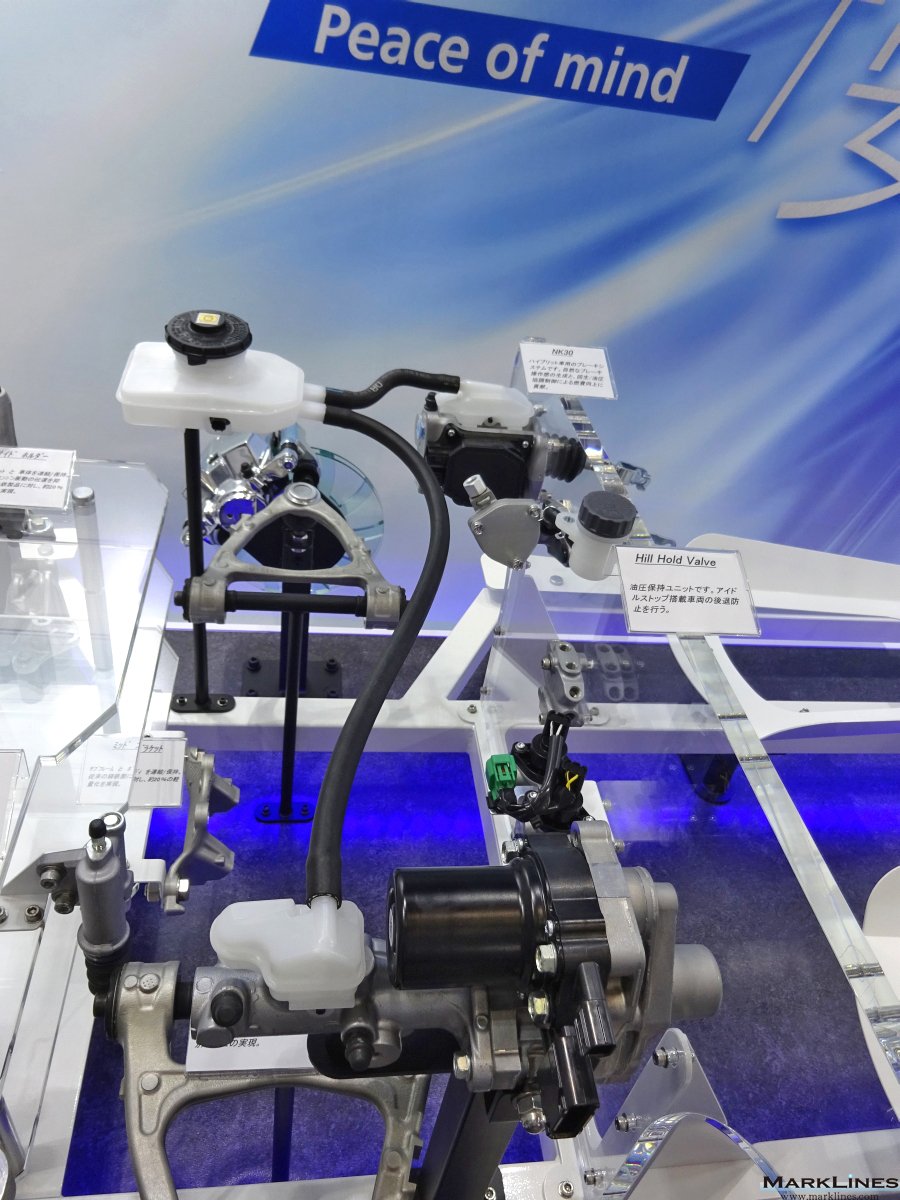
Electric servo brake -NK30-
 4
4
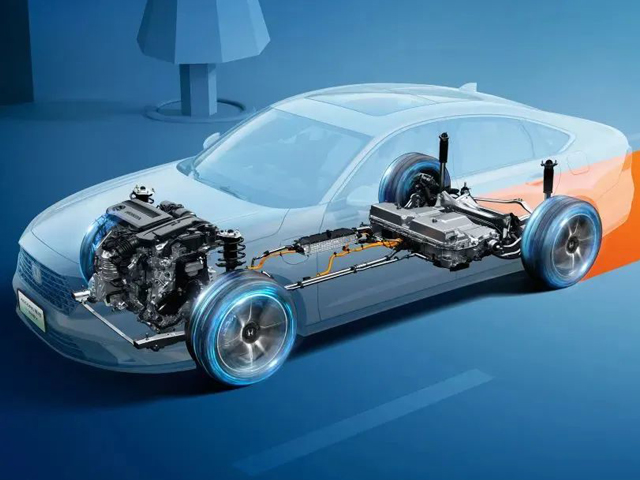
Accord / Inspire e:PHEV
 2
2
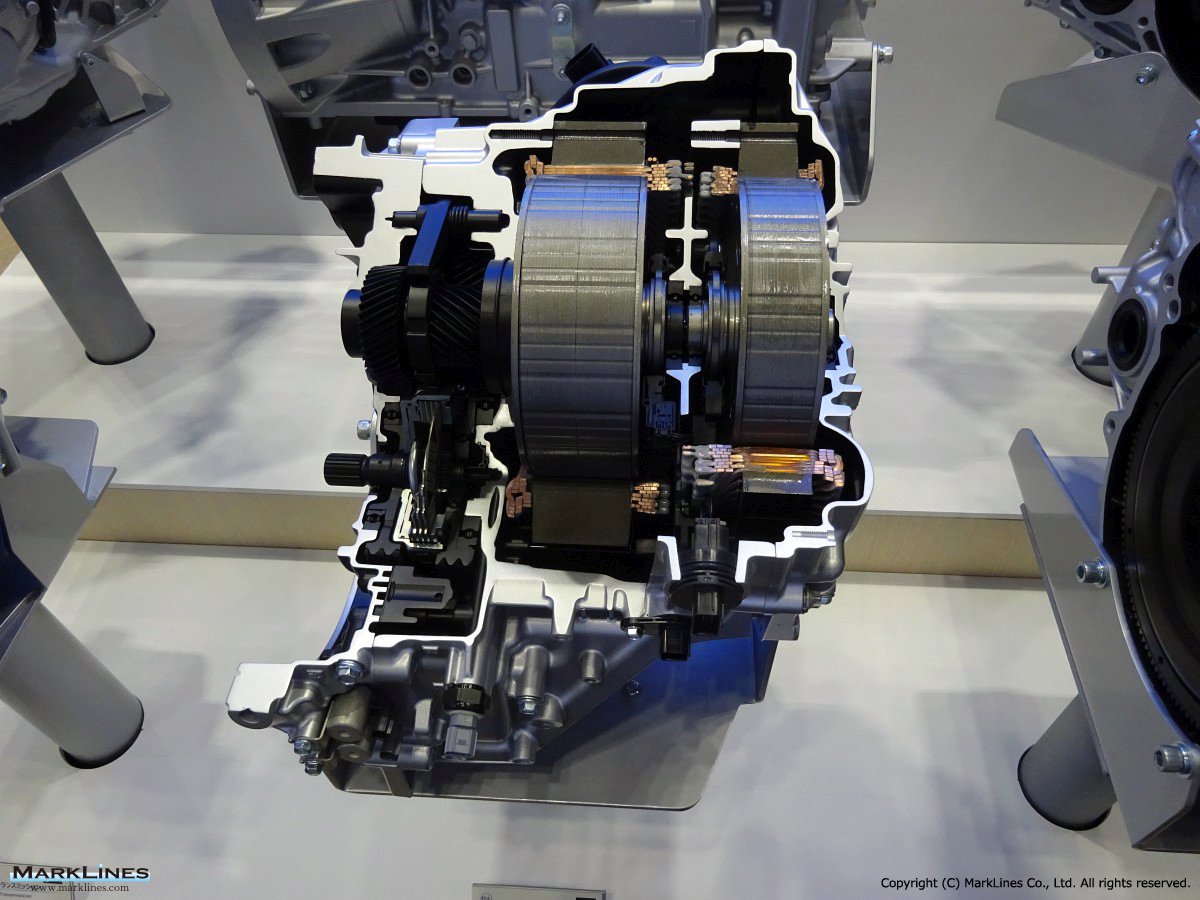
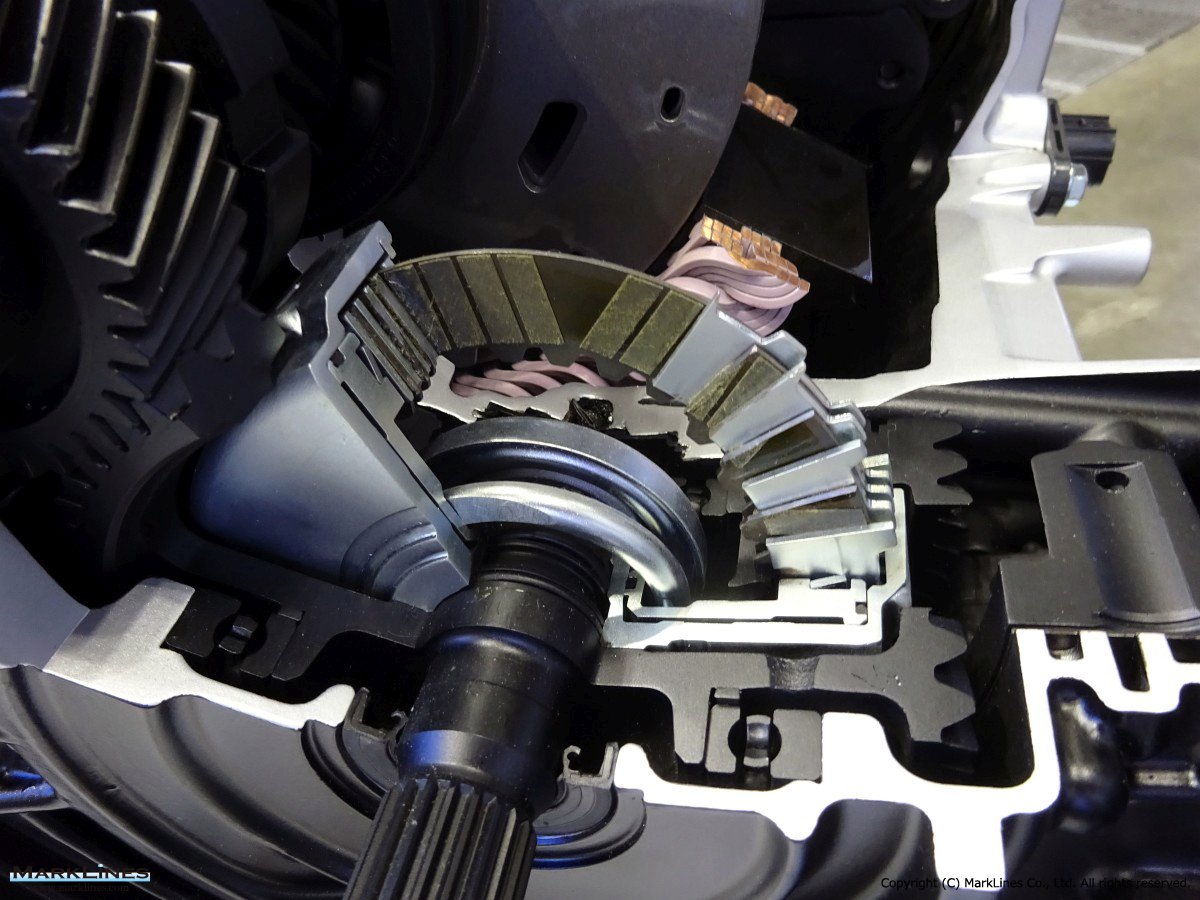
Clutch for Hybrid Transmission
 2
2
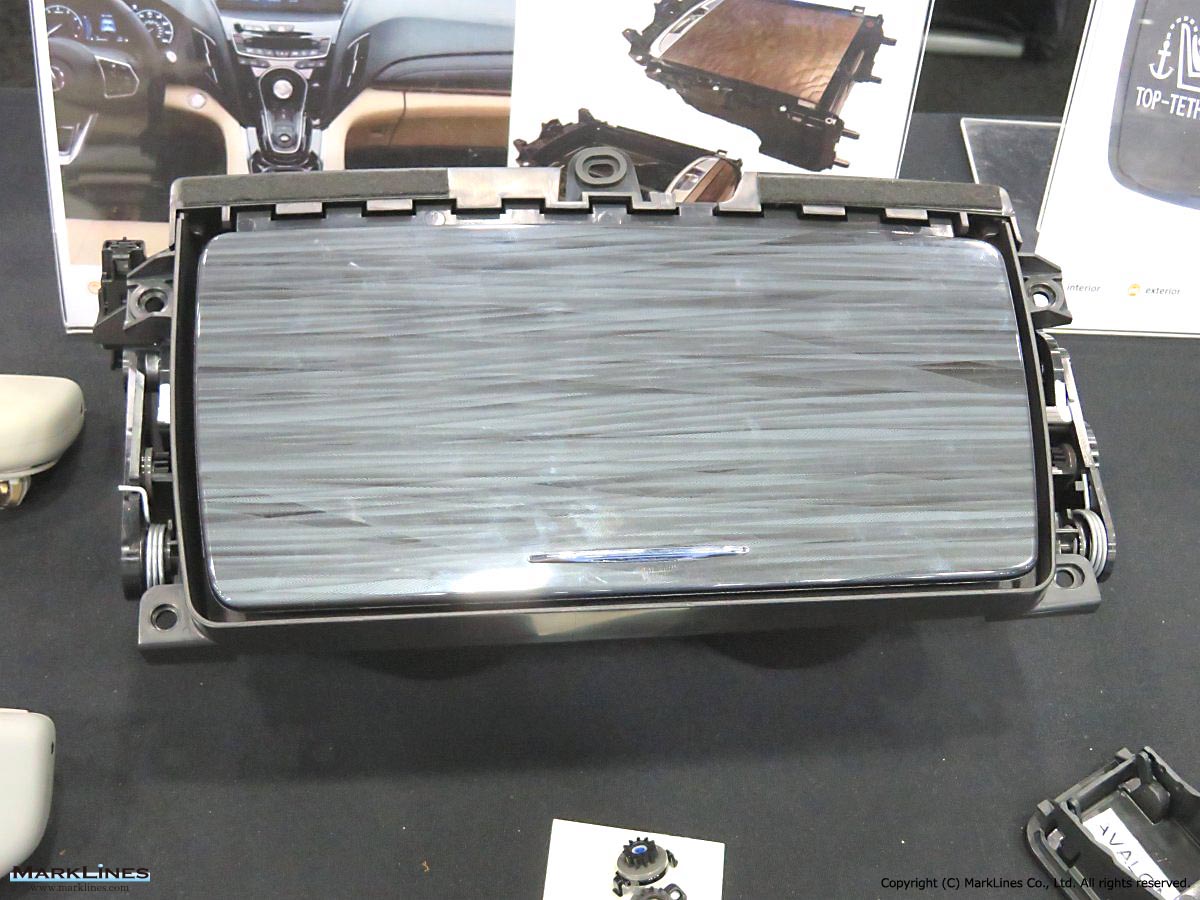
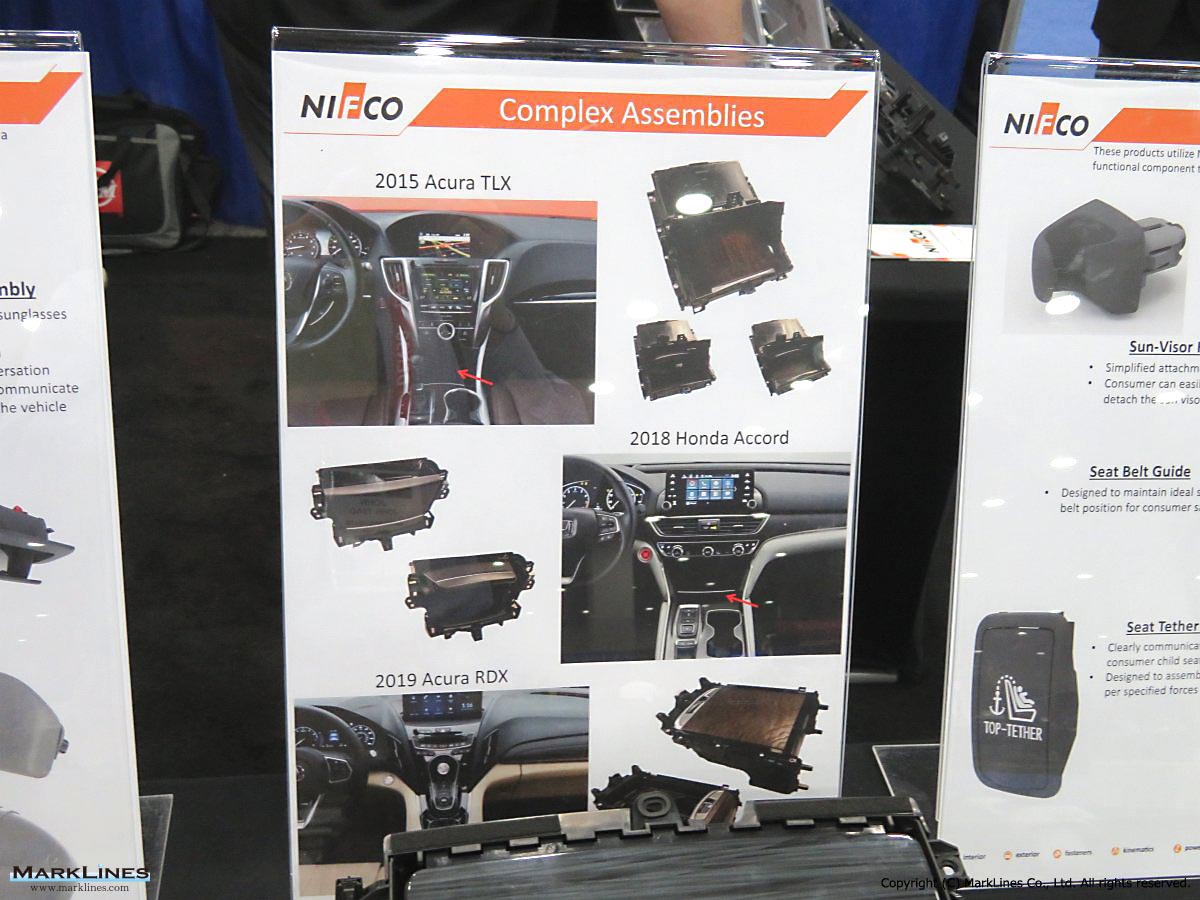
Center console storage area assembly
Sort by :
1 - 7 of 7 results
Data changes for Production Statistics
san" to "Venucia". Jun. 19, 2014 The maker/brand, Chinese OEMs, and manufacturers of "Liebao" have been changed. Refer to the chart below for details. Download Jun. 10, 2014 Descriptions of some of groups have been changed. Maker/Brand Previous Group New Group Everus, CIIMO Other Groups Honda Baojun Other Groups GM Group Oct. 23, 2013 Porsche has been classified as part of the VW group since 2013. May 16, 2013 The Maker/Bran...
Automotive Production Data Updated at: 2026/06/10
China - Flash report, Automotive production volume, 2023
/y). Passenger vehicle (PV) production and sales volumes remained good amid recovering auto consumption, and commercial vehicle (CV) production and sales volumes were lifted by factors such as a recovery in the logistics industry. New Energy Vehicle (NEV) and vehicle exports maintained rapid growth.According to the CAAM, as national policies of stabilizing economic growth have been taking effect and measures such as regional subsidies and promoti...
Automotive Production Data Updated at: 2025/06/04
China - Flash report, Automotive production volume, 2022
,012 -47.5% 292,765 365,930 -20.0% 6 Tesla Model 3 21,488 28,378 -24.3% 262,653 279,882 -6.2% 7 Toyota Corolla/New Corolla 14,418 34,840 -58.6% 252,978 319,673 -20.9% 8 Toyota Camry 8,977 28,435 -68.4% 248,470 216,178 14.9% 9 Changan/Chana CS75 28,593 20,560 39.1% 241,001 259,329 -7.1% 10 Honda Accord 16,018 23,478 -31.8% 236,797 198,629 19.2% Source: MarkLines Data Center Flash report, Nov 2022 Dec 9, 2022 *There are cases where r...
Automotive Production Data Updated at: 2025/06/04
China - Flash report, Automotive production volume, 2021
Haval H6 31,325 54,651 -42.7% 323,918 315,376 2.7% 5 Toyota Corolla/New Corolla 31,021 35,669 -13.0% 284,833 311,331 -8.5% 6 Tesla Model 3 28,900 20,810 38.9% 251,504 114,214 120.2% 7 Tesla Model Y 28,065 - -% 167,572 - -% 8 MG (2006-) MG ZS SUV 27,573 17,362 58.8% 116,199 80,801 43.8% 9 Honda Vezel 26,153 15,457 69.2% 159,282 131,844 20.8% 10 Nissan 14th Sylphy/Sylphy 25,251 30,893 -18.3% 227,161 219,330 3.6% Source: MarkLines Da...
Automotive Production Data Updated at: 2025/06/04
China - Flash report, Production volume, 2020
297,614 303,776 -2.0% 4 Buick Excelle GT 39,363 19,058 106.5% 253,168 244,314 3.6% 5 Wuling Wuling Hongguang 36,716 42,572 -13.8% 219,593 324,935 -32.4% 6 Toyota Corolla/New Corolla 35,669 40,179 -11.2% 311,331 320,070 -2.7% 7 Changan/Chana CS75 35,374 31,071 13.8% 238,710 167,762 42.3% 8 Honda CR-V 31,905 24,609 29.6% 209,949 191,531 9.6% 9 VW Sagitar 31,076 30,784 0.9% 270,873 263,622 2.8% 10 Nissan 14th Sylphy/Sylphy 30,893 23,65...
Automotive Production Data Updated at: 2025/06/04
China - Flash report, Production volume, 2019
70 17.9% 358,926 371,536 -3.4% 5 Nissan Bluebird Sylphy/Sylphy 27,800 47,159 -41.1% 348,182 486,381 -28.4% 6 VW Sagitar 32,870 29,391 11.8% 296,492 317,690 -6.7% 7 Buick Excelle GT 26,012 25,626 1.5% 270,326 264,719 2.1% 8 VW New Bora (Model X) 36,042 2,279 1481.5% 266,515 146,203 82.3% 9 Honda Civic 19,394 22,561 -14.0% 243,695 219,900 10.8% 10 VW Santana 23,340 27,442 -14.9% 239,873 269,410 -11.0% Source: MarkLines Data Center ...
Automotive Production Data Updated at: 2020/01/21
China - Flash report, Production volume, 2018
Lavida 31,828 37,893 -16.0% 249,431 268,314 -7.0% 5 VW Jetta 28,949 28,709 0.8% 137,421 169,357 -18.9% 6 VW Sagitar 27,074 31,661 -14.5% 195,664 182,574 7.2% 7 Haval Haval H6 25,976 30,065 -13.6% 239,311 250,779 -4.6% 8 Wuling Wuling Hongguang 23,320 37,580 -37.9% 262,108 306,160 -14.4% 9 Honda Accord 21,730 11,231 93.5% 93,742 79,200 18.4% 10 Honda Civic 21,341 16,617 28.4% 121,000 100,128 20.8% Source: MarkLines Data Center F...
Automotive Production Data Updated at: 2019/01/29


 Japan
Japan USA
USA Mexico
 Germany
 China (Shanghai)
 Thailand
 India
India