


Search Results by Category
All information related to {{ key_word }}.
AI Navigator will guide you. Click here for information about {{ key_word }}.
Images
 2
2
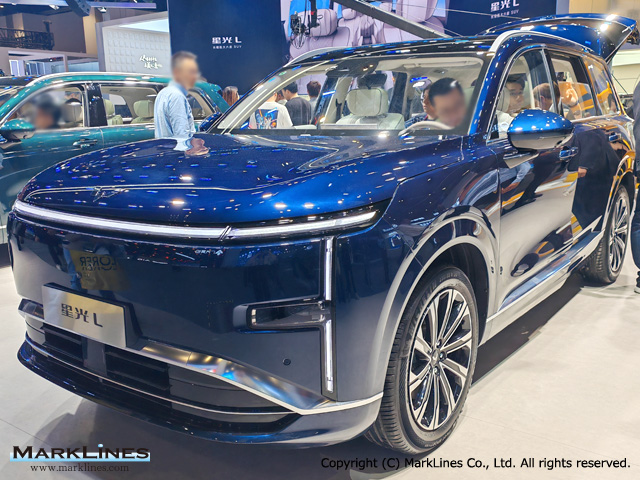
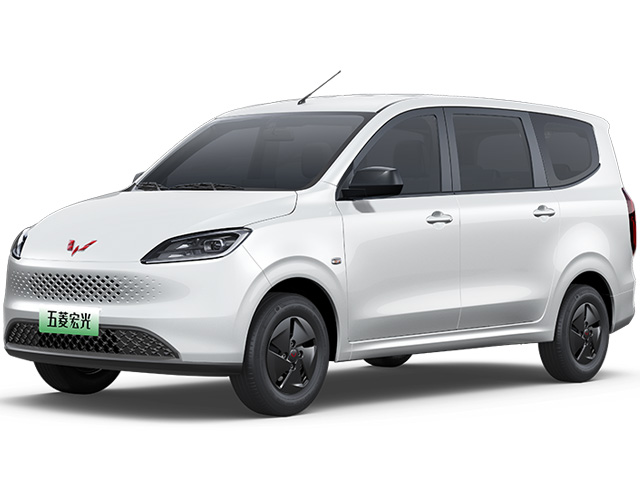
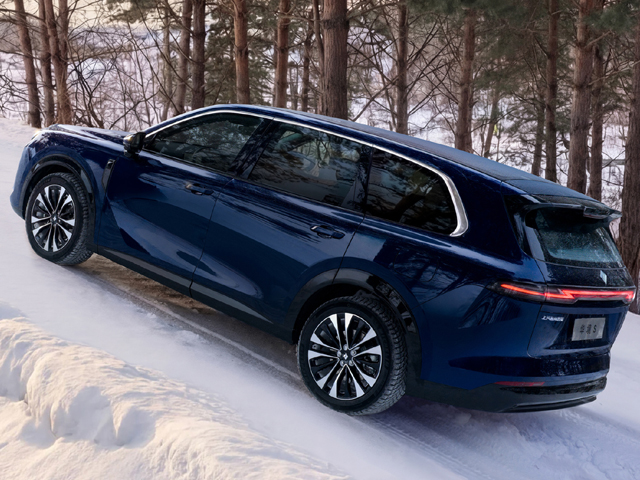
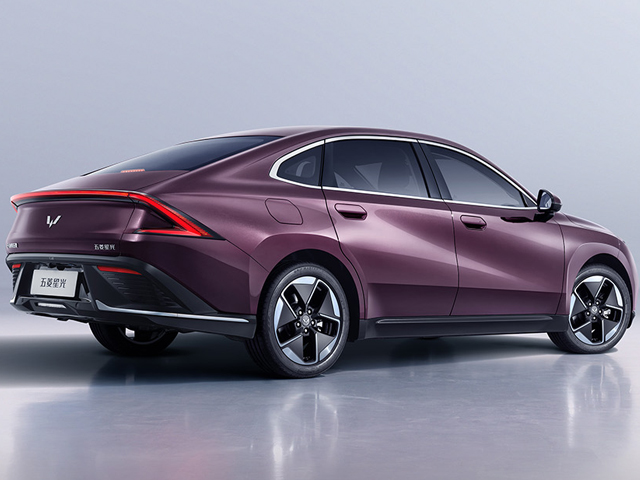
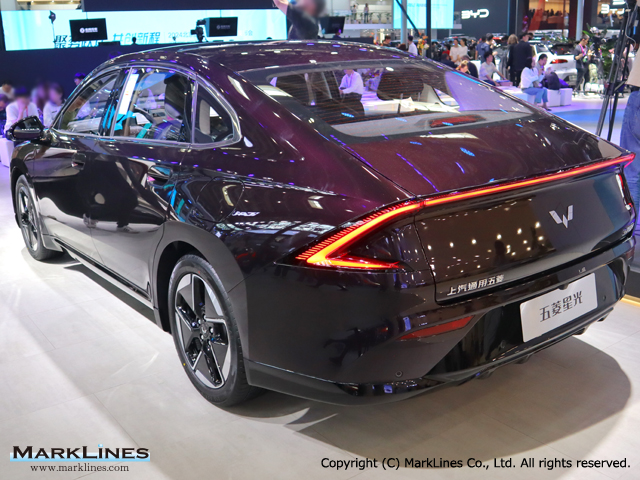
Wuling Xingguang L
 3
3
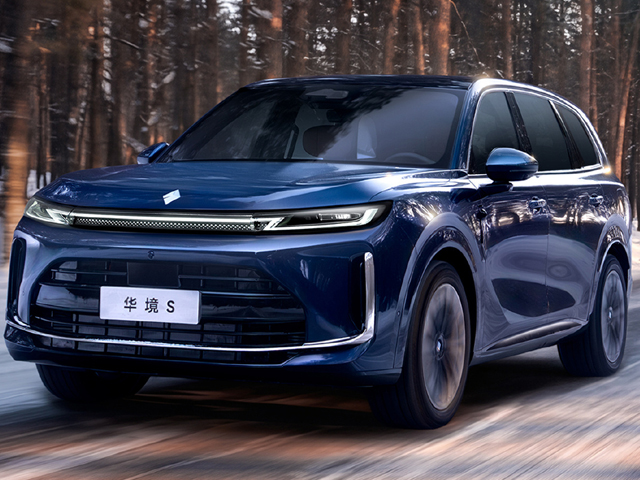
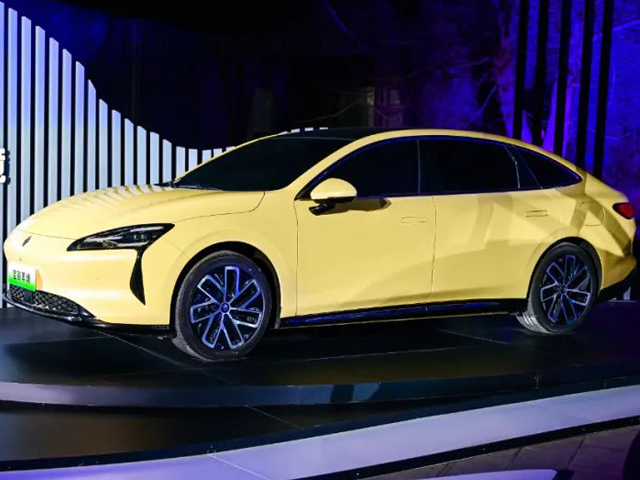
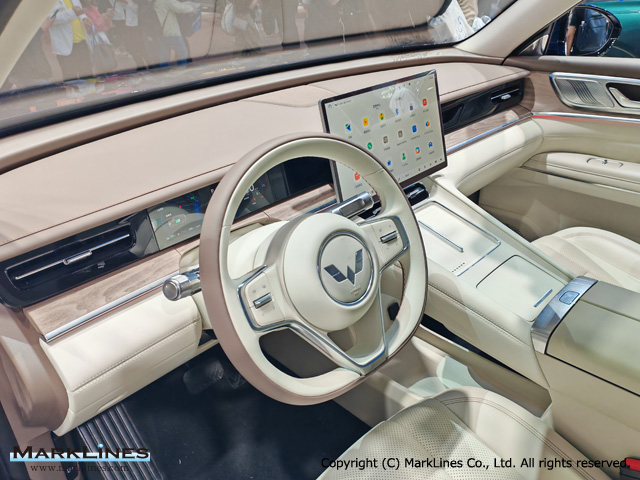
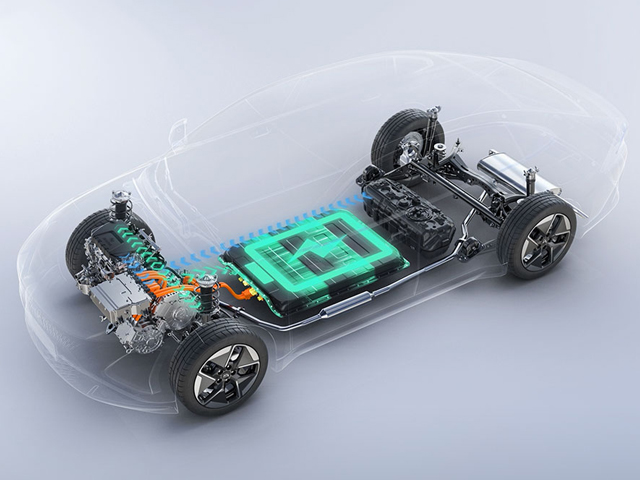
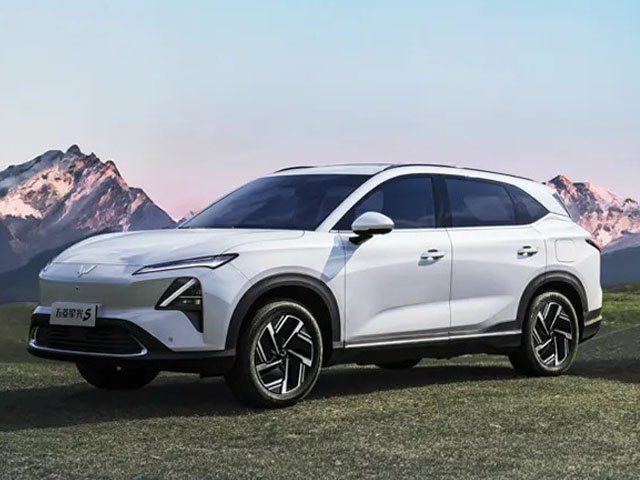
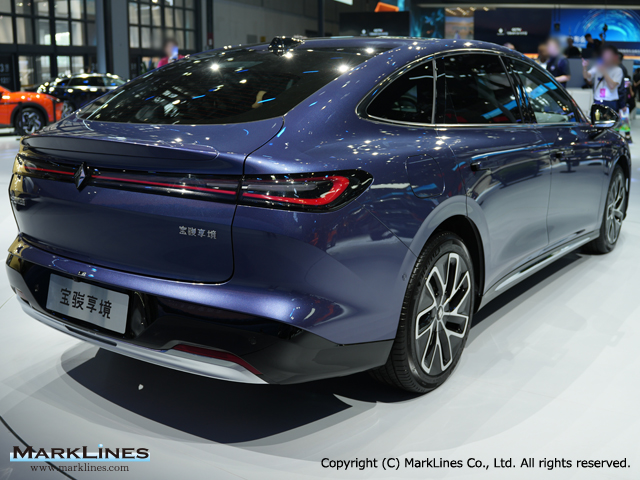
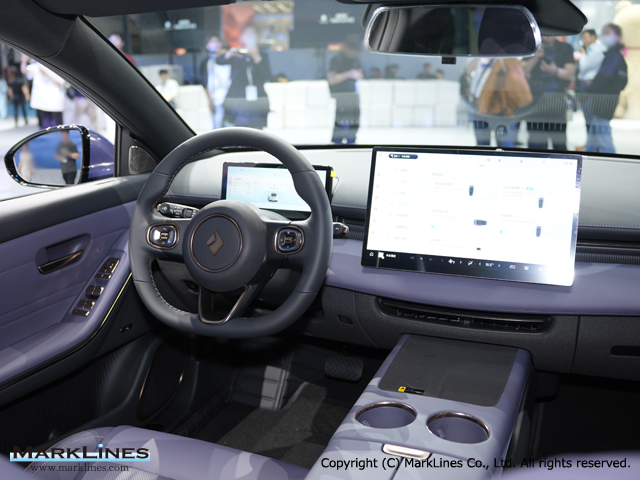
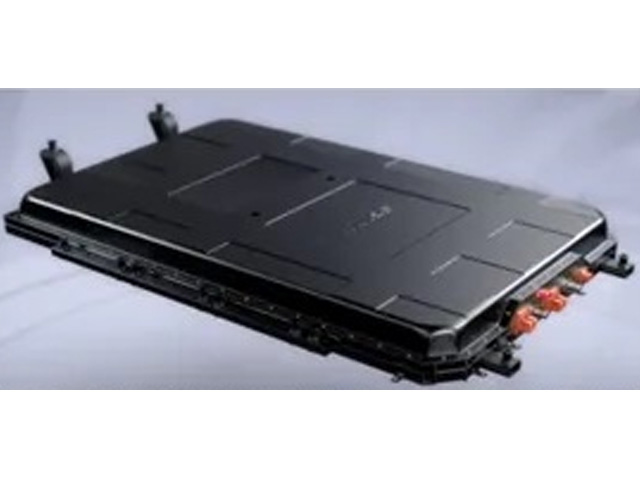
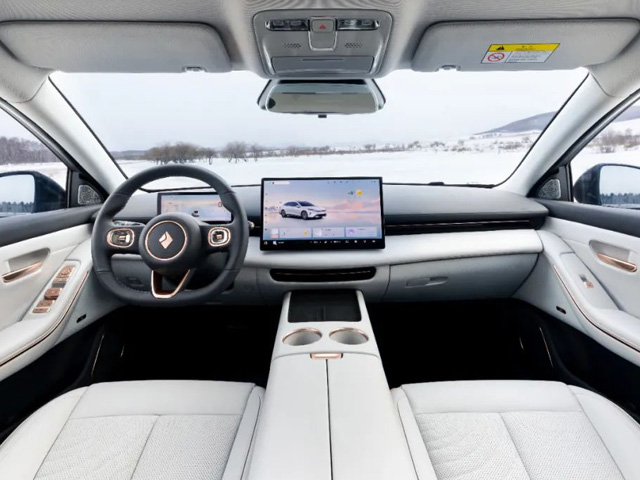
Baojun Huajing S PHEV
 7
7
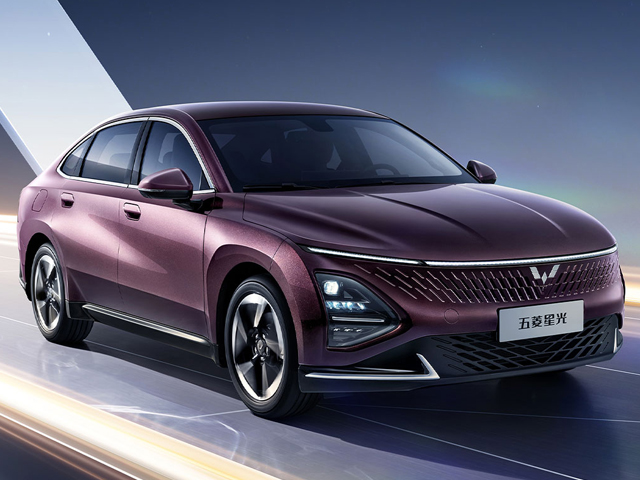
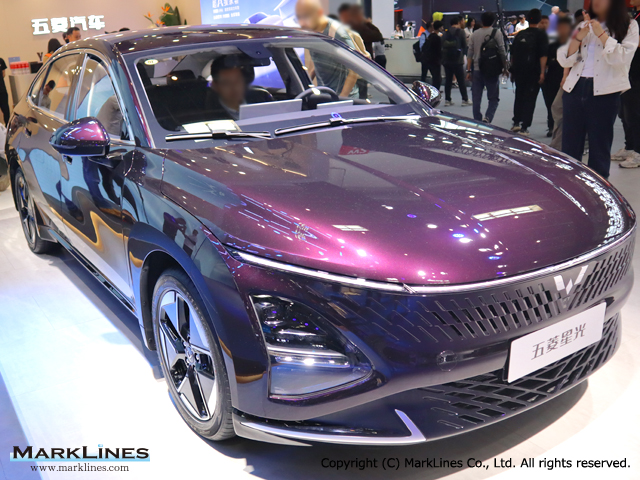
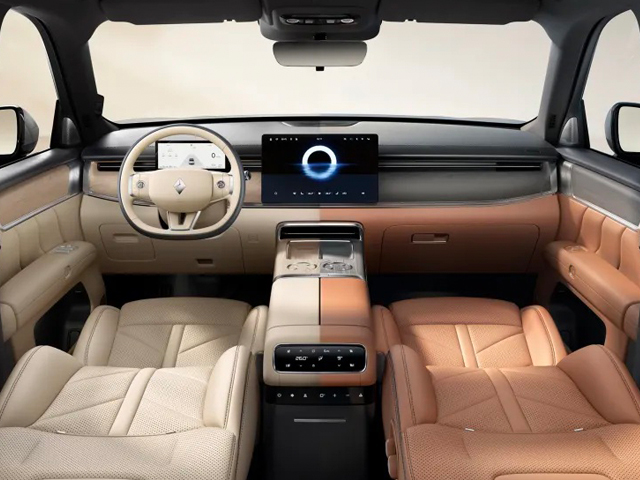
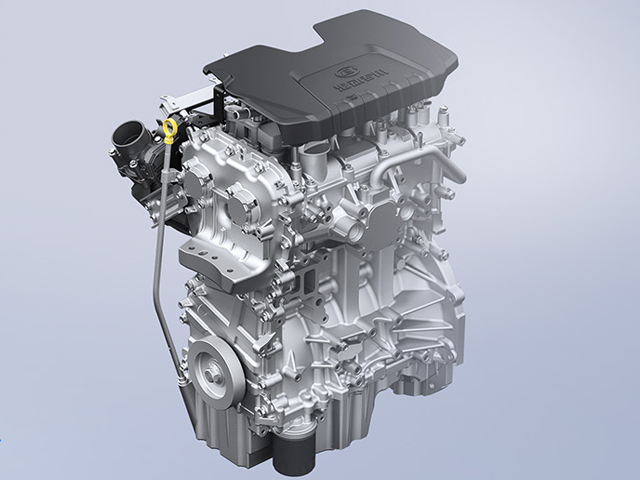
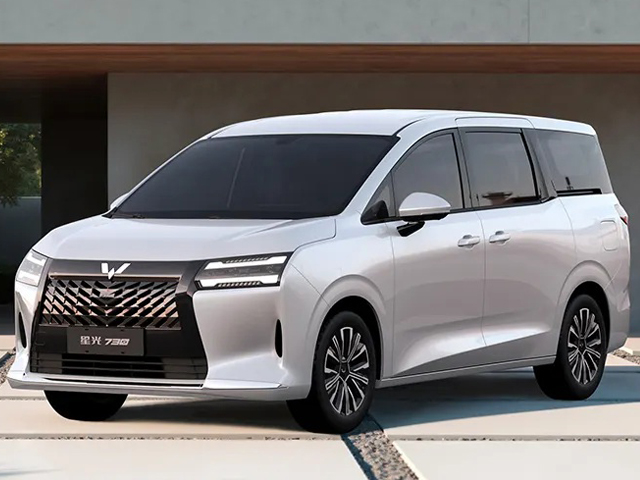
Wuling Xingguang, Xingguang S/560, Xingguang 730 PHEV
 5
5
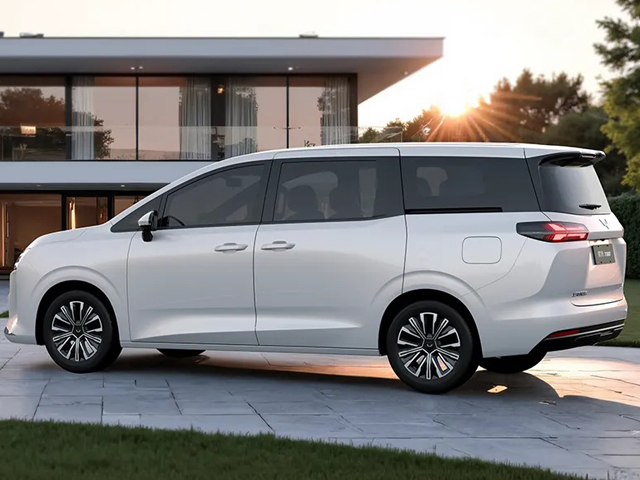
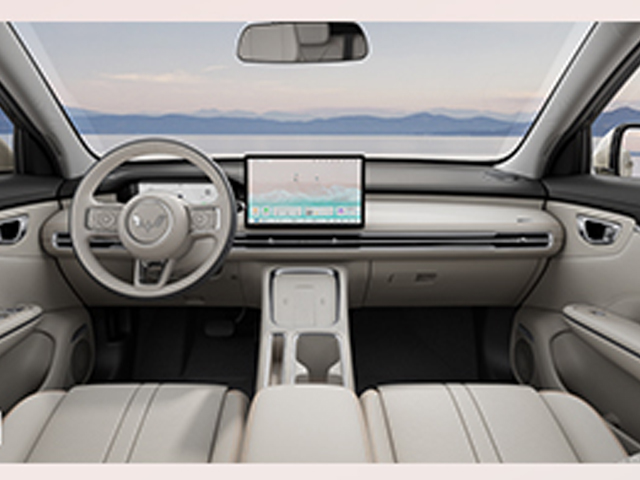
Wuling Xingguang, Xingguang S/560, Xingguang 730 EV
 2
2
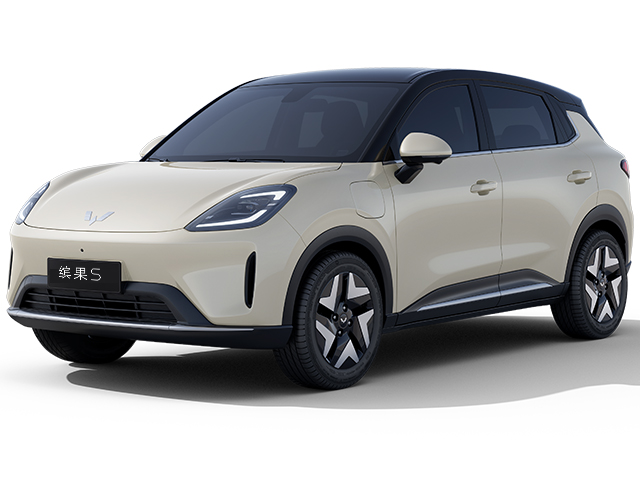
Wuling Bingo S
 1
1
Wuling Hongguang REEV
 5
5
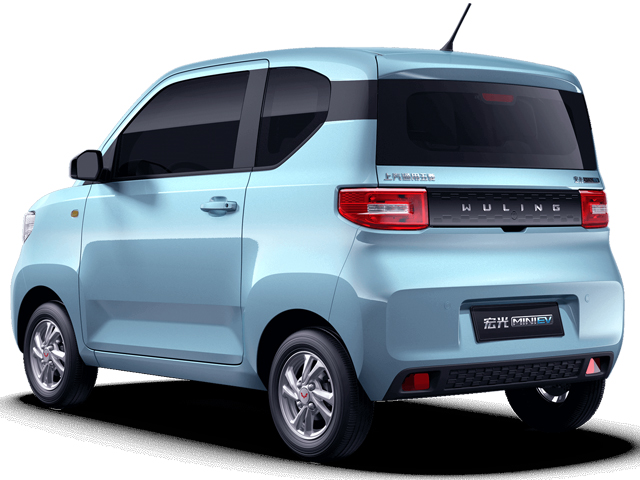
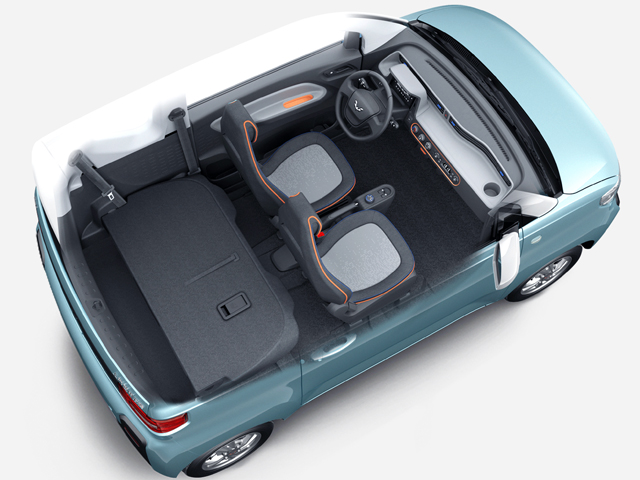
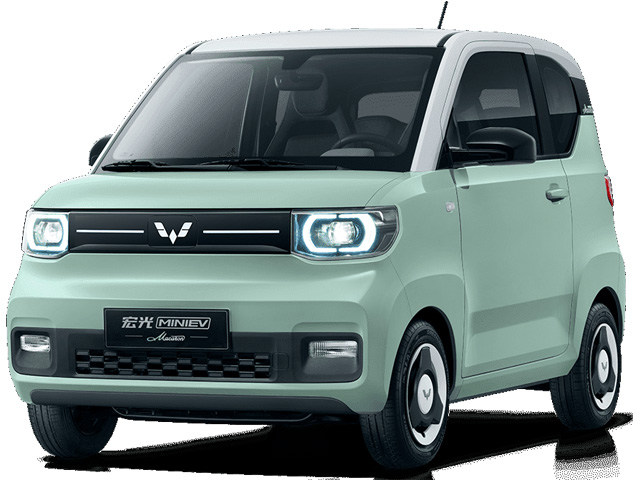
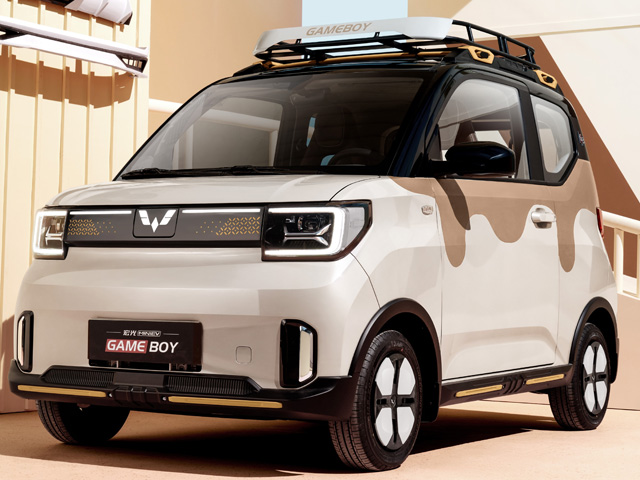
Wuling Hongguang MINI EV/Macaron/Gameboy/Convertible/4-door
 4
4
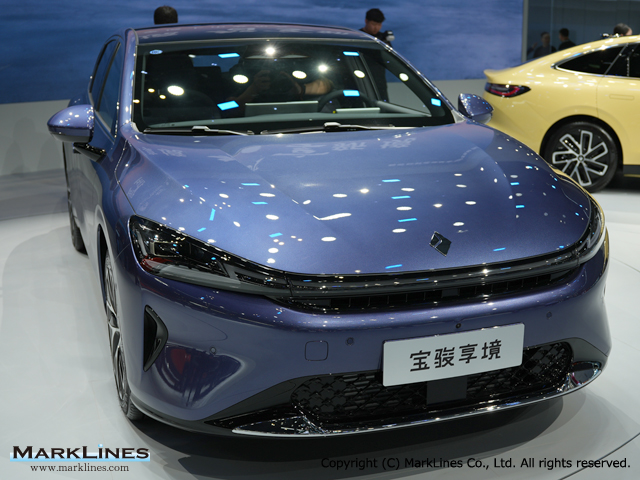
Baojun Xiangjing EV
 2
2
Baojun Xiangjing PHEV
 2
2
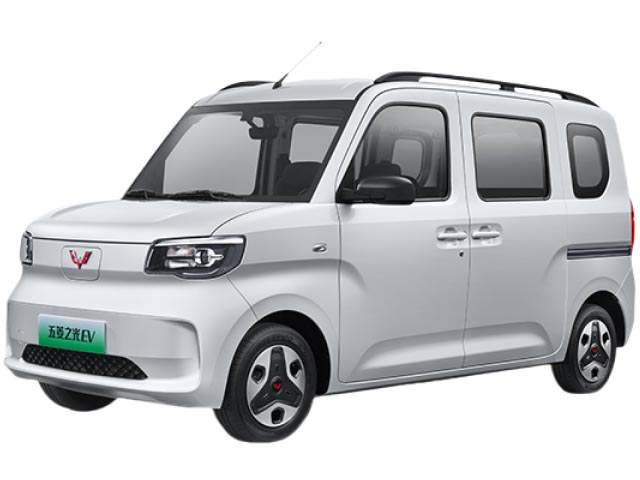
Wuling Sunshine EV
Sort by :
1 - 10 of 10 results
Data changes for Production Statistics
y, Italy, Portugal, Spain, Sweden, UK, Czech Republic, Hungary, Poland, Slovenia, Slovakia, Turkey, Morocco, South Africa, Iran Maker/Brand Dates of changes Remarks Feb. 27, 2026 The group of some makers and brands has been changed. As a result, by-group figures will also change.- Baojun, Wuling, TQ WulingPrevious Group: GM GroupNew Group: SAIC (Shanghai Automotive Industry Corporation (Group)) Oct. 29, 2025 The "Hyundai/Inokom" and "...
Automotive Production Data Updated at: 2026/03/17
China - Automotive production in 2025 by OEM, model, vehicle type
tion Top 10 models - Maker/Brand Model Dec. 2025 Dec. 2024 Y-o-Y Jan.-Dec. 2025 Jan.-Dec. 2024 Y-o-Y 1 Tesla Model Y 59,108 49,306 19.9% 539,854 556,003 -2.9% 2 BYD Auto Seagull 44,598 57,493 -22.4% 526,777 480,446 9.6% 3 Geely Geely Xingyuan 50,141 23,005 118.0% 486,265 62,011 684.2% 4 Wuling Wuling Hongguang MINIEV 14,001 42,896 -67.4% 446,458 225,706 97.8% 5 BYD Auto Song PLUS 21,232 55,595 -61.8% 391,623 515,151 -24.0% 6 BYD A...
Automotive Production Data Updated at: 2026/02/12
China - Automotive production in 2024 by OEM, model, vehicle type
-% 250,753 - -% 4 Tesla Model Y 53,476 58,471 -8.5% 506,697 586,962 -13.7% 5 BYD Auto Haibao/Seal 06 39,015 - -% 210,865 - -% 6 BYD Auto Qin PLUS 37,861 39,699 -4.6% 419,177 418,789 0.1% 7 BYD Auto Han 37,011 19,257 92.2% 228,720 210,314 8.8% 8 BYD Auto Song L 34,200 - -% 177,662 - -% 9 Wuling Wuling Hongguang MINIEV 34,105 24,641 38.4% 182,810 68,559 166.6% 10 Tesla Model 3 33,611 32,331 4.0% 322,962 276,923 16.6% Source: MarkLi...
Automotive Production Data Updated at: 2025/06/04
China - Flash report, Automotive production volume, 2023
YD Auto Song PLUS 45,104 - -% 378,302 - -% 4 BYD Auto Yuan PLUS 41,323 27,951 47.8% 381,072 178,768 113.2% 5 BYD Auto Qin PLUS 39,699 25,615 55.0% 418,789 291,437 43.7% 6 BYD Auto Dolphin 36,344 26,198 38.7% 336,720 180,263 86.8% 7 Tesla Model 3 32,331 32,549 -0.7% 276,923 241,165 14.8% 8 Wuling Wuling Bingo 32,326 - -% 185,325 - -% 9 Haval Haval H6 28,630 25,374 12.8% 247,329 270,696 -8.6% 10 Chery Tiggo 7 28,548 13,975 104.3% 208,...
Automotive Production Data Updated at: 2025/06/04
China - Flash report, Automotive production volume, 2022
77.5 83.4 PHV 19.4 24.4 132.4 158.8 22.5 164.1 FCV 0.1 0.13 4.1 0.4 0.06 105.4 Total 79.5 100.0 51.8 705.8 100.0 96.9 Source:CAAM, Each maker's press releases China - Vehicle production Top 10 models - Maker/Brand Model Dec. 2022 Dec. 2021 Y-o-Y Jan.-Dec. 2022 Jan.-Dec. 2021 Y-o-Y 1 Wuling Wuling Hongguang MINIEV 77,900 56,613 37.6% 571,869 427,685 33.7% 2 Tesla Model Y 37,293 38,381 -2.8% 464,016 205,953 125.3% 3 BYD Auto Son...
Automotive Production Data Updated at: 2025/06/04
China - Flash report, Automotive production volume, 2021
2.1 7.1 Commercial Vehicles Total 38.0 13.1 -25.3 467.4 17.9 -10.7 Grand Total 290.7 100.0 2.4 2,608.2 100.0 3.4 Source:CAAM, Each maker's press releases China - Vehicle production Top 10 models - Maker/Brand Model Dec. 2021 Dec. 2020 Y-o-Y Jan.-Dec. 2021 Jan.-Dec. 2020 Y-o-Y 1 Wuling Wuling Hongguang MINIEV 56,613 32,121 76.2% 427,685 127,210 236.2% 2 VW Lavida 36,655 32,393 13.2% 392,056 415,212 -5.6% 3 Haval Haval H6 4...
Automotive Production Data Updated at: 2025/06/04
China - Flash report, Production volume, 2020
36,968 -17.4% 328,137 340,744 -3.7% 5 VW Sagitar 30,163 32,870 -8.2% 301,036 296,492 1.5% 6 Buick Excelle GT 41,682 26,012 60.2% 294,850 270,326 9.1% 7 Nissan Bluebird Sylphy/Sylphy 31,092 27,800 11.8% 281,552 348,182 -19.1% 8 Changan/Chana CS75 37,455 27,804 34.7% 276,165 195,566 41.2% 9 Wuling Wuling Hongguang 36,481 49,099 -25.7% 256,074 374,034 -31.5% 10 Nissan 14th Sylphy/Sylphy 33,369 22,269 49.8% 252,699 133,821 88.8% Source...
Automotive Production Data Updated at: 2025/06/04
China - Flash report, Production volume, 2019
-7.5 Source:CAAM, Each maker's press releases China - Vehicle production Top 10 models - Maker/Brand Model Dec. 2019 Dec. 2018 Y-o-Y Jan.-Dec. 2019 Jan.-Dec. 2018 Y-o-Y 1 VW Lavida 54,038 56,470 -4.3% 506,909 489,179 3.6% 2 Haval Haval H6 45,090 50,835 -11.3% 386,657 447,582 -13.6% 3 Wuling Wuling Hongguang 49,099 55,774 -12.0% 374,034 452,127 -17.3% 4 Toyota Corolla/New Corolla 38,856 32,970 17.9% 358,926 371,536 -3.4% 5 Nissa...
Automotive Production Data Updated at: 2020/01/21
China - Flash report, Production volume, 2018
rce:CAAM, Each maker's press releases China - Vehicle production Top 10 models - Maker/Brand Model Dec. 2018 Dec. 2017 Y-o-Y Jan.-Dec. 2018 Jan.-Dec. 2017 Y-o-Y 1 VW Lavida 56,470 47,626 18.6% 489,179 458,271 6.7% 2 Nissan Bluebird Sylphy/Sylphy 47,159 43,285 8.9% 486,381 404,394 20.3% 3 Wuling Wuling Hongguang 55,774 58,846 -5.2% 452,127 532,879 -15.2% 4 Haval Haval H6 50,835 54,113 -6.1% 447,582 483,481 -7.4% 5 Toyota Corolla/New...
Automotive Production Data Updated at: 2019/01/29
China - Flash report, Production volume, 2017
1.58 Commercial Vehicles Total 43.18 14.20 3.11 420.87 14.51 13.81 Grand Total 304.14 100.00 -0.70 2,901.54 100.00 3.19 Source:CAAM, Each maker's press releases China - Vehicle production Top 10 models - Maker/Brand Model Dec. 2017 Dec. 2016 Y-o-Y Jan.-Dec. 2017 Jan.-Dec. 2016 Y-o-Y 1 Wuling Wuling Hongguang 58,846 64,498 -8.8% 532,879 628,124 -15.2% 2 Haval Haval H6 54,113 76,884 -29.6% 483,481 590,804 -18.2% 3 VW Lavida 47,626...
Automotive Production Data Updated at: 2018/07/25


 Japan
Japan USA
USA Mexico
 Germany
 China (Shanghai)
 Thailand
 India
India