


Search Results by Category
All information related to {{ key_word }}.
AI Navigator will guide you. Click here for information about {{ key_word }}.
Images
 10
10
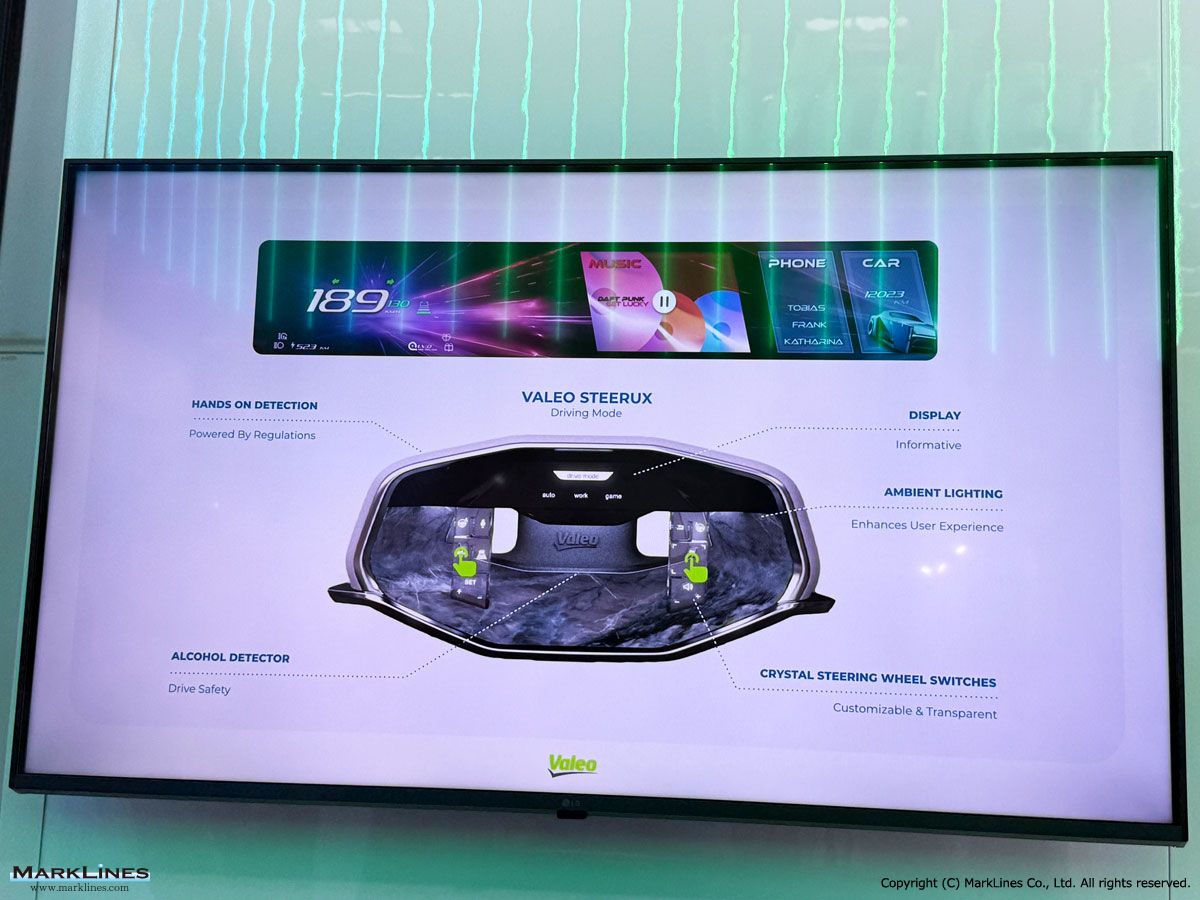
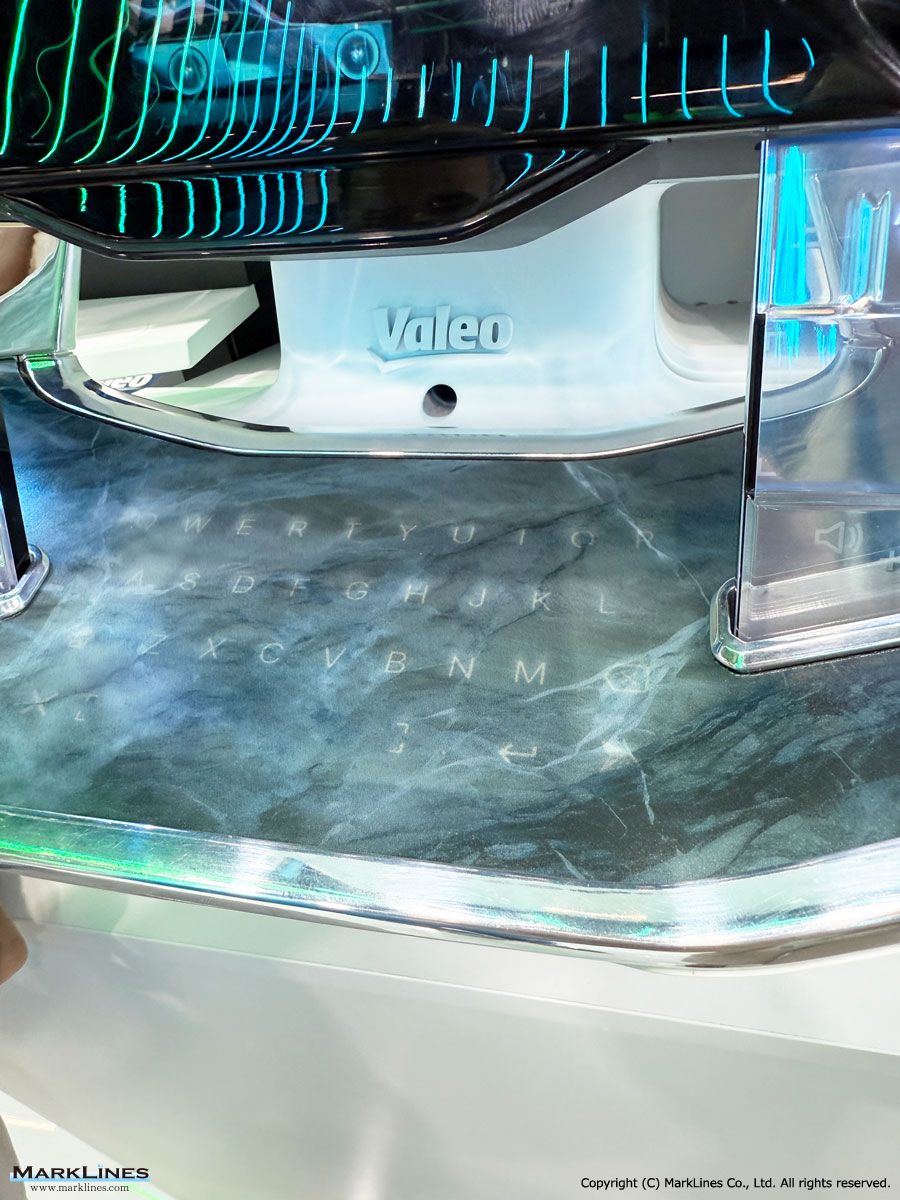
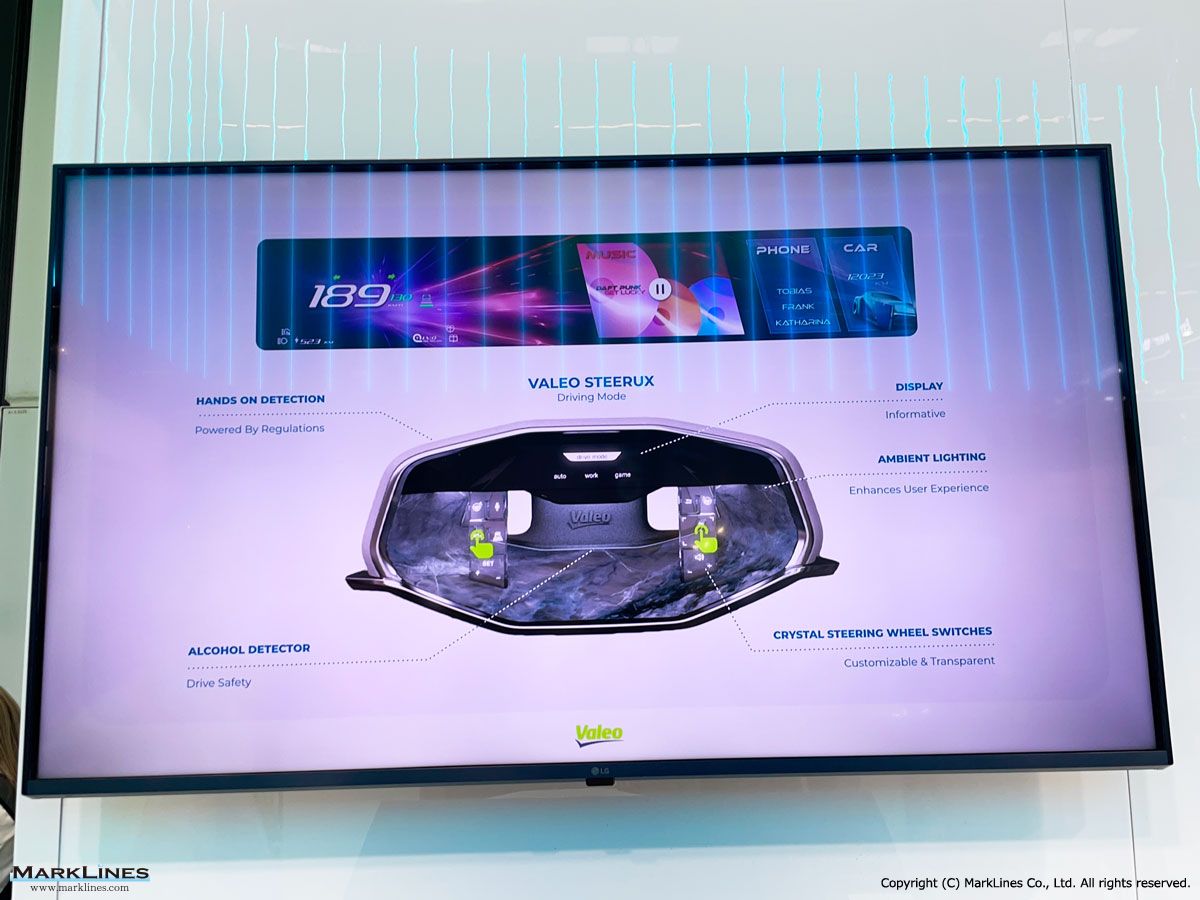
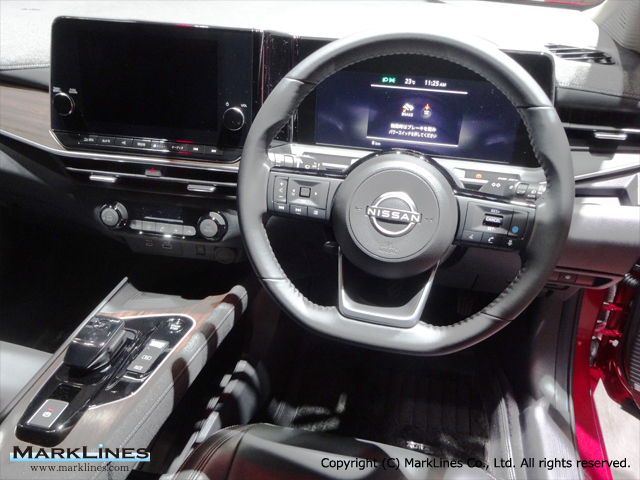
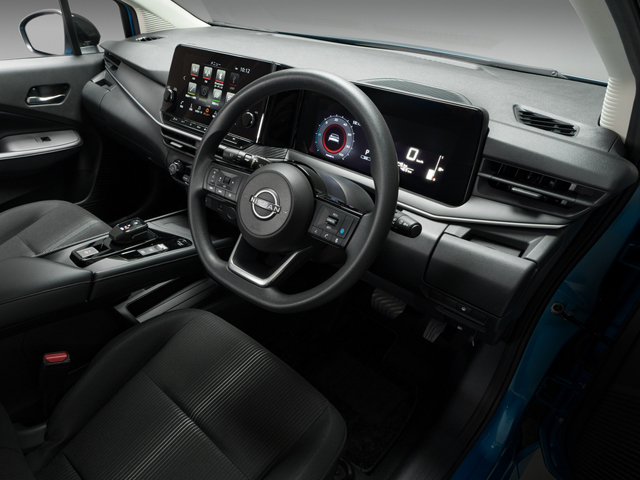
SteerUX (Next generation of steering wheel prototype)
 3
3
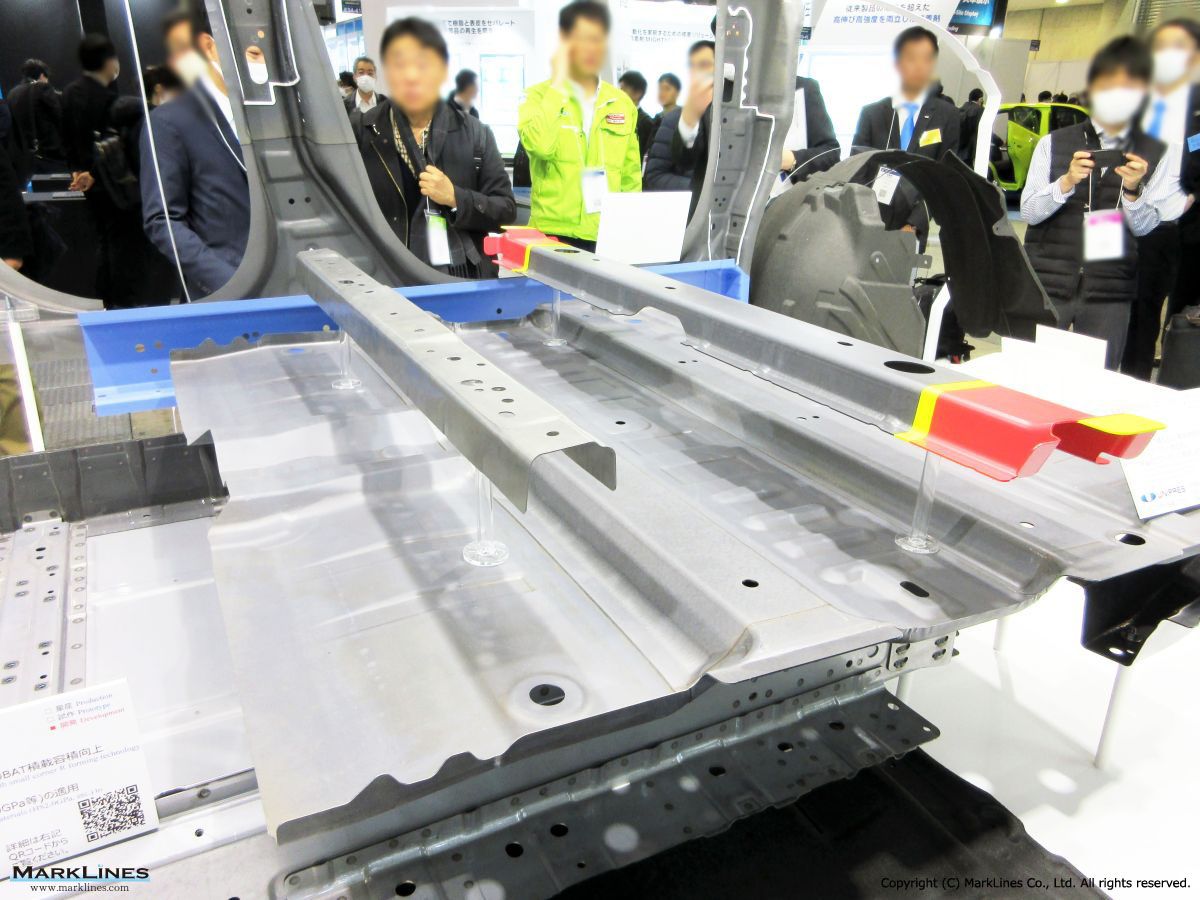
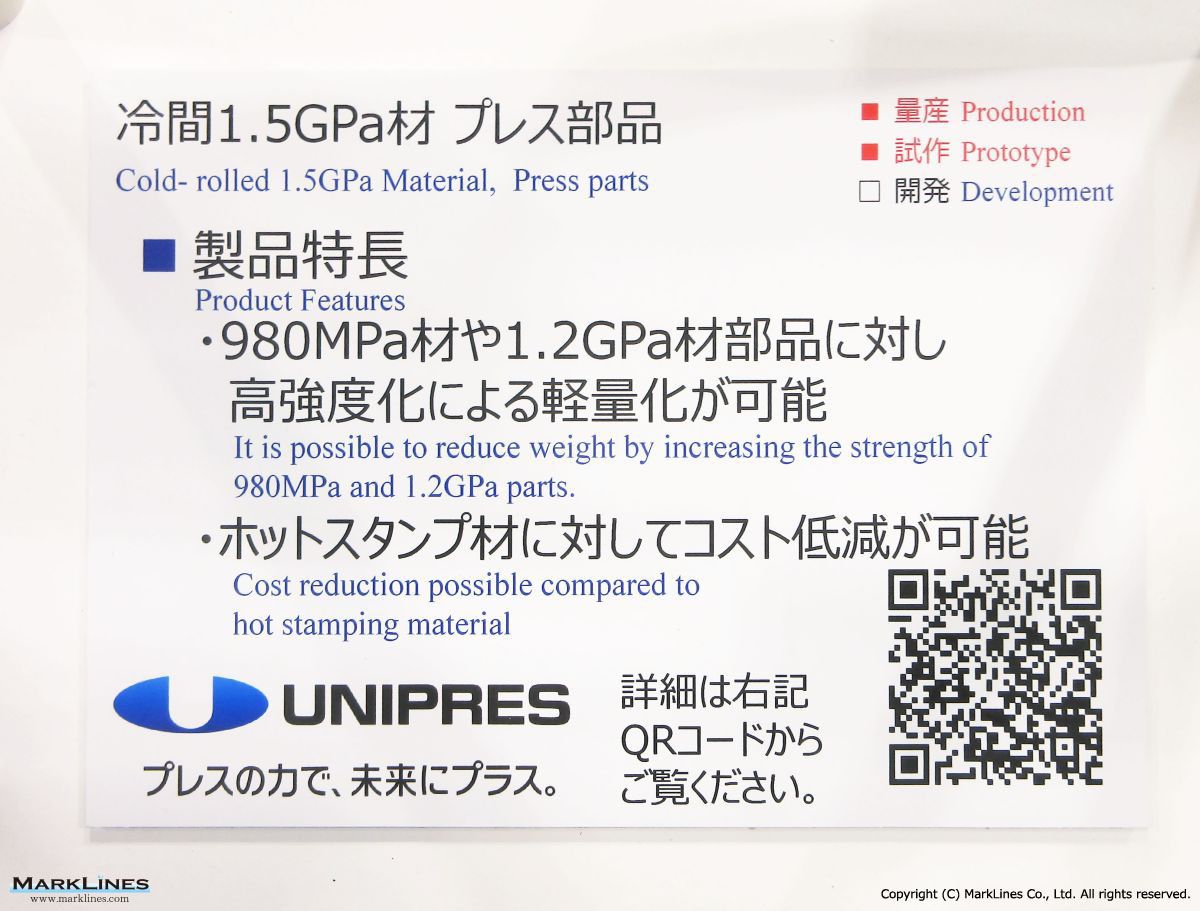
Cold-rolled 1.5GPa material, press parts
 2
2
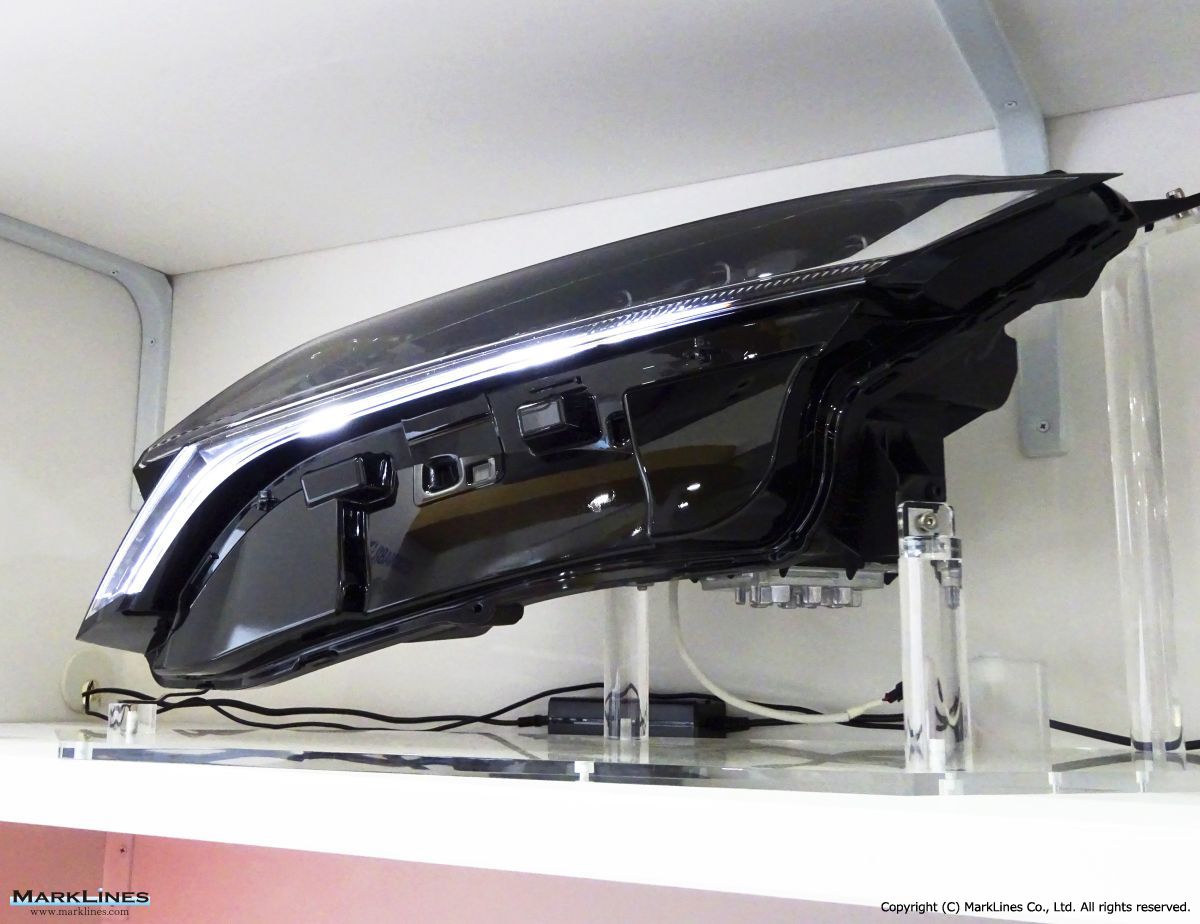
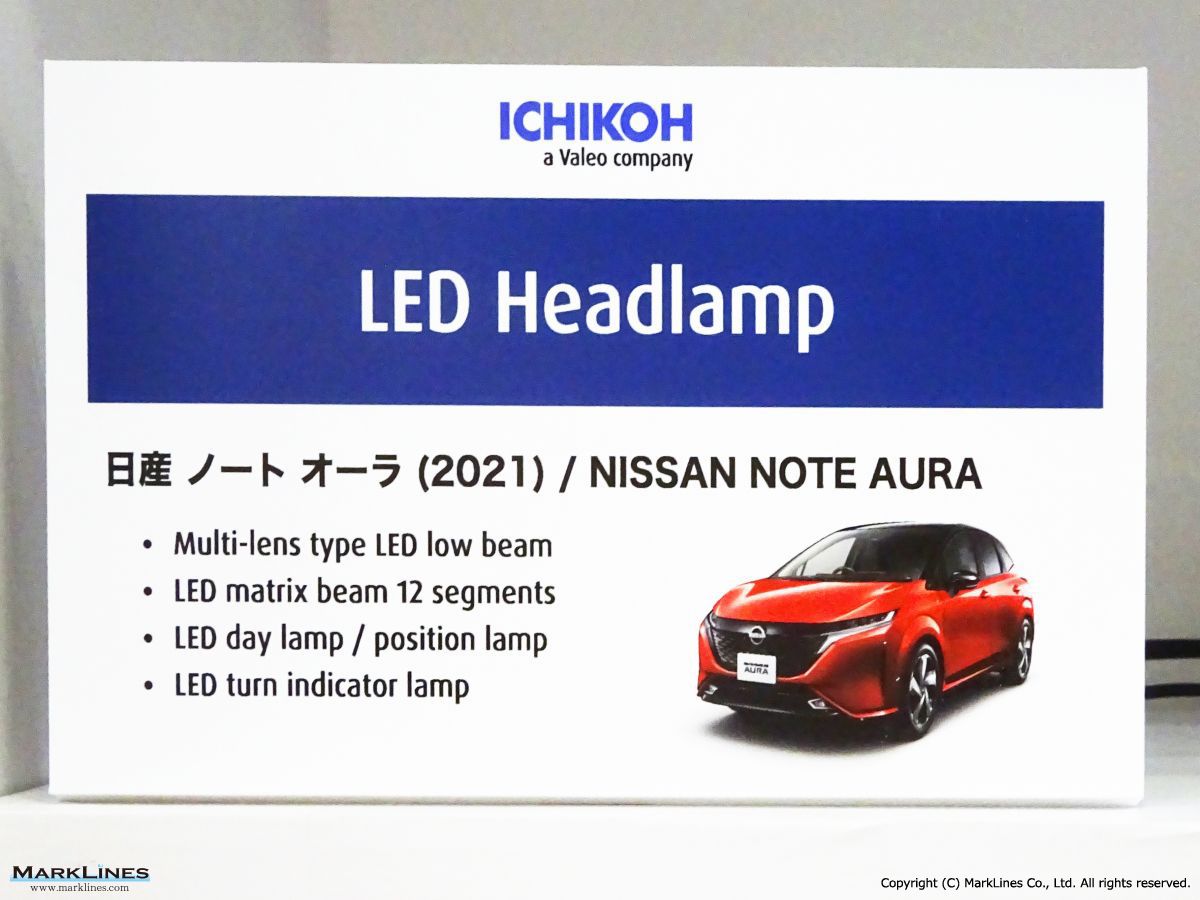
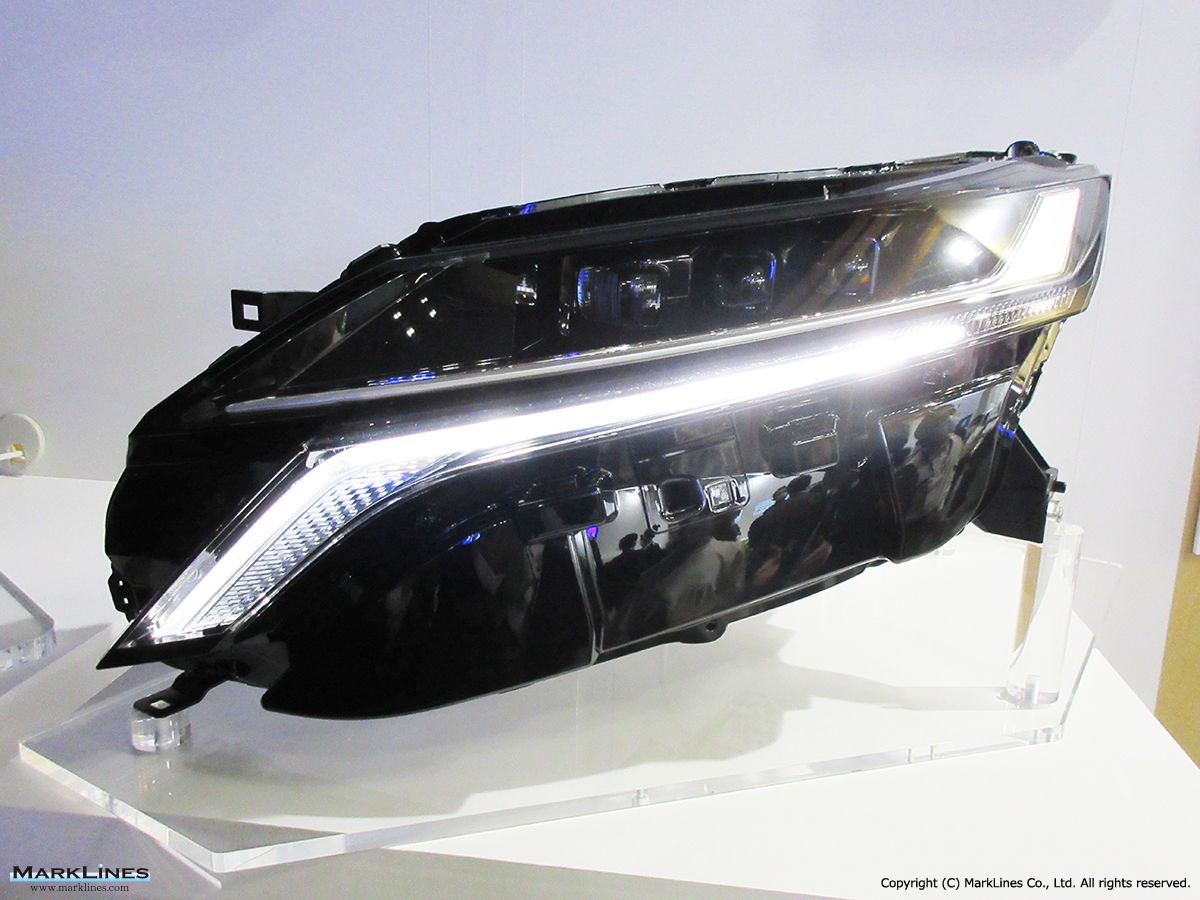
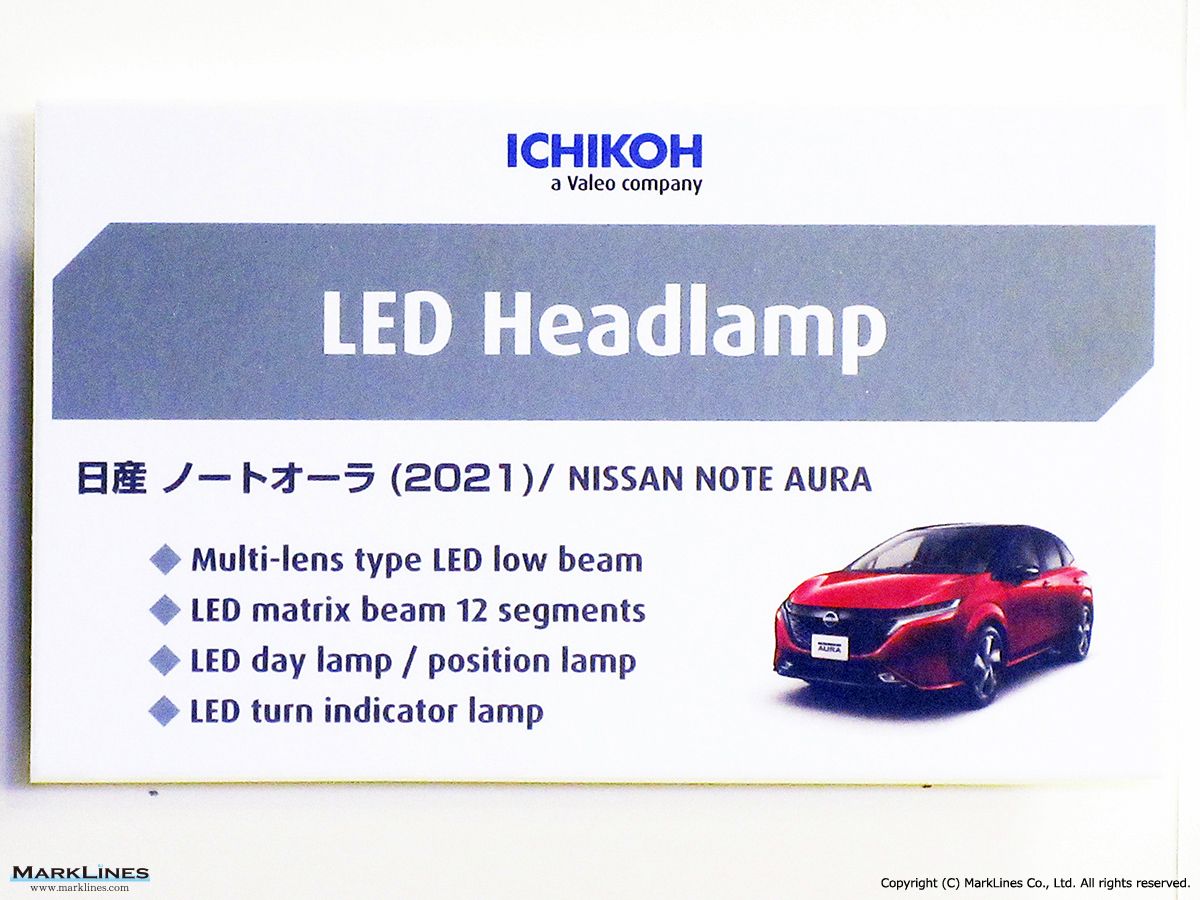
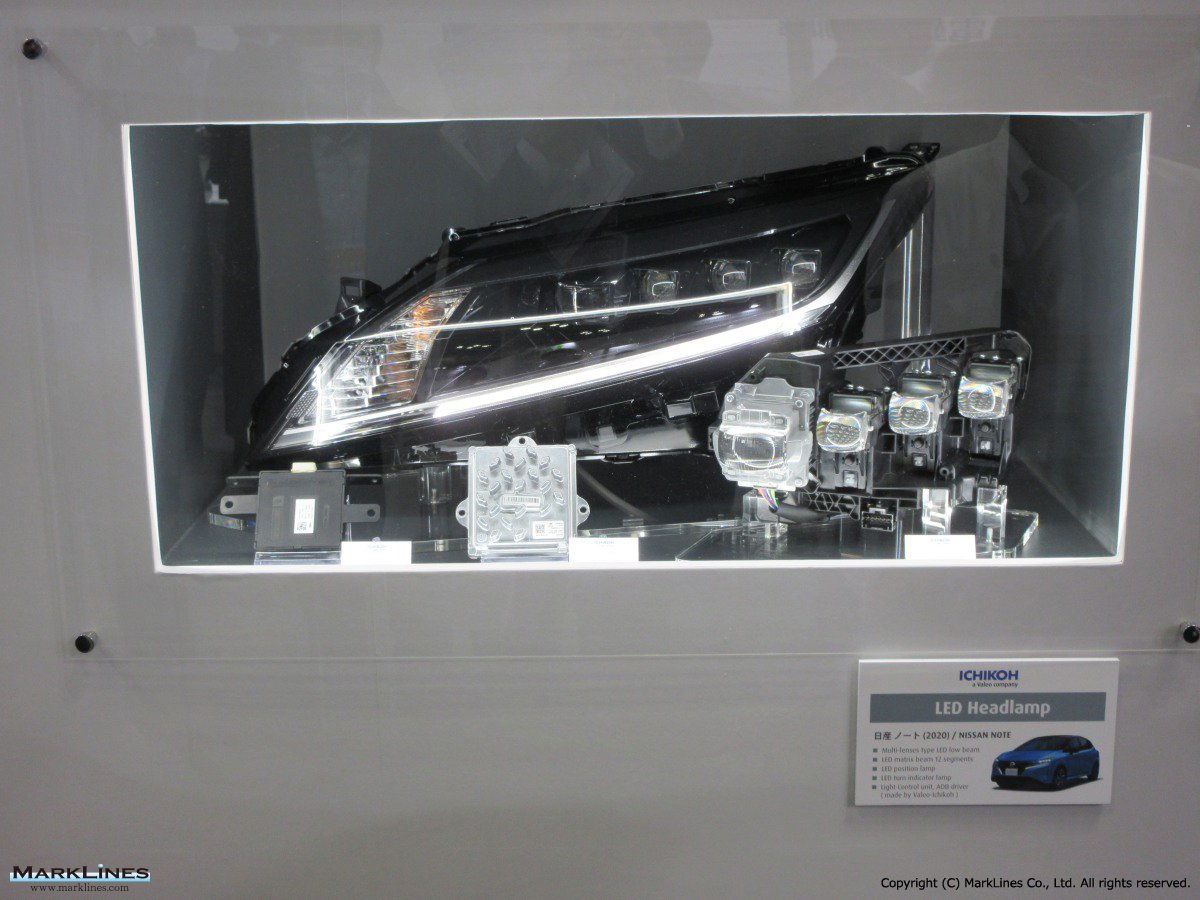
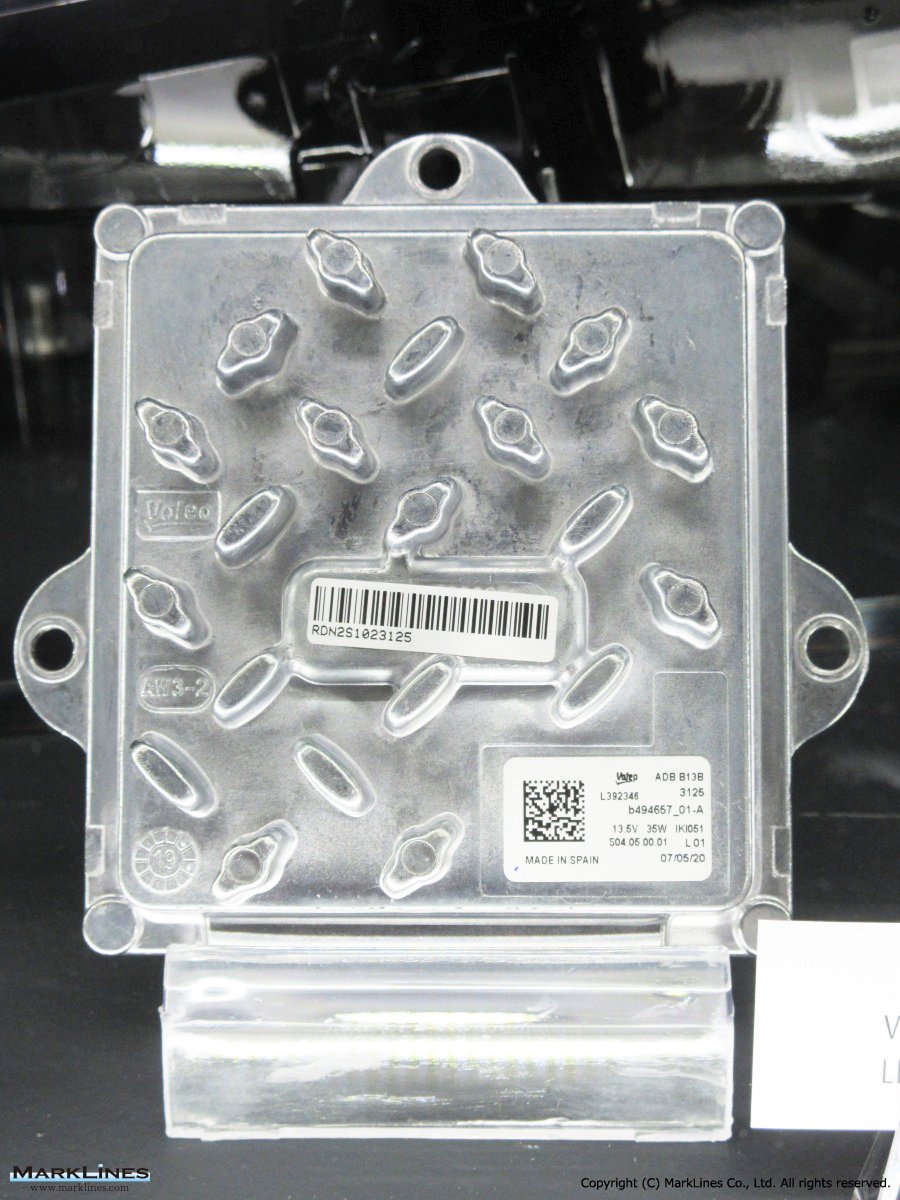
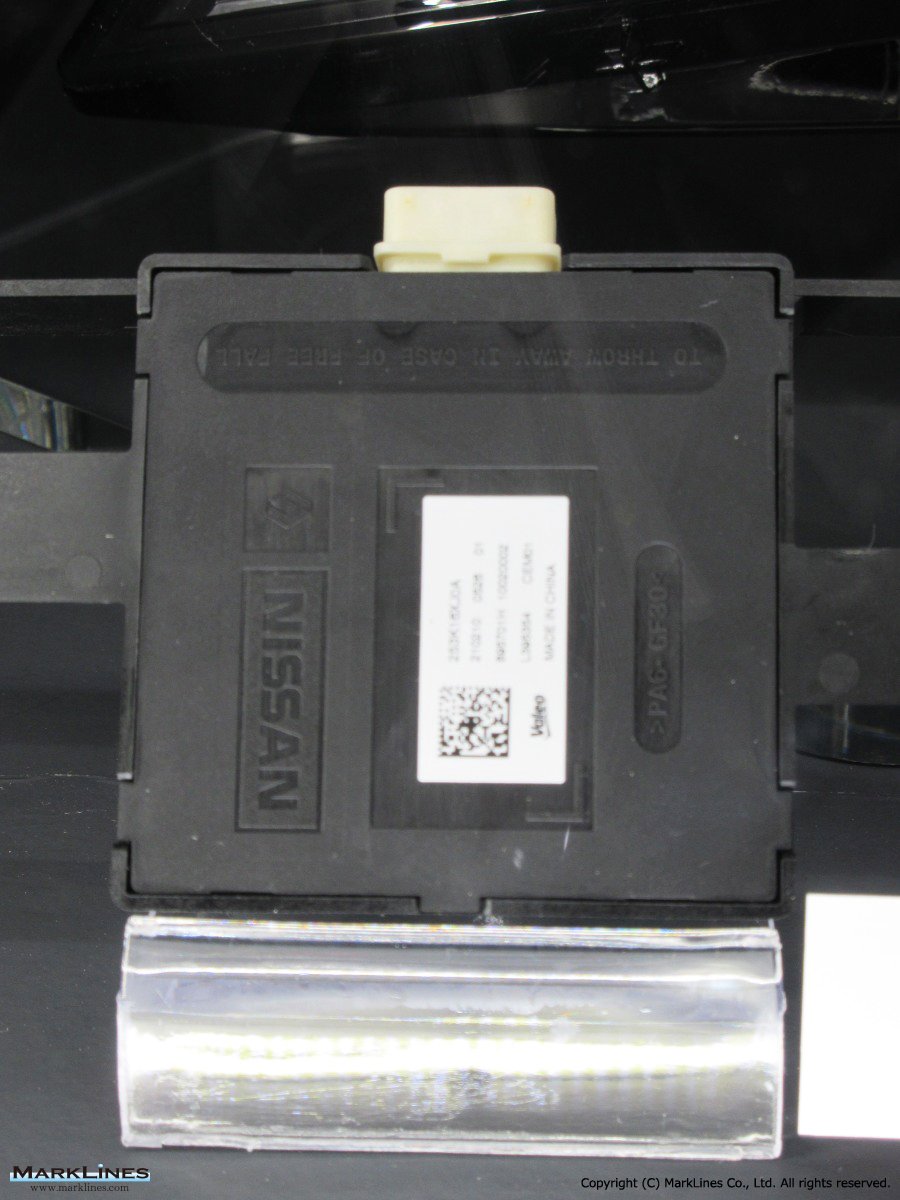
LED headlamp
 2
2
LED head lamp
 5
5
LED headlamp
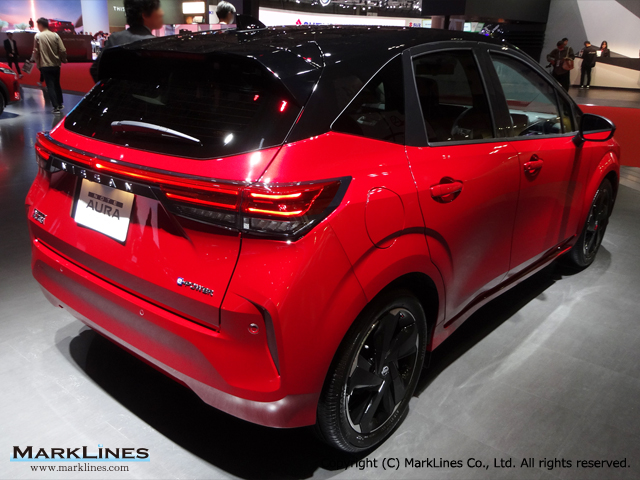
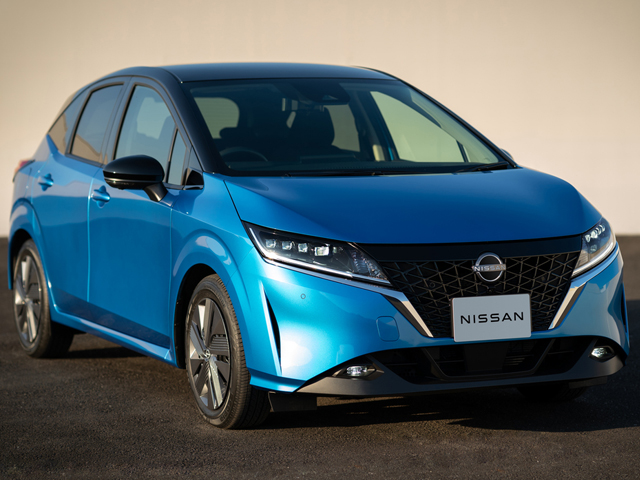
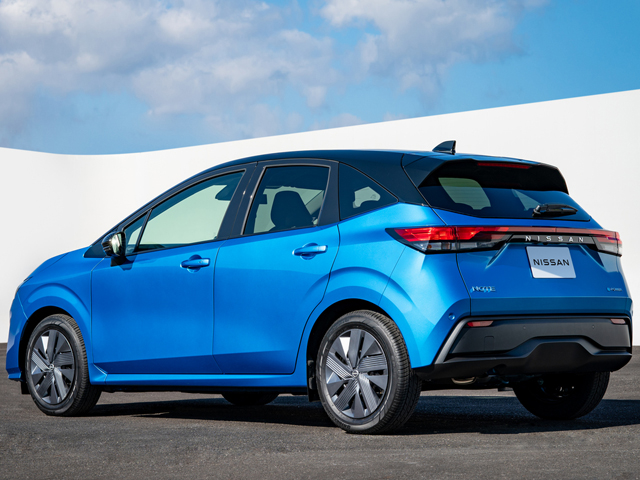
 6
6
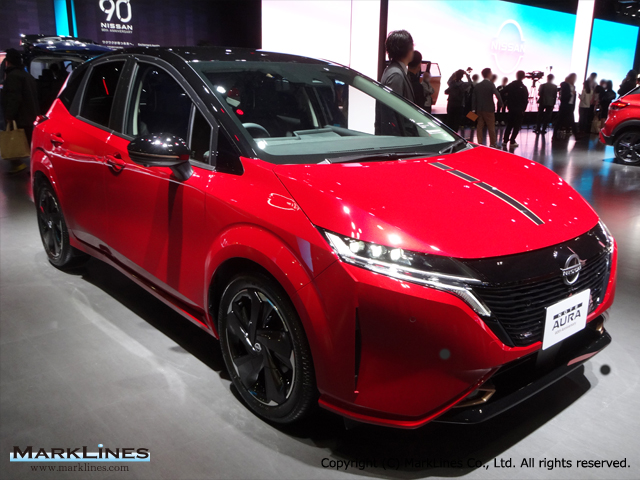
Note/Note Aura
 2
2
Camera monitor system
 6
6
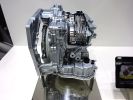
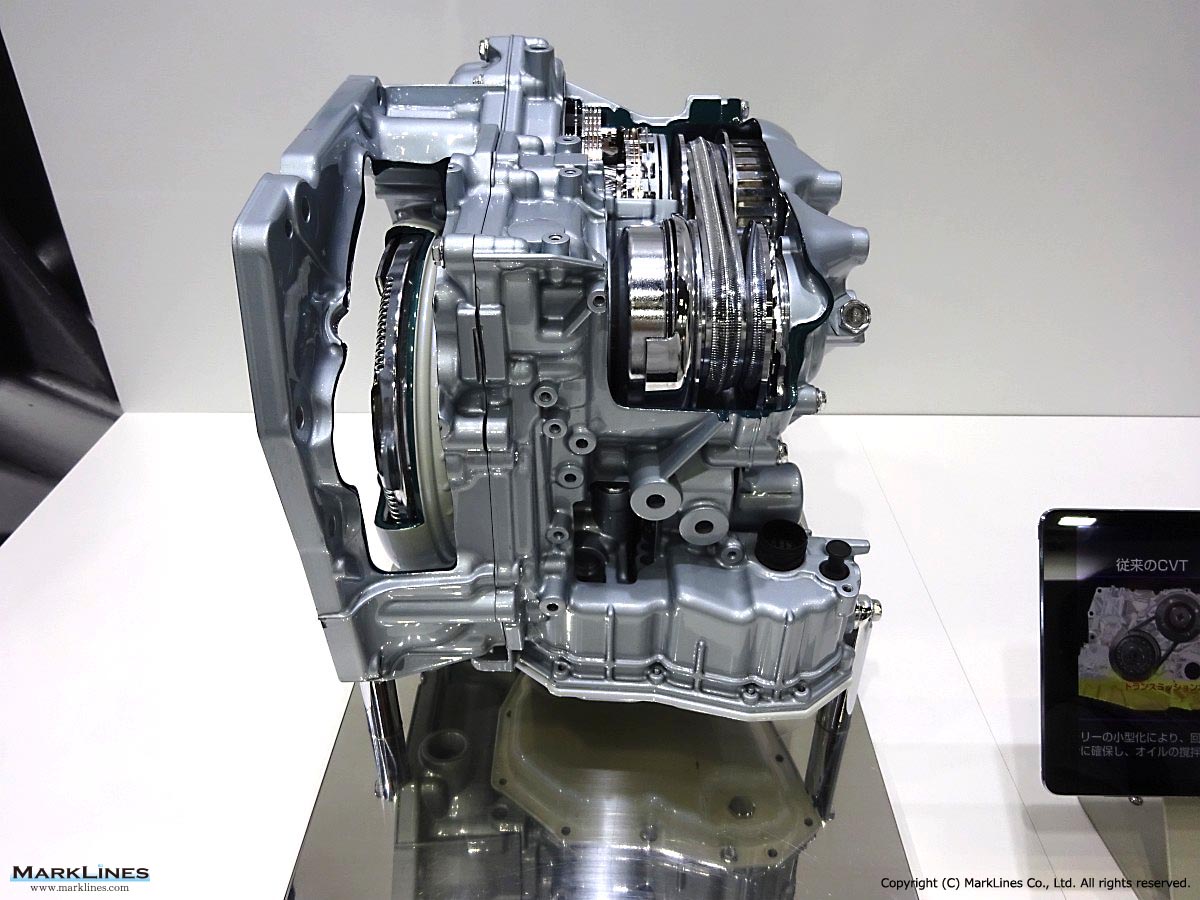
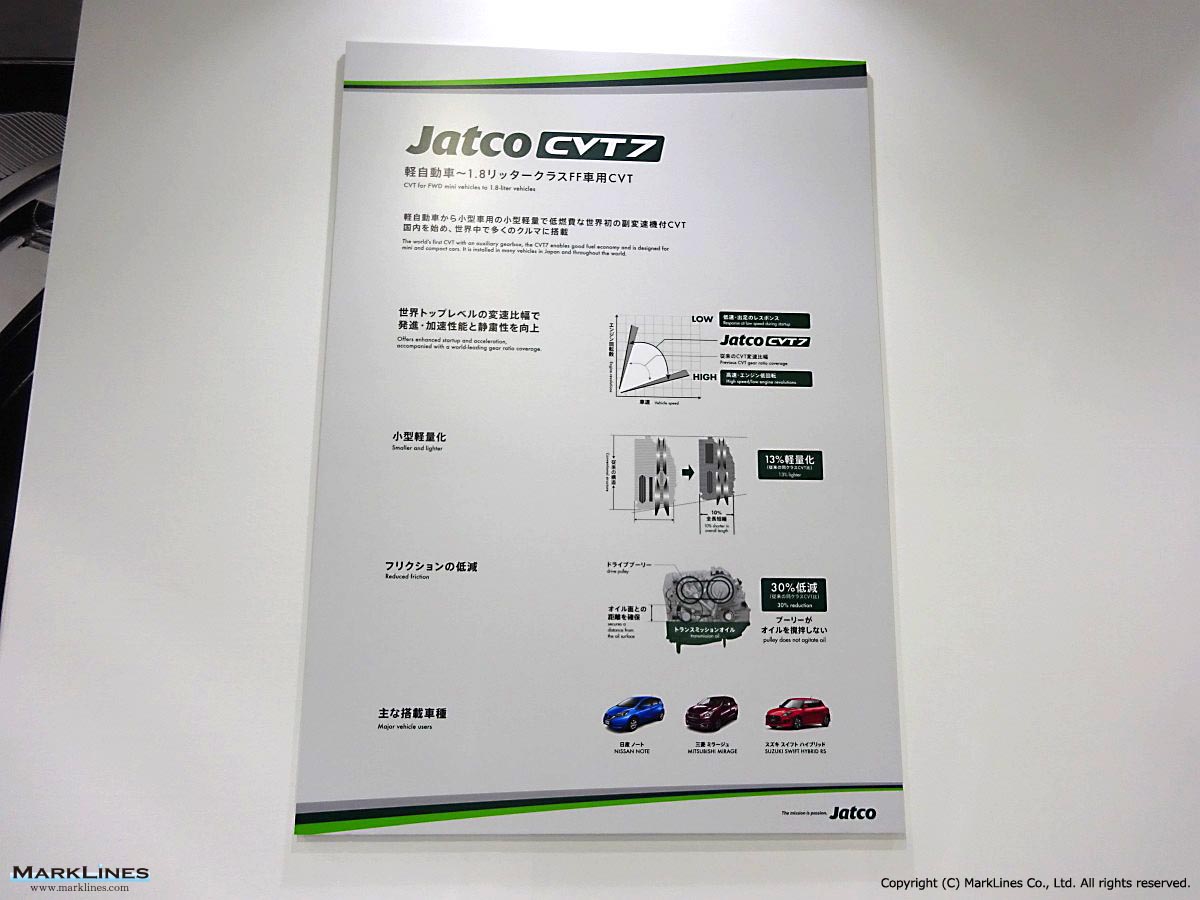
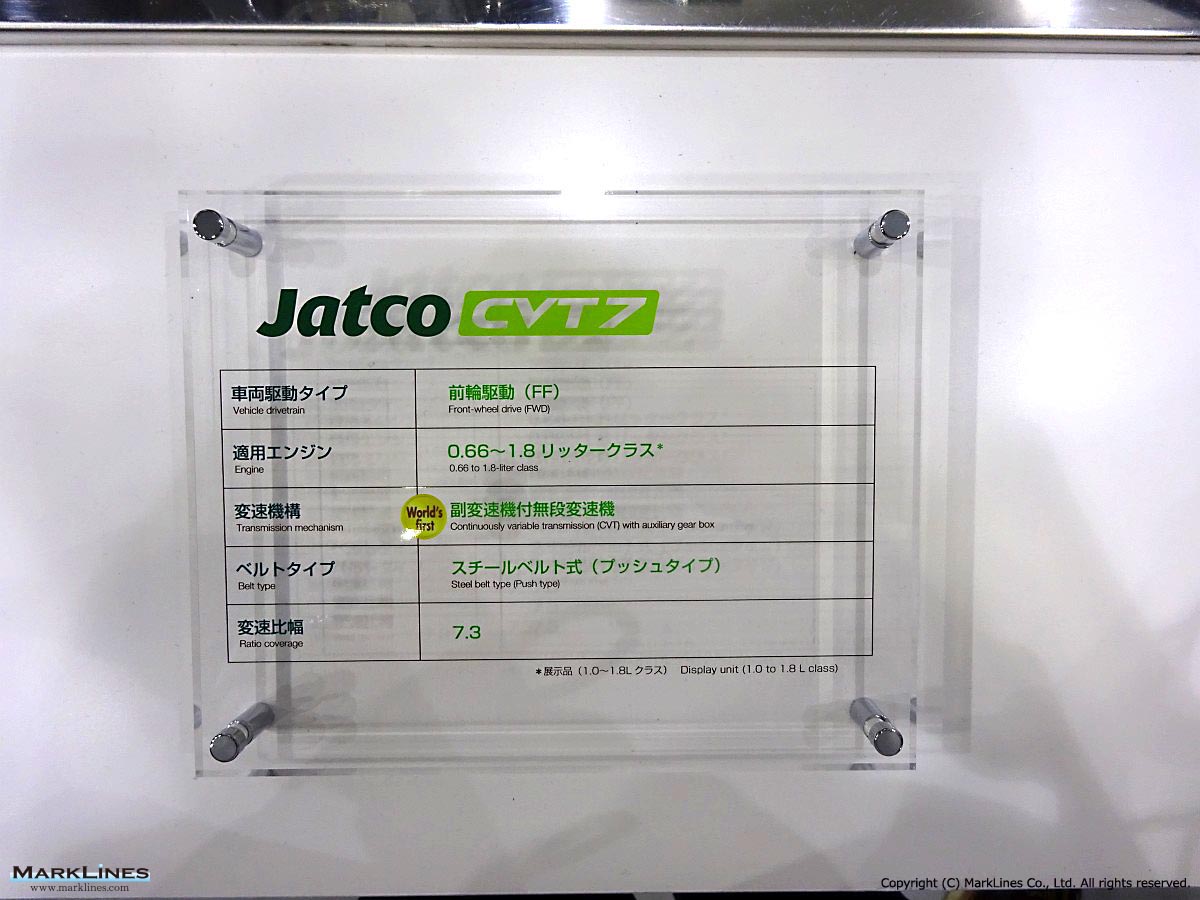
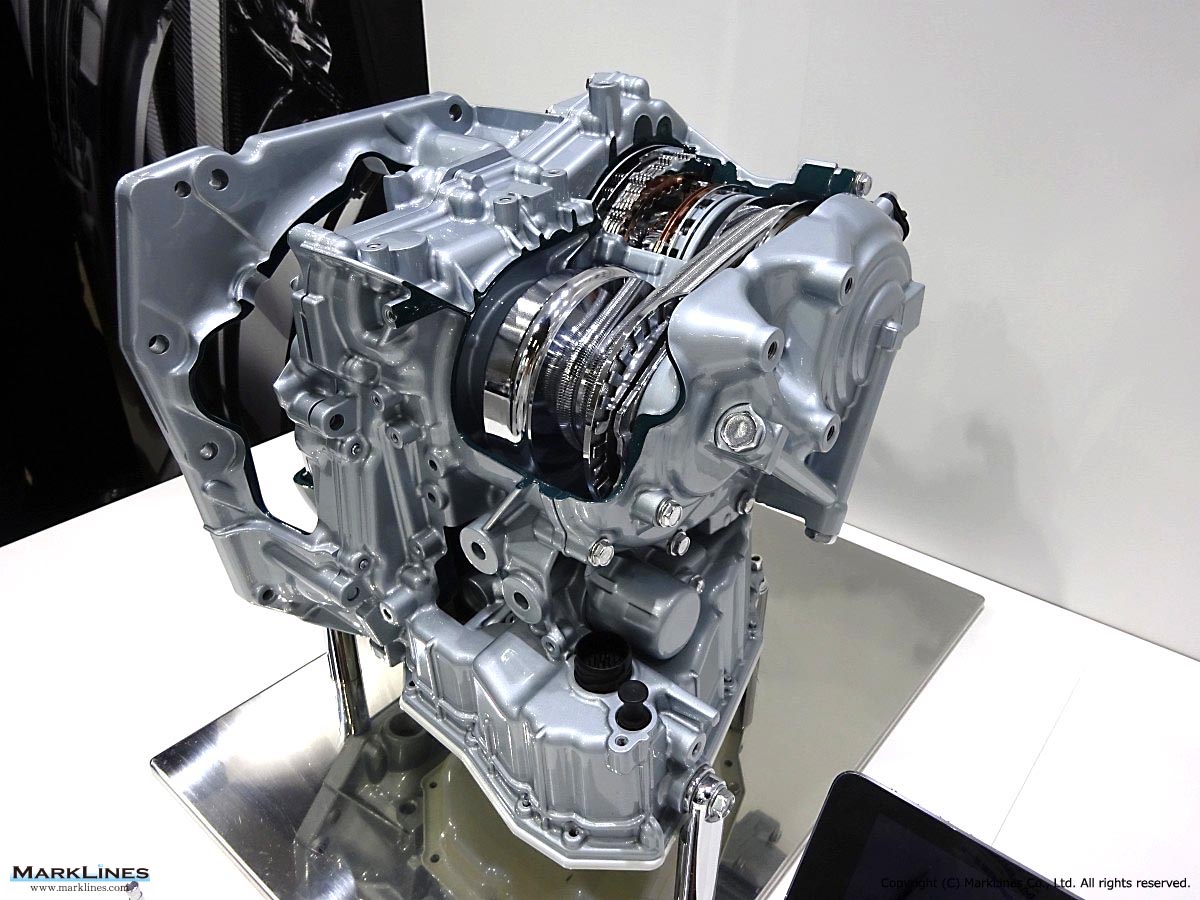
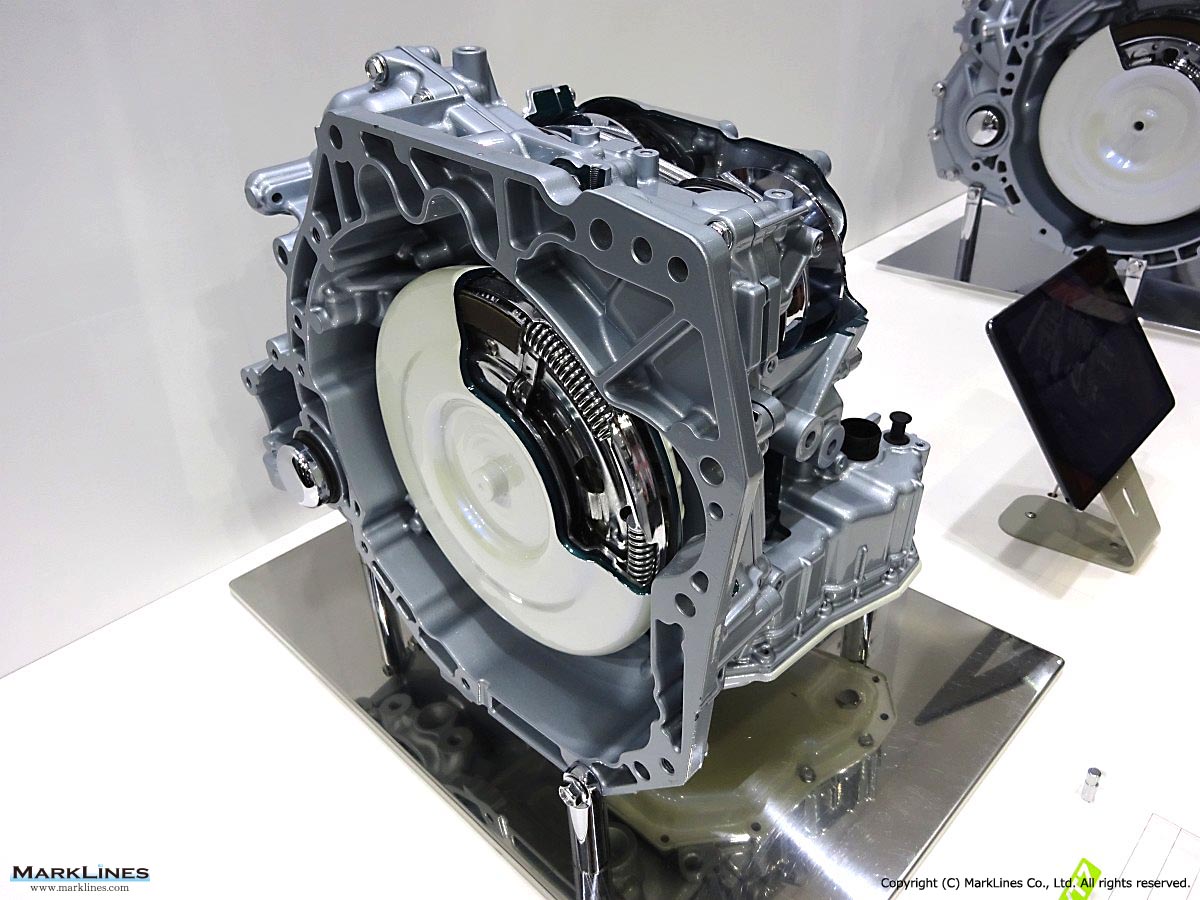
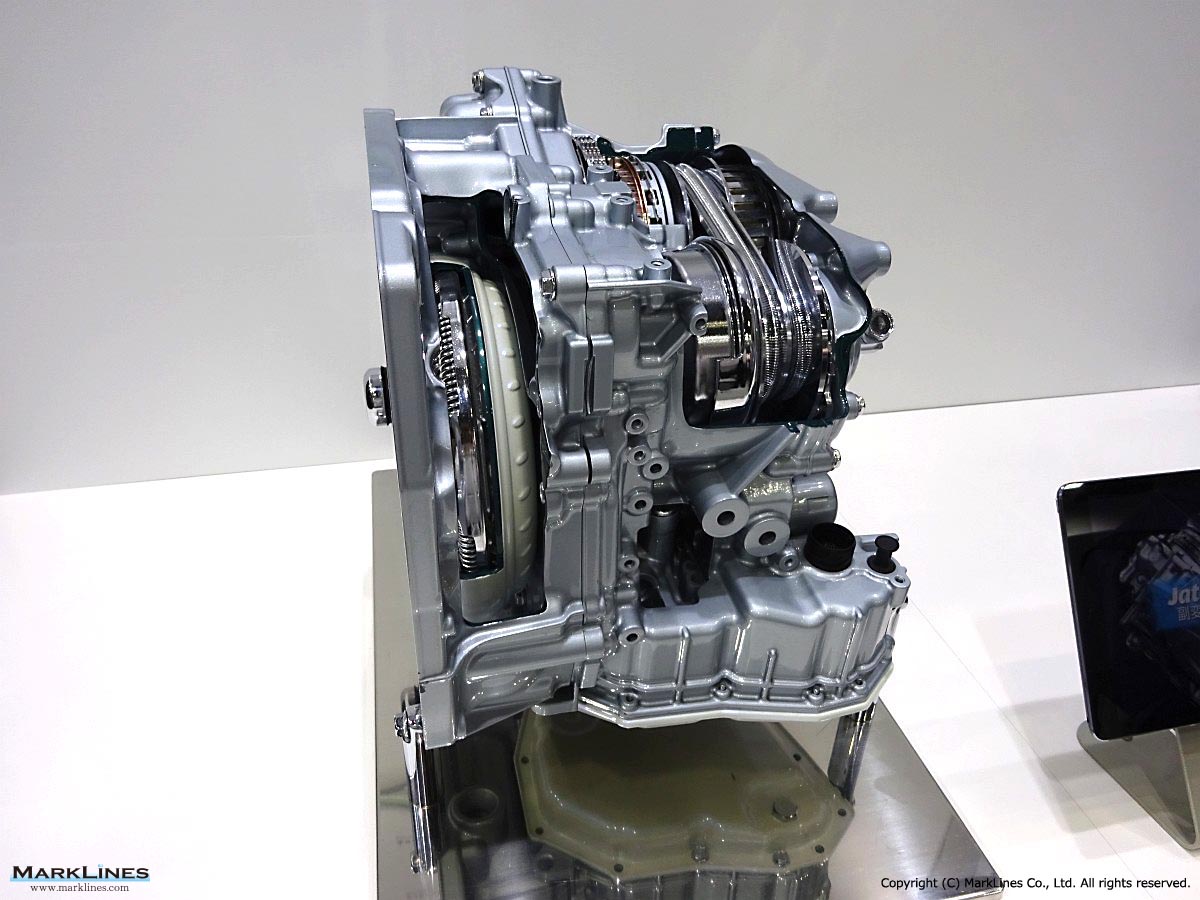
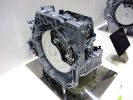
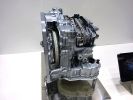
CVT7
 3
3
Camera monitor system
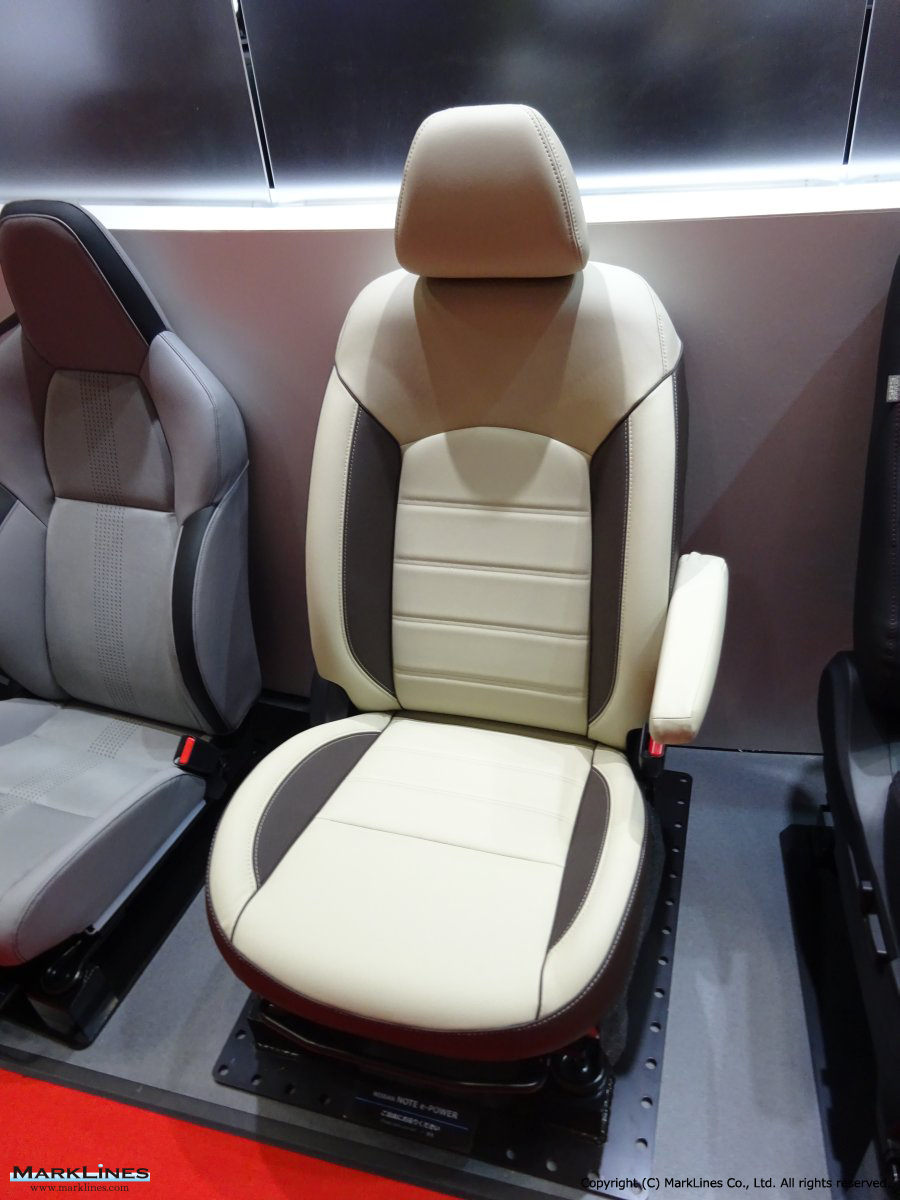
 1
1
Seat
Sort by :
1 - 20 of 27 results
Data changes for Production Statistics
of Germany for 2023 have been updated.As a result, the total production figure for this period have been changed. Dec 25, 2023 Germany Sales figures of Tesla in September 2023 have been updated. Nov 1, 2023 Thailand Production figures of Honda from Mar. to Aug. in 2023 have been updated.Please note that there is no change to the total. Aug 8, 2023 Malaysia Production figures of Mercedes in January - June 2023 have been updated.As a result,...
Automotive Production Data Updated at: 2026/03/17
2025 global production volume by Japanese OEMs
-2.6% Mitsubishi 883,828 -6.4% 471,467 -2.1% - - 412,361 -11.0% Subaru 878,016 -6.4% 540,194 -5.5% - - 337,822 -7.7% Total 24,169,499 0.3% 7,994,530 2.1% - - 16,174,969 -0.6% Source: Compiled from domestic and overseas production figures published in press releases by each automaker. Note: - Mark "-" in the table denotes "No production" or "No detailed information available." - The year-over-year ratio of the 8 automakers' total p...
Automotive Production Data Updated at: 2026/03/03
India - Flash report, Production volume, 2020
0.0 -100.0 Kia Motors India Pvt Ltd 0 0.0 - Mahindra Electric Mobility Ltd 0 0.0 - Tata Motors Ltd N/A - - Total Passenger Vehicles (PVs) 187 100.0 -99.9 Commercial Vehicles Make 2020 Y-o-Y (%) Apr. Share (%) Total Commercial Vehicles N/A - - Source: MarkLines Data Center (Note) Due to circumstances relating to our data source, Tata and Commercial vehicles will be updated every 3 months. Please accept our apologies for t...
Automotive Production Data Updated at: 2025/06/04
China - Flash report, Production volume, 2020
Source: MarkLines Data Center Flash report, January 2020 14 Feb. 2020 *There are cases where recently released data and detailed information in the database do not match up for reasons including different information sources, and discrepancies between preliminary reports and confirmed data. (Note) Due to the new type pneumonia, available data are limited. We will add information when the new data are available.China vehicle production and ...
Automotive Production Data Updated at: 2025/06/04
2023 global production volume by Japanese OEMs
8 13.6% - - 523,372 -8.4% Subaru 959,147 13.0% 608,327 8.1% - - 350,820 22.6% Total 25,796,411 7.6% 8,572,848 16.1% - - 17,223,563 3.9% Source: Compiled from domestic and overseas production figures published in press releases by each automaker. Note: - Mark "-" in the table denotes "No production" or "No detailed information available." - The year-over-year ratio of the 8 automakers' total p...
Automotive Production Data Updated at: 2025/04/14
2022 global production volume by Japanese OEMs
62 0.3% 571,646 -6.2% Subaru 848,867 14.0% 562,601 18.4% 286,266 6.2% Total 23,970,886 1.8% 7,386,544 -0.1% - - 16,584,342 2.6% Source: Compiled from domestic and overseas production figures published in press releases by each automaker. Note: - Mark "-" in the table denotes "No production" or "No detailed information available." - The year-over-year ratio of the 8 automakers' total p...
Automotive Production Data Updated at: 2025/04/14
2024 global production volume by Japanese OEMs
9.0% Mitsubishi 944,708 -7.7% 481,616 -3.8% - - 463,092 -11.5% Subaru 937,893 -2.2% 571,930 -6.0% - - 365,963 4.3% Total 24,098,764 -6.6% 7,830,365 -8.7% - - 16,268,399 -5.5% Source: Compiled from domestic and overseas production figures published in press releases by each automaker. Note: - Mark "-" in the table denotes "No production" or "No detailed information available." - The year-over-year ratio of the 8 automakers' total p...
Automotive Production Data Updated at: 2025/03/28
Update History for Automotive Production Statistics (2024)
ca Feb. 20 Mar. 22 Apr. 22 May 20 Jun. 20 Jul. 23 Aug. 21 Sep. 24 Oct. 21 Nov. 22 Dec. 20 Jan. 27 Iran Feb. 22 Mar. 27 Apr. 22 May 22 Jun. 20 Jul. 23 Aug. 23 Sep. 25 Oct. 22 Nov. 21 Dec. 20 Jan. 27 Morocco Mar. 5 Apr. 4 May 1 Jun. 4 Jul. 1 Jul. 31 Sep. 3 Oct. 1 Oct. 31 Dec. 3 Dec. 25 Feb. 4 Note (*)1 : Production volume of passenger car by model and commercial vehicle by maker in Korea are updated at different times. Monthly producti...
Automotive Production Data Updated at: 2025/03/26
Update History for Automotive Production Statistics (2023)
Sep. 20 Oct. 20 Nov. 24 Dec. 22 Jan. 25 Iran Feb. 21 Mar. 24 Apr. 20 May 18 Jun. 20 Jul. 24 Aug. 21 Sep. 20 Oct. 20 Nov. 24 Dec. 22 Jan. 25 Morocco Mar. 1 Apr. 3 May 2 May 24 Jul. 3 Aug. 1 Sep. 11 Oct. 3 Nov. 1 Dec. 6 Dec. 25 Feb. 1 Note (*)1 : Production volume of passenger car by model and commercial vehicle by maker in Korea are updated at different times. Monthly producti...
Automotive Production Data Updated at: 2025/03/26
Update History for Automotive Production Statistics (2022)
eb. 17 Mar. 22 Apr. 21 May 18 Jun. 29 Jul. 15 Aug. 18 Sep. 26 Oct. 17 Nov. 16 Dec. 16 Jan. 23 Iran Feb. 17 Mar. 22 Apr. 21 May 18 Jun. 29 Jul. 15 Aug. 18 Sep. 26 Oct. 17 Nov. 17 Dec. 16 Jan. 23 Morocco Mar. 1 Mar. 29 May 5 May 30 Jun. 30 Aug. 2 Aug. 31 Oct. 4 Oct. 28 Dec. 1 Dec. 28 Feb. 2 Note (*)1 : Production volume of passenger car by model and commercial vehicle by maker in Korea are updated at different times. Monthly producti...
Automotive Production Data Updated at: 2025/03/26
Update History for Automotive Production Statistics (2021)
, 2022 Iran - - - Jan. 19, 2018 Jan. 25, 2019 Jan. 21, 2020 Jan. 21, 2021 Jan. 20, 2022 Egypt Mar. 10, 2015 Mar. 25, 2016 Mar. 28, 2017 Apr. 26, 2018 Apr. 3, 2019 Mar. 31, 2020 Mar. 26, 2021 Mar. 10, 2022 Morocco - - - Jan. 22, 2018 Jan. 29, 2019 Jan. 31, 2020 Jan. 29, 2021 Jan. 31, 2022 Note (*)1 : Production volume of passenger car by model and commercial vehicle by maker in Korea are updated at different times. Monthly producti...
Automotive Production Data Updated at: 2025/03/26
2021 global production volume by Japanese OEMs (Preliminary)
10.7% - - 609,586 33.4% Subaru 744,787 -15.8% 475,141 -16.7% - - 269,646 -14.3% Total 23,554,886 3.2% 7,391,194 -4.2% - - 16,163,692 7.0% Source: Compiled from domestic and overseas production figures published in press releases by each automaker. Note: - Mark "-" in the table denotes "No production" or "No detailed information available." - The year-over-year ratio of the 8 automakers' total p...
Automotive Production Data Updated at: 2024/03/29
Production in Egypt by make
/A Heavy Comm. Isuzu N/A N/A N/A N/A N/A N/A N/A Other/adjustment 24,000 25,300 26,670 N/A N/A N/A N/A Total 24,000 25,300 26,670 N/A N/A N/A N/A Buses N/A N/A N/A N/A N/A N/A N/A N/A Total N/A N/A N/A N/A N/A N/A N/A Grand Total 36,000 36,230 36,640 18,500 18,500 23,754 N/A Note: Figures of makers include double counts.Source: OICA and other T Type make 2005 2006 2007 2008 2009 2010 Cars NASCO(Tofas/Nova) n.a. n...
Automotive Production Data Updated at: 2024/03/27
Update History for Production Statistics (2020)
18 Mar. 19 Apr. 20 May 19 Jun. 19 Jul. 20 Aug. 18 Sep. 23 Oct. 20 Nov. 16 Dec. 14 Jan. 21 Iran Feb. 17 Mar. 19 Apr. 20 May 19 Jun. 22 Jul. 20 Aug. 18 Sep. 23 Oct. 20 Nov. 16 Dec. 14 Jan. 21 Morocco Feb. 28 Mar. 30 Apr. 30 Jun. 1 Jun. 30 Jul. 30 Sep. 1 Sep. 30 Oct. 30 Nov. 30 Jan. 4 Jan. 29 Note (*)1 : Since October 2014, monthly production volume in the U.S. and Canada is updated twice for the preliminary and final data.Therefore, w...
Automotive Production Data Updated at: 2021/03/31
2020 global production volume by Japanese OEMs (Preliminary)
% 570,416 -7.8% - - 314,458 -14.7% Mitsubishi 854,091 -37.6% 396,996 -35.9% - - 457,095 -39.0% Total 22,825,343 -17.2% 7,714,847 -16.3% - - 15,110,496 -17.6% Source: Compiled from domestic and overseas production figures published in press releases by each automaker. (As of Jan. 28, 2021) Note: - Mark "-" in the table denotes "No production" or "No detailed information available." - The year-over-year ratio of the 8 automakers' total p...
Automotive Production Data Updated at: 2021/02/05
2019 global production volume by Japanese OEMs (Preliminary)
- 749,135 -3.8% Subaru 987,283 -3.1% 618,764 -6.2% - - 368,519 2.5% Total 27,556,401 -4.0% 9,215,476 -0.2% - - 18,340,925 -5.8% Source: Compiled from domestic and overseas production figures published in press releases by each automaker. (As of Jan. 30, 2020) Note: - Mark "-" in the table denotes "No production" or "No detailed information available." - The year-over-year ratio of the 8 automakers' total p...
Automotive Production Data Updated at: 2020/07/09
Update History for Production Statistics (2019)
Feb. 20 Mar. 29 Apr. 22 May 22 Jun. 21 Jul. 19 Aug. 19 Sep. 19 Oct. 21 Nov. 18 Dec. 17 Jan. 21 Iran Mar. 22 Mar. 22 Apr. 19 May 22 Jun. 21 Jul. 19 Aug. 20 Sep. 19 Oct. 21 Nov. 18 Dec. 17 Jan. 21 Morocco Mar. 7 Apr. 3 May 3 May 30 Jul. 2 Jul. 29 Sep. 4 Sep. 26 Oct. 31 Nov. 28 Jan. 6 Jan. 31 Note (*)1 : Since October 2014, monthly production volume in the U.S. and Canada is updated twice for the preliminary and final data.Therefore, w...
Automotive Production Data Updated at: 2020/04/01
Update History for Production Statistics (2017)
r. 28 Mar. 28 Apr. 18 May 17 Jun. 20 Jul. 18 Aug. 17 Sep. 19 Oct. 19 Nov. 17 Dec. 18 Jan. 18 Iran Feb. 28 Mar. 17 Apr. 18 May 17 Jun. 20 Jul. 18 Aug. 18 Sep. 20 Oct. 19 Nov. 17 Dec. 18 Jan. 19 Morocco Mar. 28 Mar. 28 May 1 May 31 Jul. 3 Jul. 31 Aug. 23 Sep. 29 Nov. 1 Nov. 20 Dec. 26 Jan. 22 Note (*)1 : Since October 2014, monthly production volume in the U.S. and Canada is updated twice for the preliminary and final data.Therefore, w...
Automotive Production Data Updated at: 2020/03/27
Update History for Production Statistics (2018)
b. 19 Mar. 20 Apr. 19 May 18 Jun. 18 Jul. 18 Aug. 20 Sep. 18 Oct. 19 Nov. 19 Dec. 18 Jan. 25 Iran Feb. 26 Mar. 20 Apr. 19 May 18 Jun. 18 Jul. 17 Aug. 20 Sep. 19 Oct. 19 Nov. 19 Dec. 19 Jan. 25 Morocco Mar. 5 Apr. 2 May 1 May 28 Jun. 25 Jul. 30 Aug. 30 Sep. 25 Oct. 26 Nov. 26 Dec. 26 Jan. 29 Note (*)1 : Since October 2014, monthly production volume in the U.S. and Canada is updated twice for the preliminary and final data.Therefore, w...
Automotive Production Data Updated at: 2020/03/26
2018 global production volume by Japanese OEMs (Preliminary)
,750 23.4% Subaru 1,019,364 -5.0% 659,965 -7.0% - - 359,399 -1.1% Total 28,704,207 0.8% 9,236,859 0.5% - - 19,467,348 1.0% Source: Compiled from domestic and overseas production figures published in press releases by each automaker. (As of Feb. 1, 2019) Note: - Mark "-" in the table denotes "No production" or "No detailed information available." - The year-over-year ratio of the 8 automakers' total p...
Automotive Production Data Updated at: 2019/02/01


 Japan
Japan USA
USA Mexico
 Germany
 China (Shanghai)
 Thailand
 India
India