


Search Results by Category
All information related to {{ key_word }}.
AI Navigator will guide you. Click here for information about {{ key_word }}.
Images
 13
13
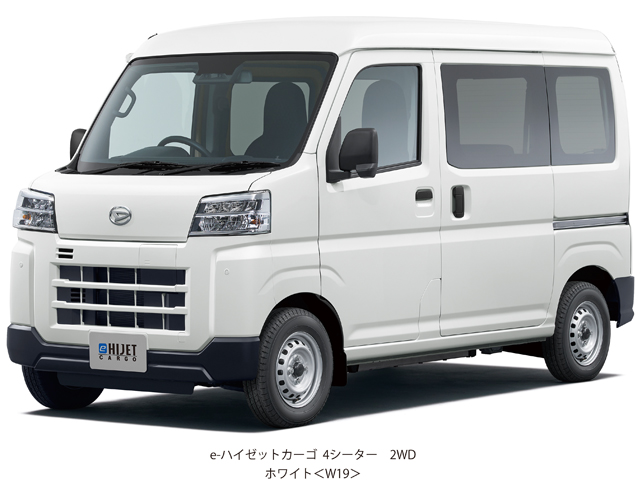
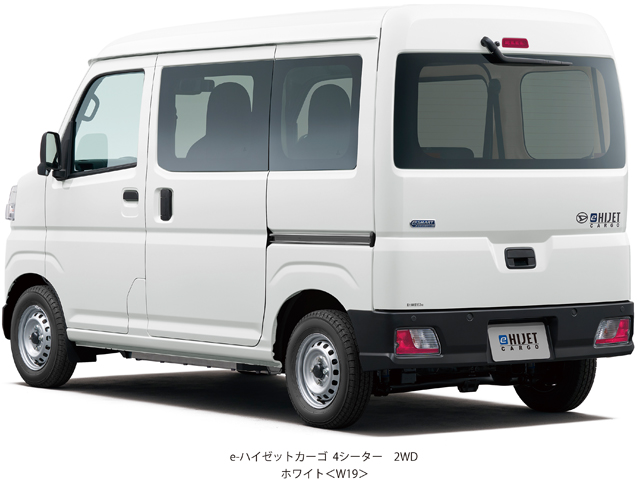
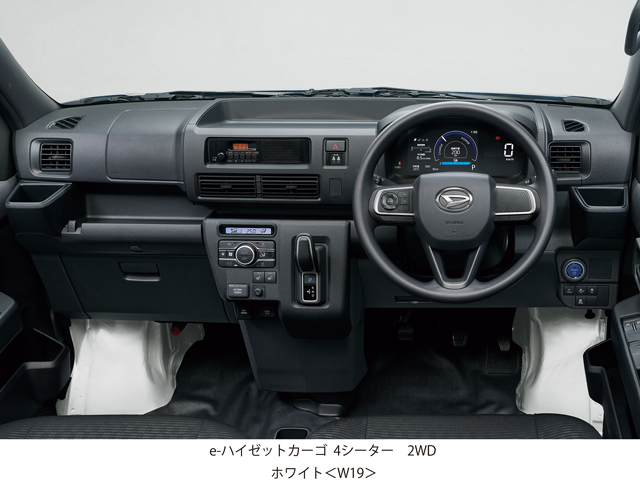
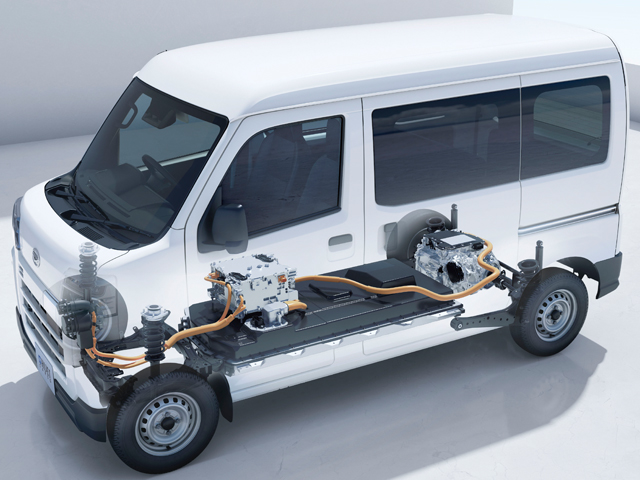
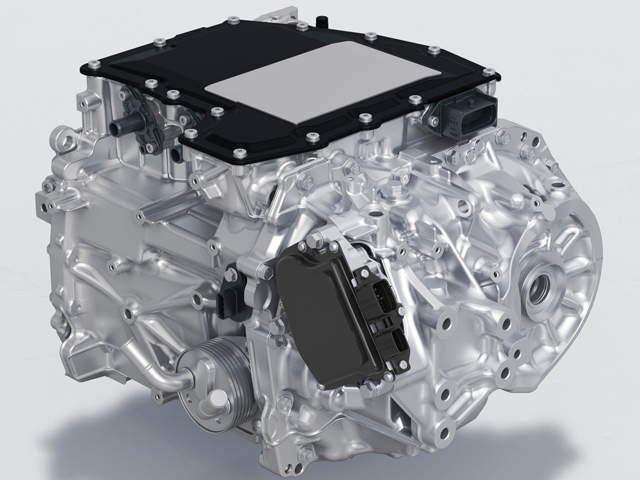
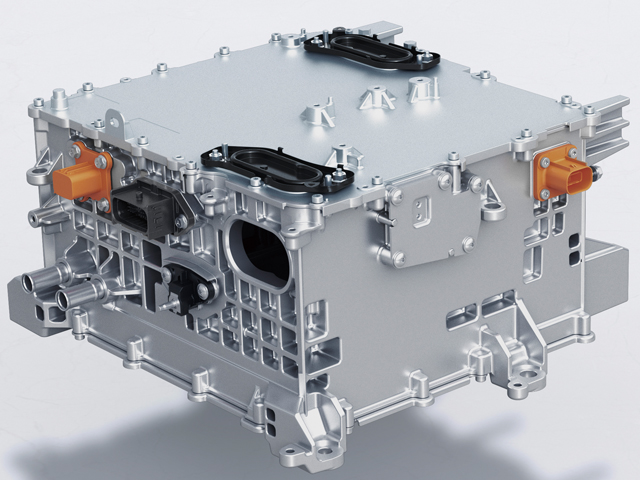
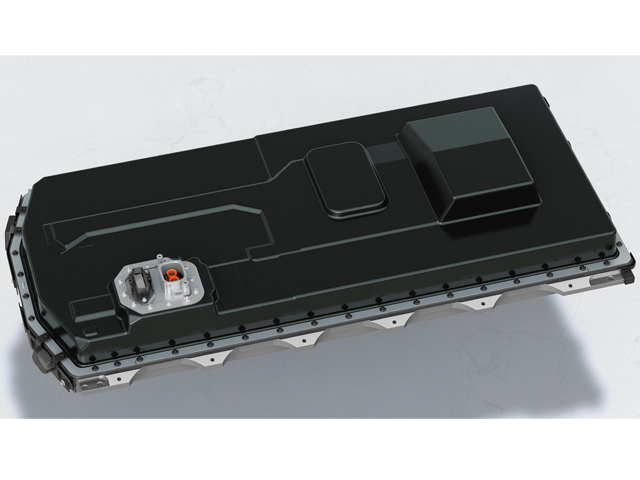
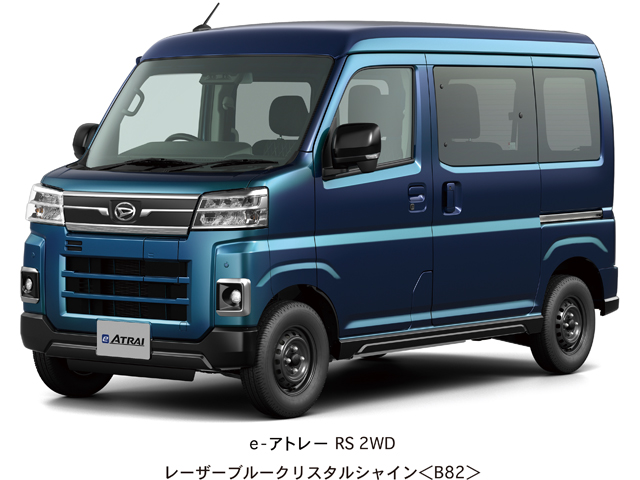
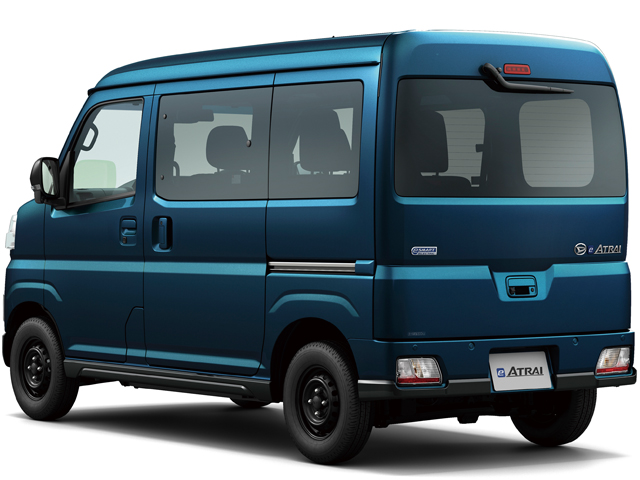
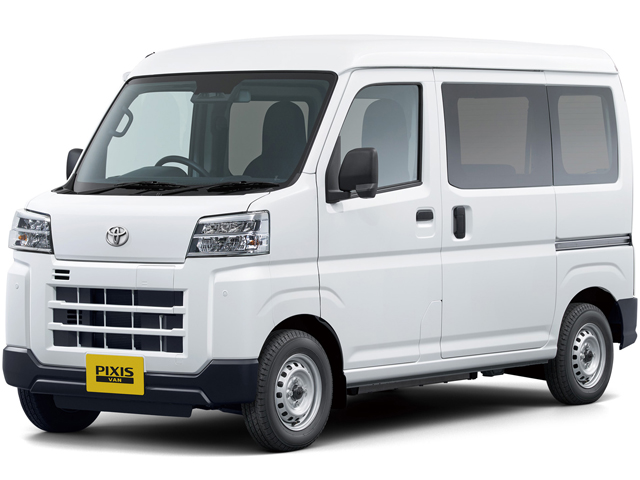
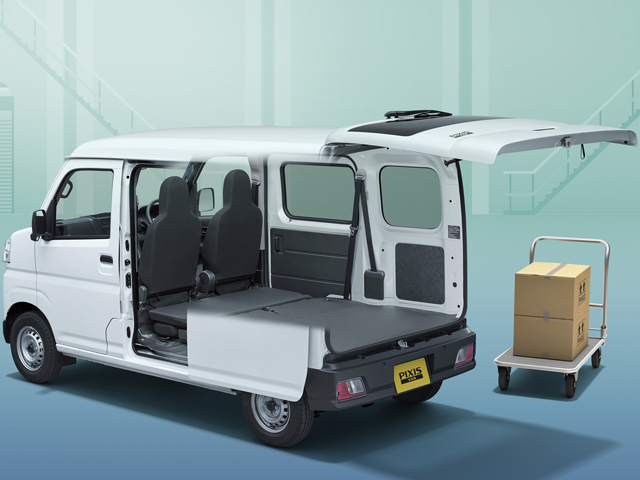
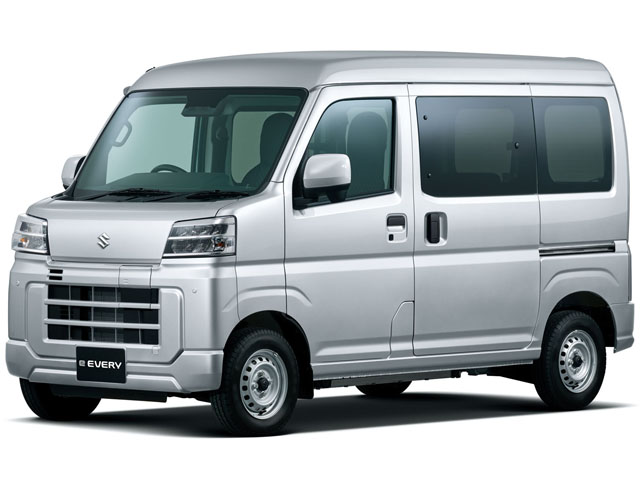
e-Hijet Cargo/ e-Atrai/Pixis Van BEV/e Every
 3
3
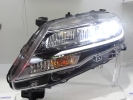
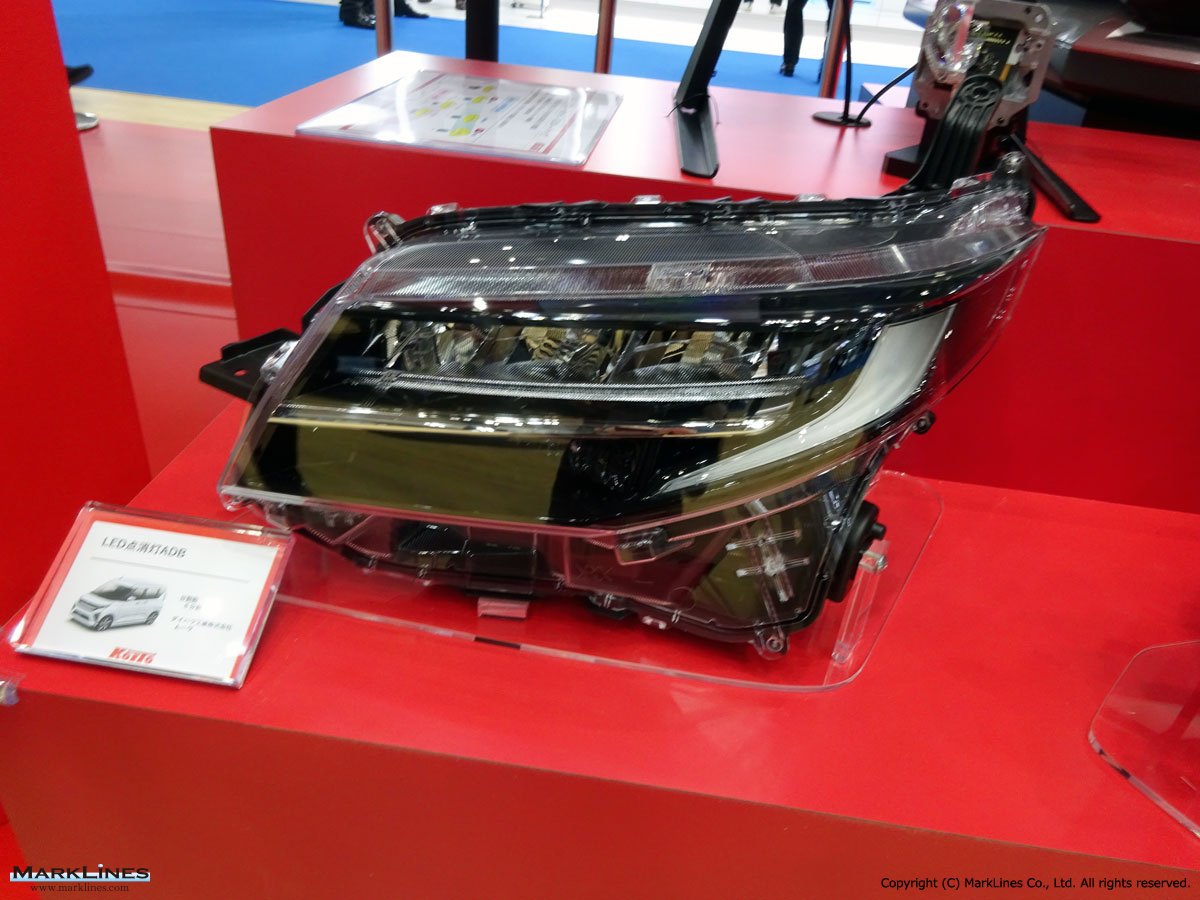
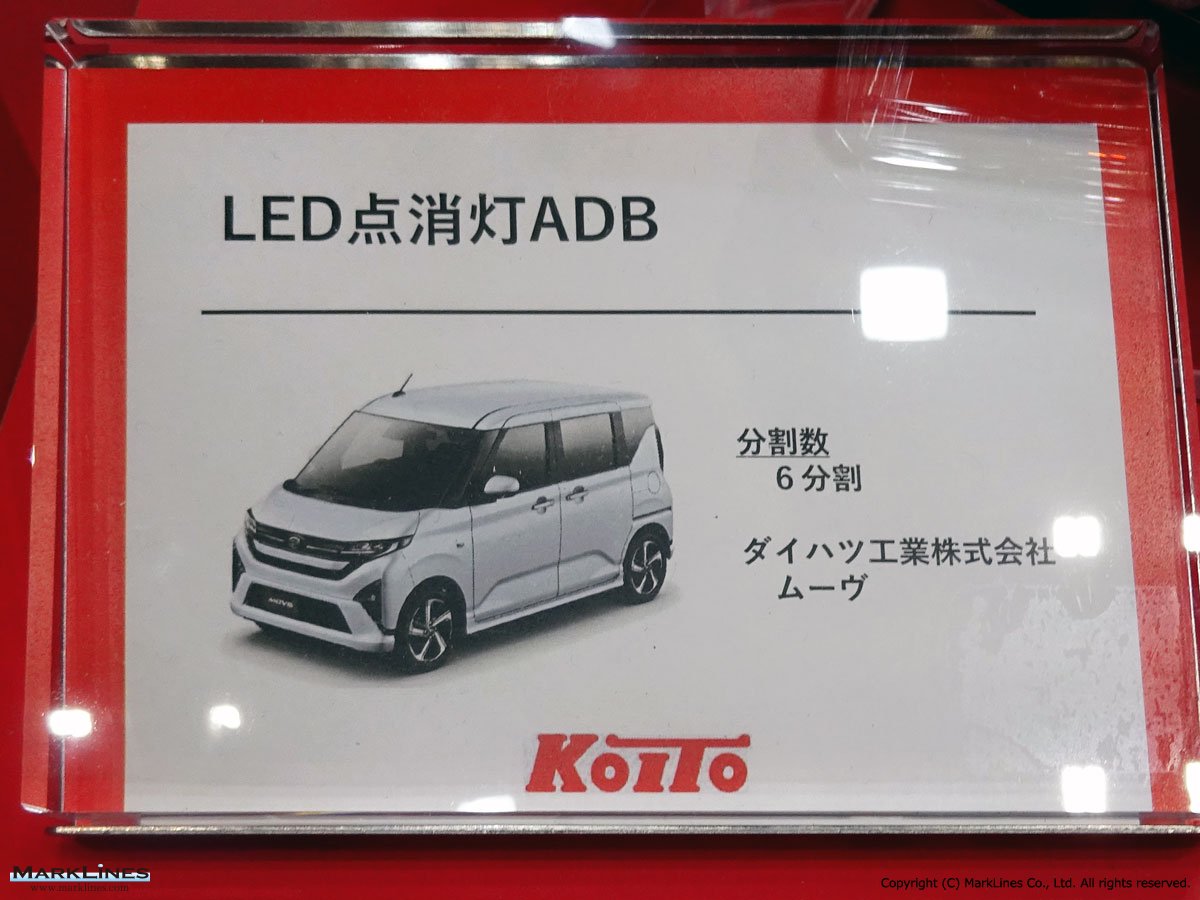
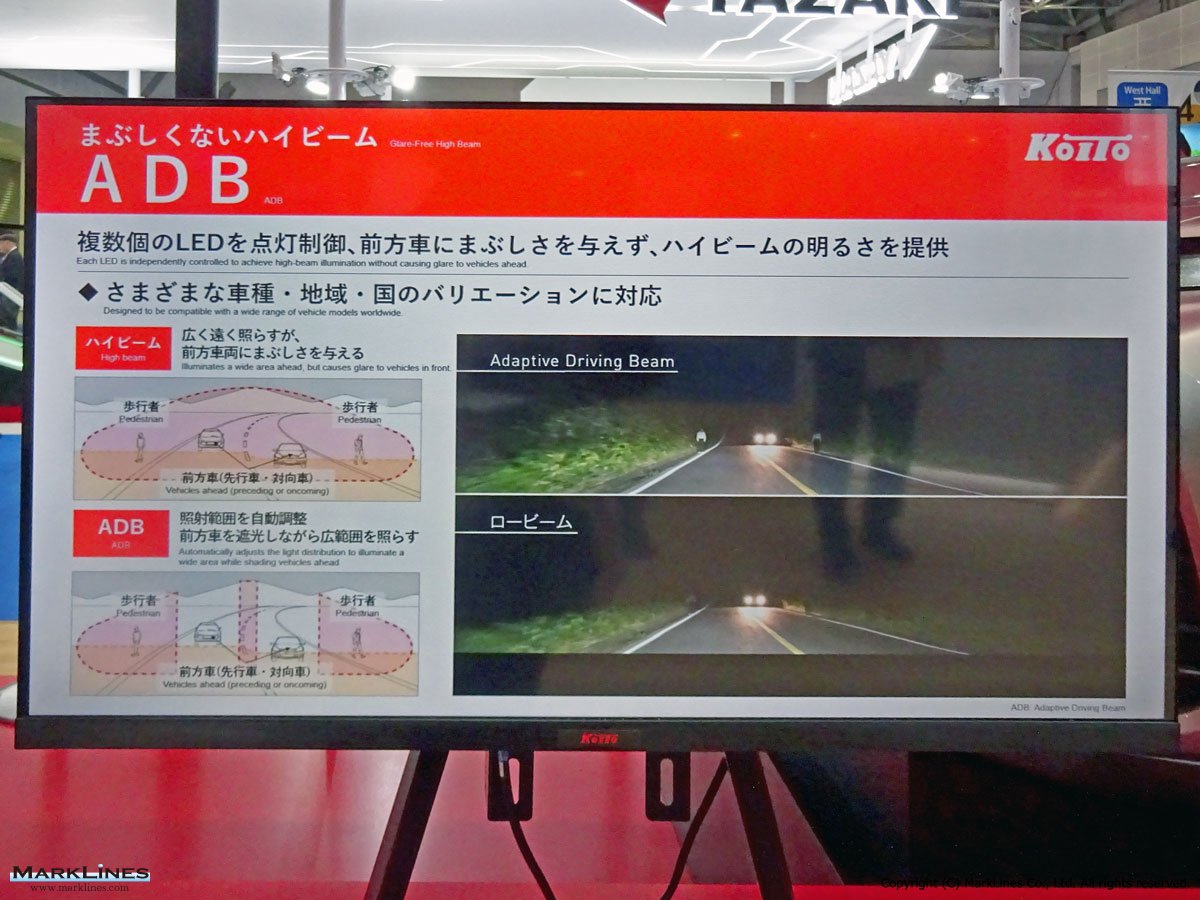
LED on/off ADB
 8
8
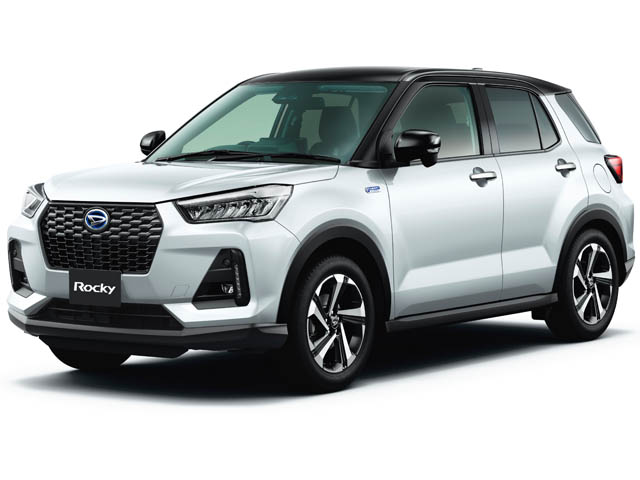
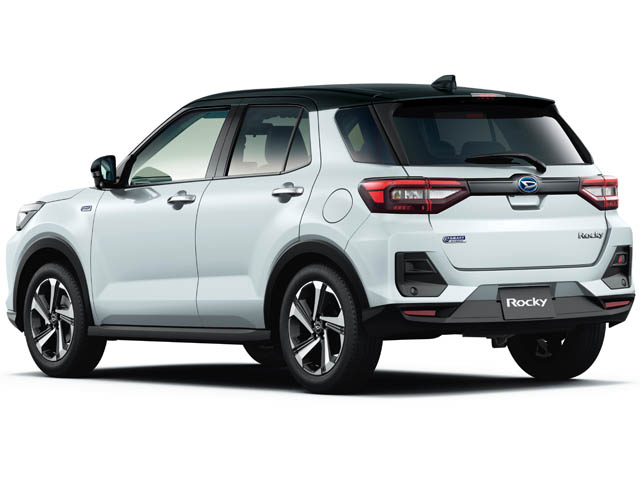
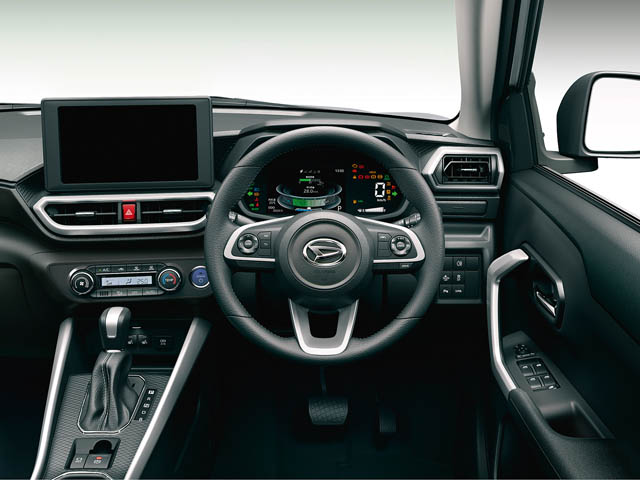
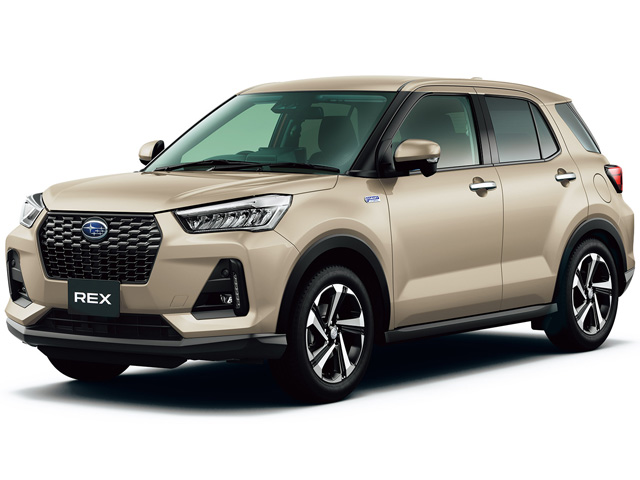
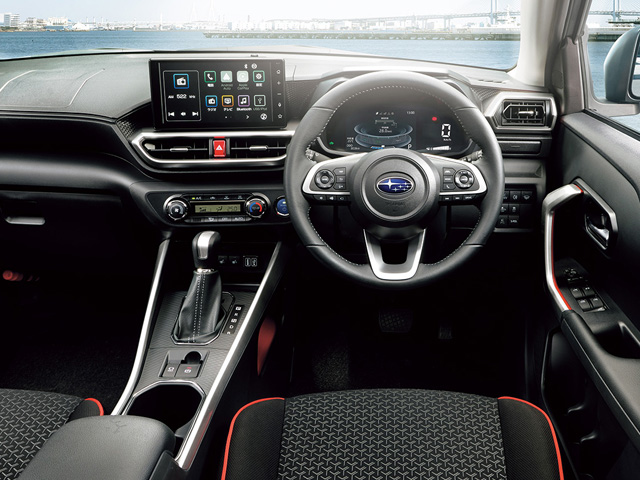
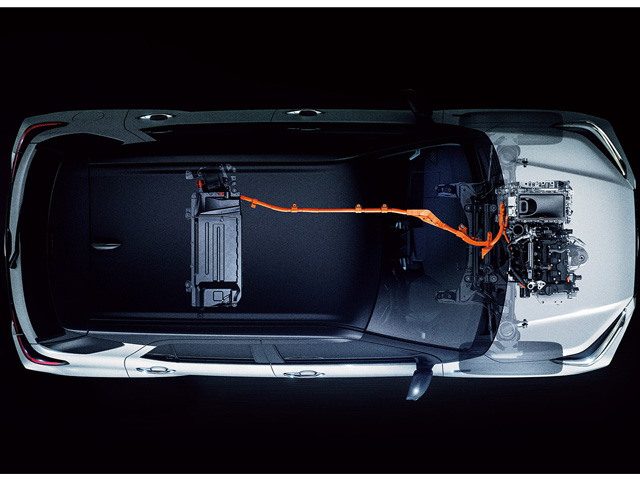
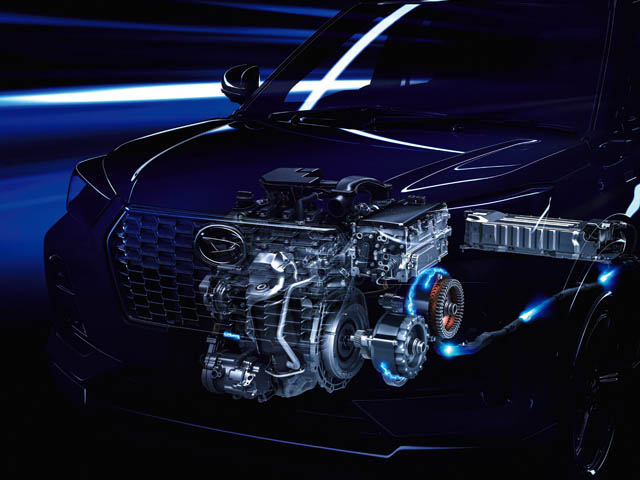
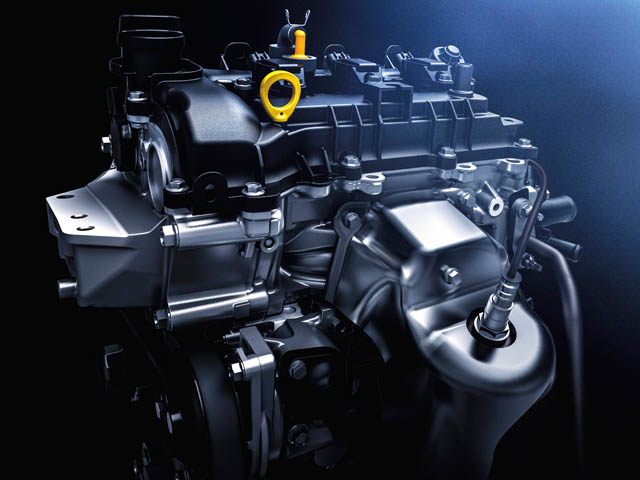
Rocky/REX Hybrid
 1
1
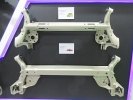
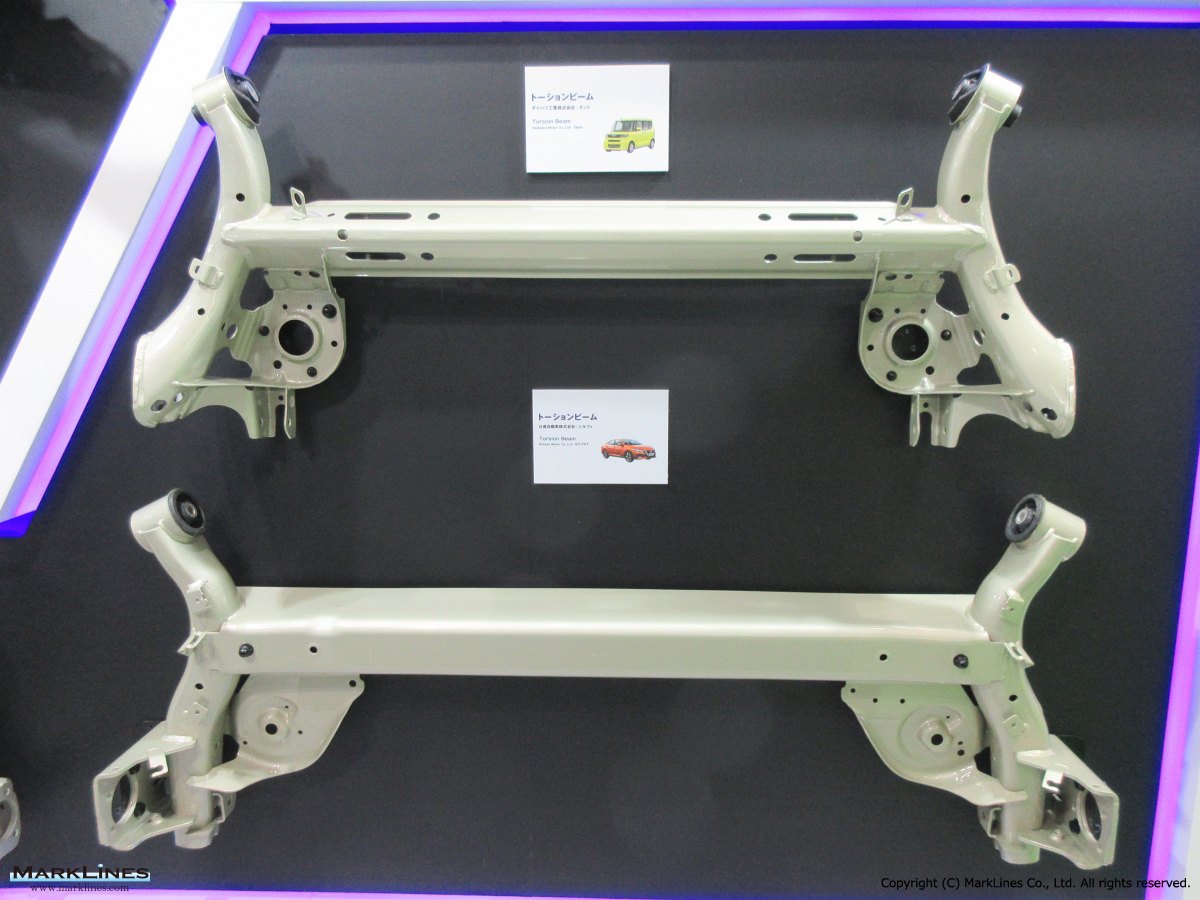
Torsion beam
 1
1
LED array parabolic type ADB
 1
1
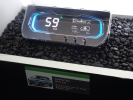
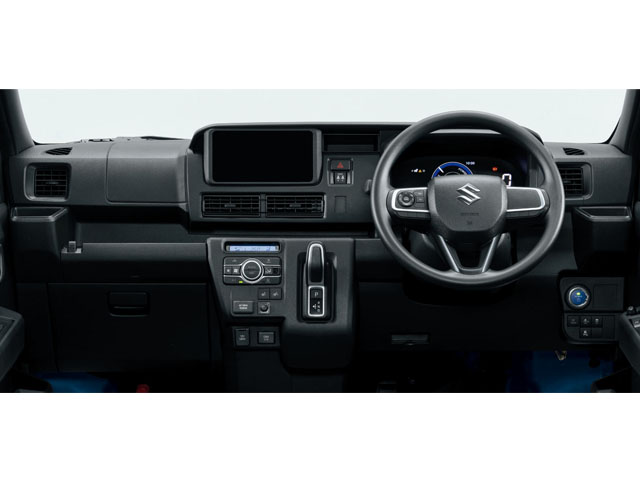
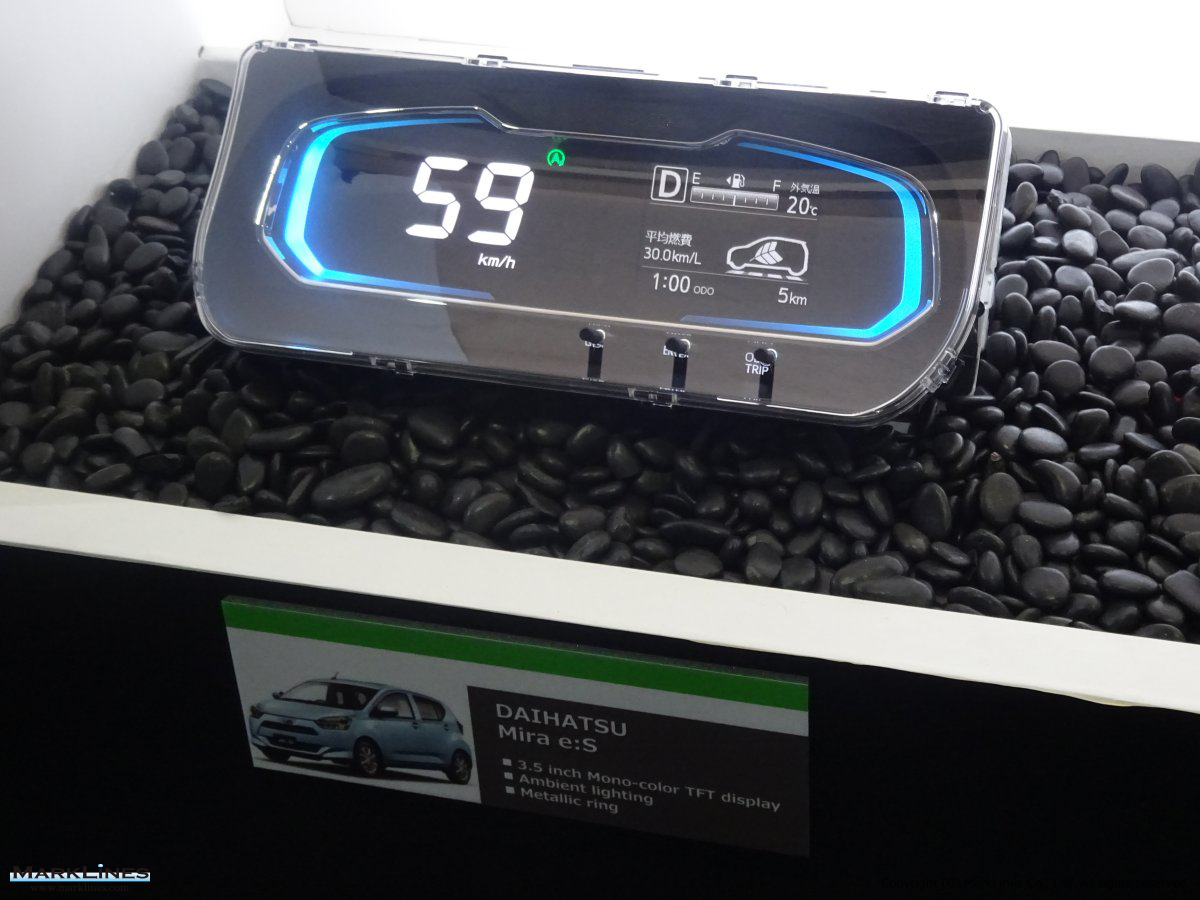
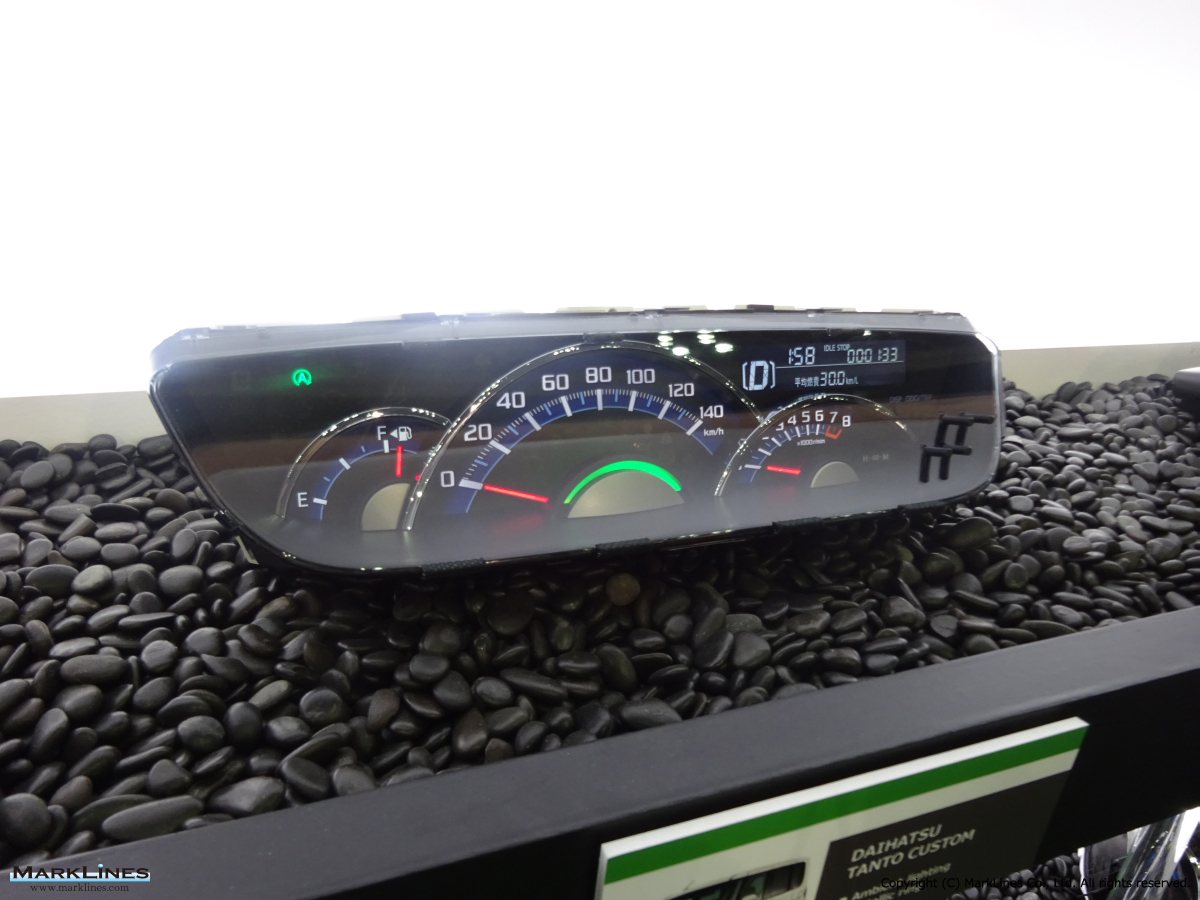
Instrument Cluster
 3
3
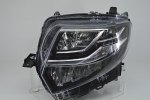
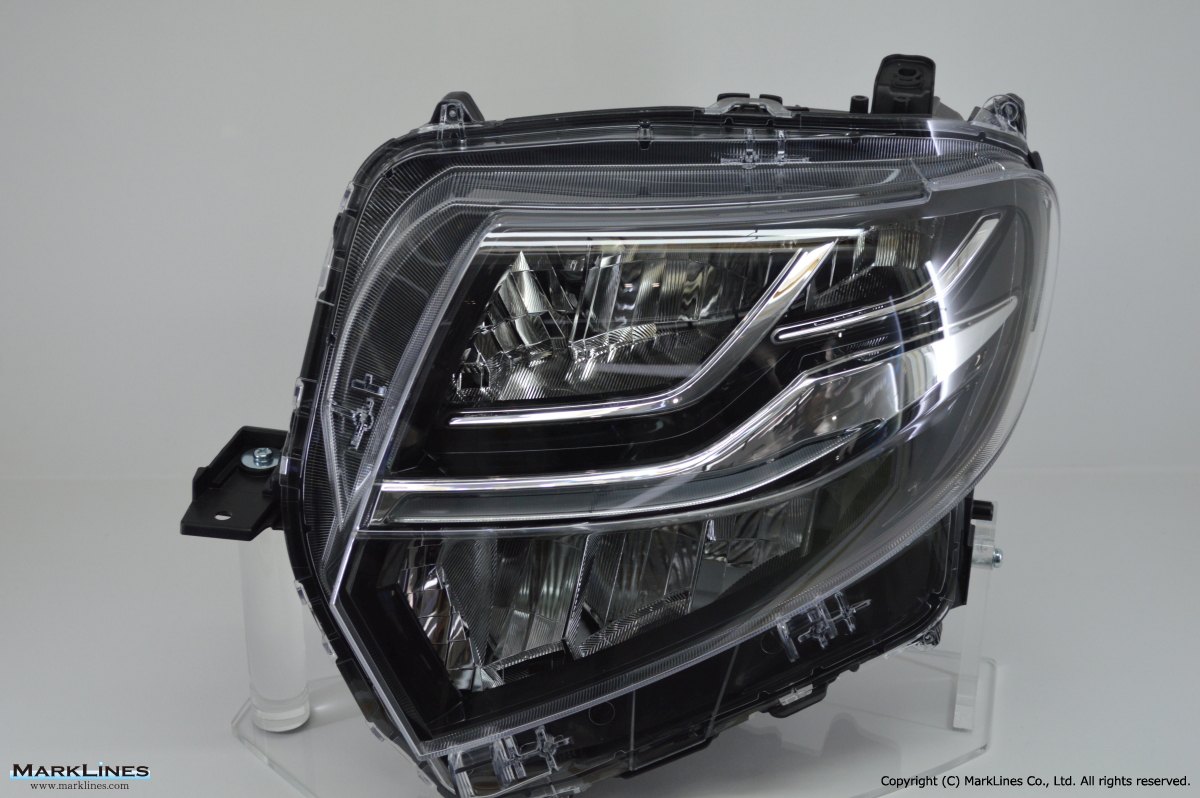
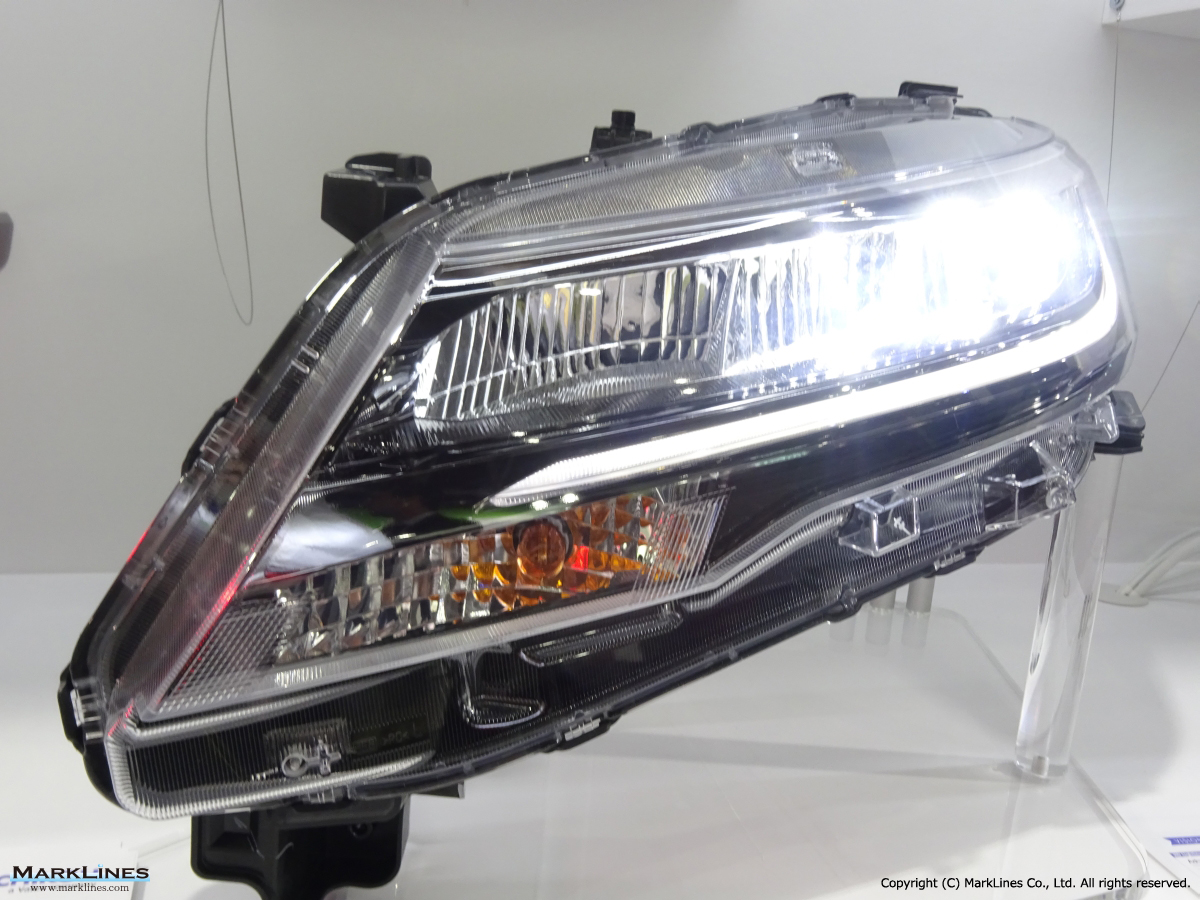
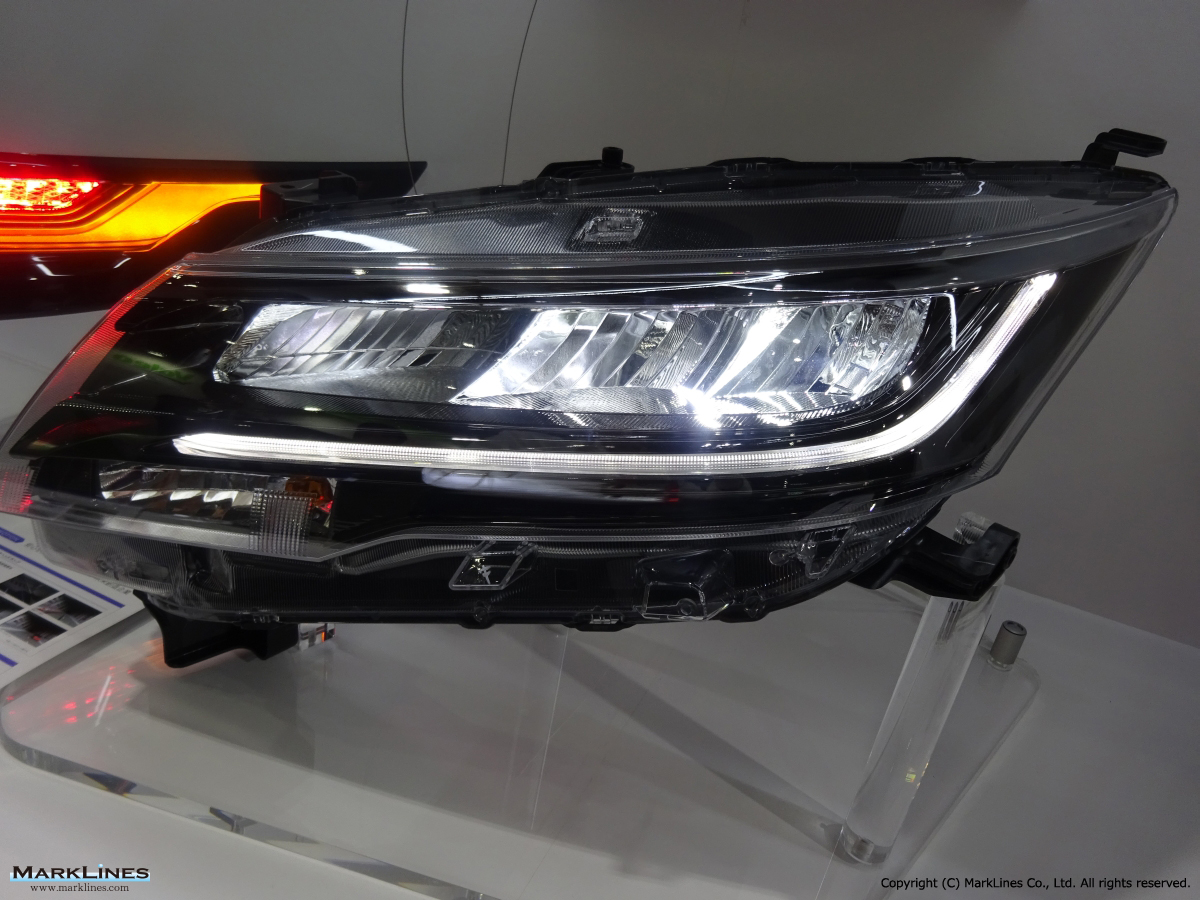
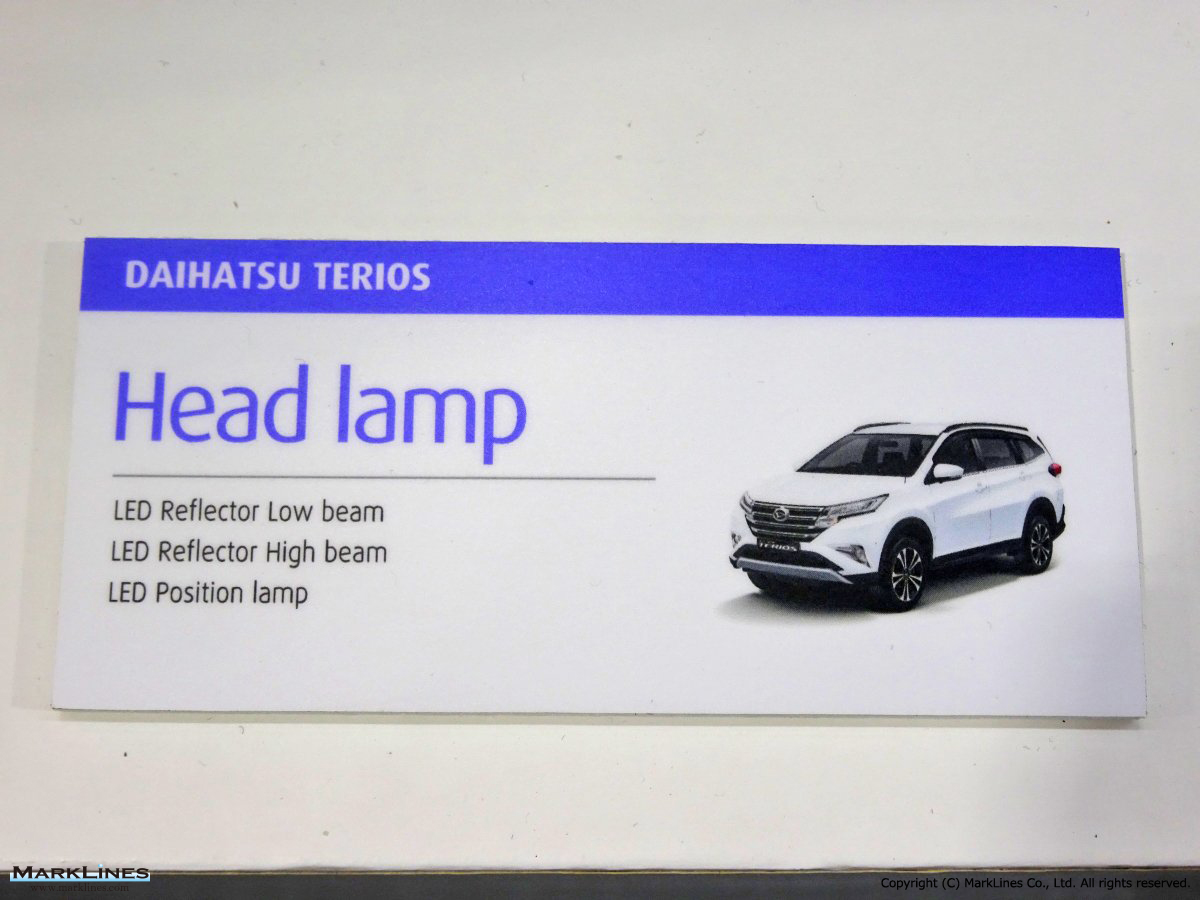
LED Head lamp
 1
1
Instrument cluster
 2
2
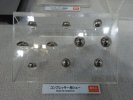
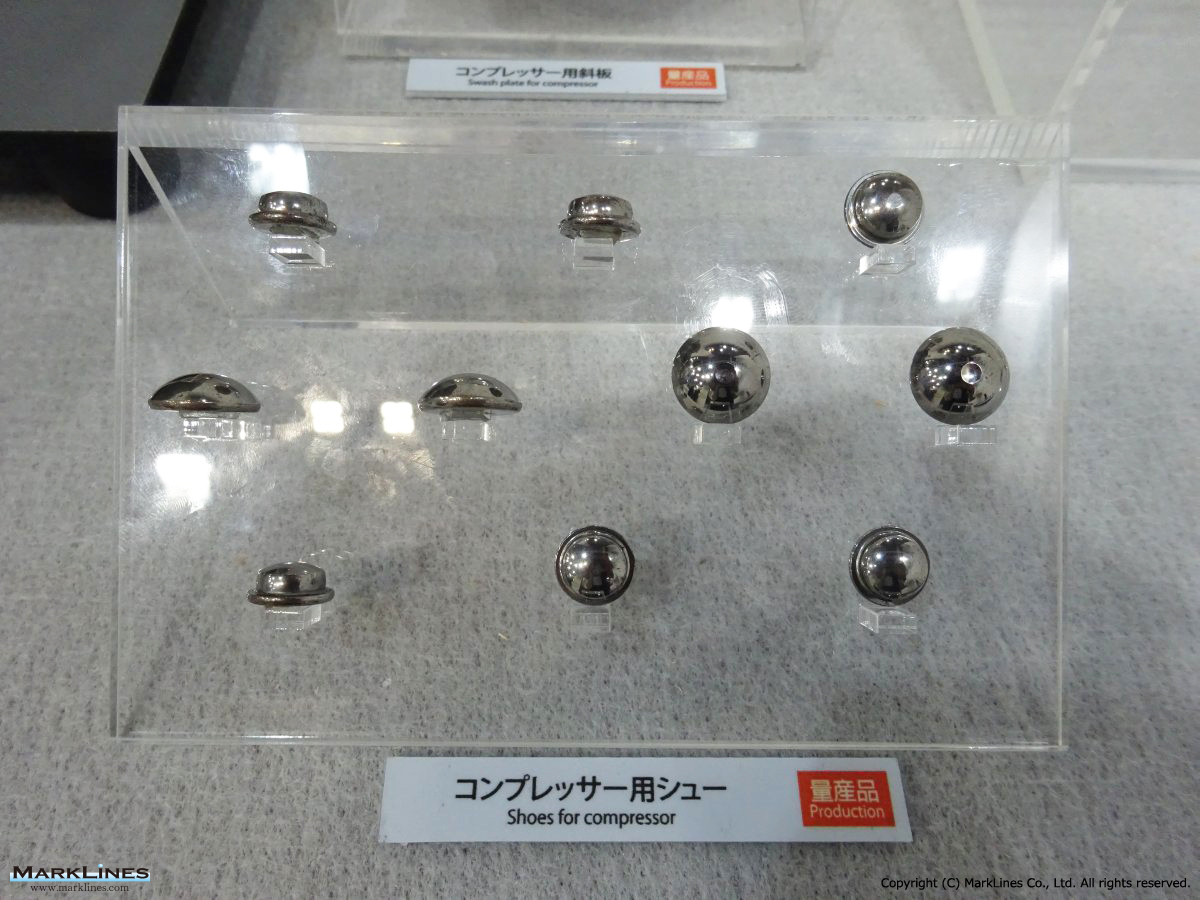
Shoes for compressor
 2
2
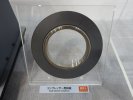
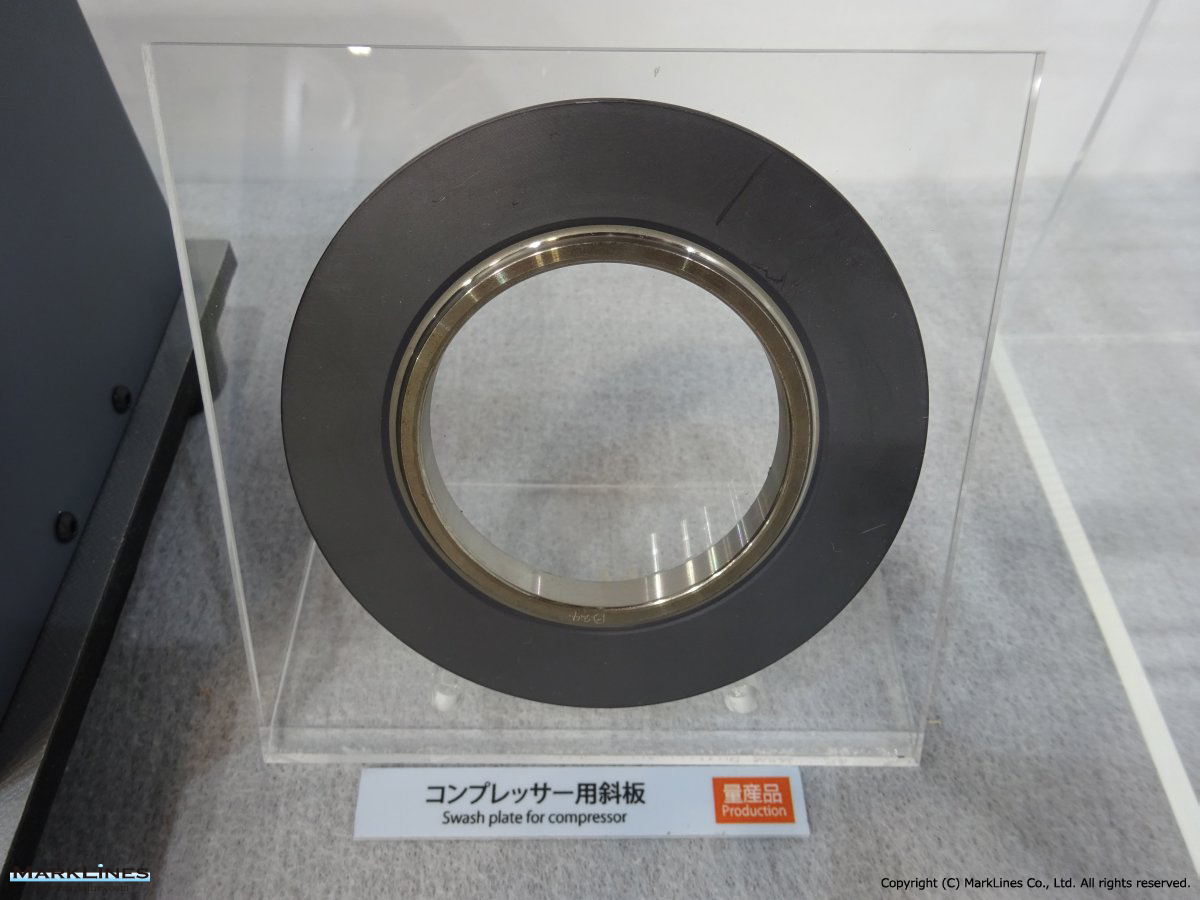
Swash plate for compressor
Sort by :
1 - 20 of 28 results
Japan - Automotive production in 2026 by OEM, vehicle type
Japan increased 0.5% y/y to 701,825 units.· February export volumes increased by 3.4% y/y to 351,924 units. Vehicle production volume of Japanese passenger car manufacturers Make PCs Y-o-Y CVs Y-o-Y Total Share Y-o-Y Toyota - - - - 278,916 39.7% -2.6% Suzuki - - - - 80,463 11.5% -1.1% Daihatsu - - - - 70,618 10.1% 13.3% Honda - - - - 67,550 9.6% 8.7% Mazda - - - - 67,375 9.6% 12.0% Nissan 43,839 -5.7% 5,698 -0.1% 49,537 7.1% -...
Automotive Production Data Updated at: 2026/03/30
Data changes for Production Statistics
d. As a result, the total production figure for the Taiwan 2024 will also be changed. Jul. 30, 2025 Germany France Spain Austria Turkiye Czech Rep. Hungary Morocco Production figures in 2024 have been updated. Jul. 29, 2025 Indonesia Production plant of Toyota Veloz has been changed from "Astra Daihatsu (Sunter)" to "Toyota Astra (Karawang)" since 2021. Jul. 16, 2025 Europe Germany, Italy, France, Spain, UK, Czech Rep., Belgium, Netherlands...
Automotive Production Data Updated at: 2026/03/17
2025 global production volume by Japanese OEMs
t.chg. Total Pct.chg. PCs CVs Total Pct.chg. Toyota 9,950,904 4.5% 3,275,628 4.7% - - 6,675,276 4.4% Suzuki 3,423,403 3.8% 956,204 -7.2% - - 2,467,199 8.7% Honda 3,396,057 -8.9% 689,802 -0.5% - - 2,706,255 -10.8% Nissan 2,950,035 -5.7% 565,444 -13.9% 503,245 62,199 2,384,591 -3.5% Daihatsu 1,530,549 16.3% 779,101 50.2% - - 751,448 -5.7% Mazda 1,156,707 -3.7% 716,690 -4.4% 716,690 0 440,017 -2.6% Mitsubishi 883,828 -6.4%...
Automotive Production Data Updated at: 2026/03/03
Japan - Automotive production in 2025 by OEM, vehicle type
re are cases where recently released data and detailed information in the database do not match up for reasons including different information sources, and discrepancies between preliminary reports and confirmed data. December production volumes for the 8 passenger car OEMs in Japan increased 1.7%, Daihatsu posts significant increase partly due to base effect from previous year, Toyota also performs well, while other manufacturers see YoY decline...
Automotive Production Data Updated at: 2026/02/26
Japan - Automotive production in 2024 by OEM, vehicle type
,996,384 units. Vehicle production volume of Japanese passenger car manufacturers (December 2024) Make PCs Y-o-Y CVs Y-o-Y Total Share Y-o-Y Toyota - - - - 255,402 39.6% -5.7% Suzuki - - - - 81,429 12.6% -8.7% Mazda 62,348 -6.5% 0 -% 62,348 9.7% -6.5% Honda - - - - 56,313 8.7% -18.7% Daihatsu - - - - 51,774 8.0% -0.9% Nissan 44,621 -20.7% 6,033 22.4% 50,654 7.8% -17.2% Subaru - - - - 48,405 7.5% -10.7% Mitsubishi - - - - 39,0...
Automotive Production Data Updated at: 2025/07/04
Japan - Flash report, Automotive production volume, 2023
(December 2023) Make PCs Y-o-Y CVs Y-o-Y Total Share Y-o-Y Toyota - - - - 270,802 38.4% 22.2% Suzuki - - - - 89,212 12.6% 7.4% Honda - - - - 69,261 9.8% 24.2% Mazda 66,713 7.0% 0 -% 66,713 9.5% 7.0% Nissan 56,268 5.9% 4,930 -14.6% 61,198 8.7% 3.9% Subaru - - - - 54,219 7.7% -5.3% Daihatsu - - - - 52,219 7.4% -33.1% Mitsubishi - - - - 41,624 5.9% -5.6% Total - - - - 705,248 100.0% 6.7% Vehicle production volume of Japan...
Automotive Production Data Updated at: 2025/06/04
Japan - Flash report, Automotive production volume, 2022
r December decreased 5.8% y/y to 334,092 units and for 2022 decreased 0.1% to 3,536,825 units. Vehicle production volume of Japanese passenger car manufacturers (December 2022) Make PCs Y-o-Y CVs Y-o-Y Total Share Y-o-Y Toyota - - - - 221,567 33.5% -15.0% Suzuki - - - - 83,069 12.6% 3.6% Daihatsu - - - - 78,028 11.8% -8.2% Mazda 62,347 -20.2% 0 -% 62,347 9.4% -20.2% Nissan 53,116 108.9% 5,771 36.1% 58,887 8.9% 98.5% Subaru - - - ...
Automotive Production Data Updated at: 2025/06/04
Japan - Flash report, Automotive production volume, 2021
% y/y to 7,391,194 units.· Exports for December increased 0.5% y/y to 354,813 units and for 2021 decreased 0.6% to 3,571,486 units.Vehicle production volume of Japanese passenger car manufacturers (December 2021) Make PCs Y-o-Y CVs Y-o-Y Total Share Y-o-Y Toyota - - - - 260,760 38.9% 3.2% Daihatsu - - - - 84,985 12.7% 1.0% Suzuki - - - - 80,178 12.0% -13.0% Mazda 78,104 -0.5% 0 -% 78,104 11.7% -0.5% Honda - - - - 66,411 9.9% 8.0% ...
Automotive Production Data Updated at: 2025/06/04
Japan - Flash report, Production volume, 2020
r December decreased 7.7% y/y to 352,992 units and for 2020 decreased 21.9% to 3,592,391 units. Vehicle production volume of Japanese passenger car manufacturers (December 2020) Make PCs Y-o-Y CVs Y-o-Y Total Share Y-o-Y Toyota - - - - 252,698 35.2% 6.3% Suzuki - - - - 92,110 12.8% 14.6% Daihatsu - - - - 84,110 11.7% 7.4% Mazda 78,490 10.1% 0 -100.0% 78,490 10.9% 8.8% Honda - - - - 61,486 8.6% 21.2% Subaru - - - - 58,964 8.2% 2.1...
Automotive Production Data Updated at: 2025/06/04
2023 global production volume by Japanese OEMs
,171 11.1% 3,370,752 26.9% - - 6,662,419 4.6% Honda 4,188,039 8.2% 718,521 11.6% - - 3,469,518 7.5% Nissan 3,444,164 5.9% 718,527 28.5% 647,945 70,582 2,725,637 1.3% Suzuki 3,224,996 1.7% 995,948 8.3% - - 2,229,048 -1.0% Daihatsu 1,669,230 -1.7% 820,965 -5.5% - - 848,265 2.4% Mazda 1,253,654 14.8% 839,170 14.2% 839,170 0 414,484 16....
Automotive Production Data Updated at: 2025/04/14
2022 global production volume by Japanese OEMs
5.2% 2,656,009 -7.7% 6,370,704 11.7% Honda 3,870,161 -6.4% 643,973 4.6% 3,226,188 -8.3% Nissan 3,250,800 -9.4% 559,314 12.6% 503,791 55,523 2,691,486 -12.9% Suzuki 3,172,192 10.7% 919,891 5.1% 2,252,301 13.1% Daihatsu 1,697,849 11.8% 869,161 -1.1% 828,688 29.6% Mazda 1,091,896 1.6% 734,833 -0.1% 734,833 0 357,063 5.2...
Automotive Production Data Updated at: 2025/04/14
2024 global production volume by Japanese OEMs
g. Total Pct.chg. PCs CVs Total Pct.chg. Toyota 9,521,876 -5.1% 3,128,351 -7.2% - - 6,393,525 -4.0% Honda 3,733,602 -10.9% 693,259 -3.5% - - 3,040,343 -12.4% Suzuki 3,299,602 2.3% 1,029,910 3.4% - - 2,269,692 1.8% Nissan 3,144,470 -8.7% 656,990 -8.6% 594,593 62,397 2,487,480 -8.7% Daihatsu 1,315,564 -21.2% 518,881 -36.8% - - 796,683 -6.0% Mazda 1,201,049 -4.2% 749,428 -10.7% 749,428 0 451,621 9.0% Mitsubishi 944,708 -7....
Automotive Production Data Updated at: 2025/03/28
2021 global production volume by Japanese OEMs (Preliminary)
8.5% 2,877,962 -1.5% - - 5,706,023 14.4% Honda 4,136,018 -6.0% 615,587 -15.6% - - 3,520,431 -4.1% Nissan 3,585,153 -1.2% 496,577 -2.5% 425,946 70,631 3,088,576 -1.0% Suzuki 2,865,652 11.1% 874,927 -5.8% - - 1,990,725 20.6% Daihatsu 1,515,130 8.6% 875,763 -3.8% - - 639,367 32.1% Mazda 1,074,987 -8.5% 735,649 -1.5% 735,649 0 339,338 -20...
Automotive Production Data Updated at: 2024/03/29
2020 global production volume by Japanese OEMs (Preliminary)
ct.chg. PCs CVs Total Pct.chg. Toyota 7,909,488 -12.6% 2,922,605 -14.4% - - 4,986,883 -11.5% Honda 4,398,583 -14.9% 729,500 -13.5% - - 3,669,083 -15.2% Nissan 3,629,672 -26.8% 509,224 -37.0% 428,017 81,207 3,120,448 -24.8% Suzuki 2,578,901 -15.5% 928,387 -1.9% - - 1,650,514 -21.7% Daihatsu 1,394,595 -18.9% 910,686 -4.5% - - 483,909 -36.8% Mazda 1,175,139 -21.0% 747,033 -26.1% 740,378 6,655 428,106 -10.4% Subaru 884,874 ...
Automotive Production Data Updated at: 2021/02/05
2019 global production volume by Japanese OEMs (Preliminary)
-3.5% 843,056 -5.4% - - 4,327,539 -3.1% Nissan 4,958,200 -9.6% 807,744 -13.2% 708,820 98,924 4,150,456 -8.9% Suzuki 3,055,860 -11.1% 946.768 -6.6% - - 2,109,092 -12.9% Mazda 1,487,917 -6.8% 1,010,275 1.4% 1,000,085 10,190 477,642 -20.5% Daihatsu 1,474,430 0.4% 953,541 2.4% - - 520,889 -3.1% Mitsubishi 1,368,599 -5.9% 619,464 -8.4% - - 749,135 -3.8% Suba...
Automotive Production Data Updated at: 2020/07/09
Japan - Flash report, Production volume, 2019
ts for December decreased 7.7% y/y to 382,512 units and for 2019 grew 0.6% to 4,600,911 units. Vehicle production volume of Japanese passenger car manufacturers (December 2019) Make PCs Y-o-Y CVs Y-o-Y Total Share Y-o-Y Toyota - - - - 237,631 34.4% -1.1% Suzuki - - - - 80,342 11.6% -4.9% Daihatsu - - - - 78,334 11.4% 2.8% Mazda 71,272 -17.3% 884 -2.9% 72,156 10.5% -17.1% Nissan 52,967 -19.8% 8,234 -4.9% 61,201 8.9% -18.1% Subaru ...
Automotive Production Data Updated at: 2020/01/31
2018 global production volume by Japanese OEMs (Preliminary)
4.9% 930,997 -8.7% 823,515 107,482 4,555,909 -4.1% Honda 5,357,013 2.3% 891,248 9.0% - - 4,465,765 1.1% Suzuki 3,436,589 4.1% 1,013,916 2.7% - - 2,422,673 4.7% Mazda 1,596,767 -0.7% 996,264 2.6% 984,291 11,973 600,503 -5.6% Daihatsu 1,466,968 16.1% 929,401 1.1% 756,745 172,656 537,567 56.3% Mitsubishi 1,455,067 20.2% 676,317 16.7% - - 778...
Automotive Production Data Updated at: 2019/02/01
Japan - Flash report, Production volume, 2018
e production volume of Japanese passenger car manufacturers (December 2018) Make PCs Y-o-Y CVs Y-o-Y Total Share Y-o-Y Toyota 216,860 -8.2% 23,500 -10.5% 240,360 31.9% -8.4% Mazda 86,168 4.5% 910 28.5% 87,078 11.6% 4.7% Suzuki - - - - 84,479 11.2% 3.4% Honda - - - - 81,821 10.9% 6.6% Daihatsu 61,805 -1.1% 14,398 -3.0% 76,203 10.1% -1.5% Nissan 66,039 2.8% 8,654 72.6% 74,693 9.9% 7.9% Mitsubishi - - - - 57,223 7.6% 23.9% Subar...
Automotive Production Data Updated at: 2019/01/31
Japan - Flash report, Production volume, 2017
grew 1.9% to 4,434,134 units. Vehicle production volume of Japanese passenger car manufacturers (December 2017) Make PCs Y-o-Y CVs Y-o-Y Total Share Y-o-Y Toyota 236,146 7.7% 26,255 16.6% 262,401 34.6% 8.5% Mazda 82,469 8.4% 708 -4.1% 83,177 11.0% 8.3% Suzuki - - - - 81,693 10.8% 20.7% Daihatsu 62,496 5.4% 14,840 26.1% 77,336 10.2% 8.8% Honda - - - - 76,758 10.1% -1.5% Nissan 64,213 -26.9% 5,013 -45.4% 69,226 9.1% -28.7% Subaru...
Automotive Production Data Updated at: 2018/09/27
2017 global production volume by Japanese OEMs (Preliminary)
56 0.7% 2,869,600 319,956 5,817,955 0.2% Nissan 5,769,277 3.8% 1,019,972 7.4% 921,505 98,467 4,749,305 3.1% Honda 5,236,842 4.8% 817,500 -0.3% - - 4,419,342 5.8% Suzuki 3,302,336 12.1% 987,537 24.3% - - 2,314,799 7.6% Mazda 1,607,602 1.4% 971,455 -0.6% 961,039 10,416 636,147 4.5% Daihatsu 1,263,396 19.0% 919,516 27.2% 749,828 169,688 343,880 1.6% Mitsubishi 1,210,263 10.9% 579,642 4.4% - - 630,621 17.5% Subaru 1,073,057...
Automotive Production Data Updated at: 2018/02/01


 Japan
Japan USA
USA Mexico
 Germany
 China (Shanghai)
 Thailand
 India
India