


Search Results by Category
All information related to {{ key_word }}.
AI Navigator will guide you. Click here for information about {{ key_word }}.
Images
 1
1
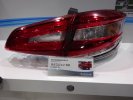
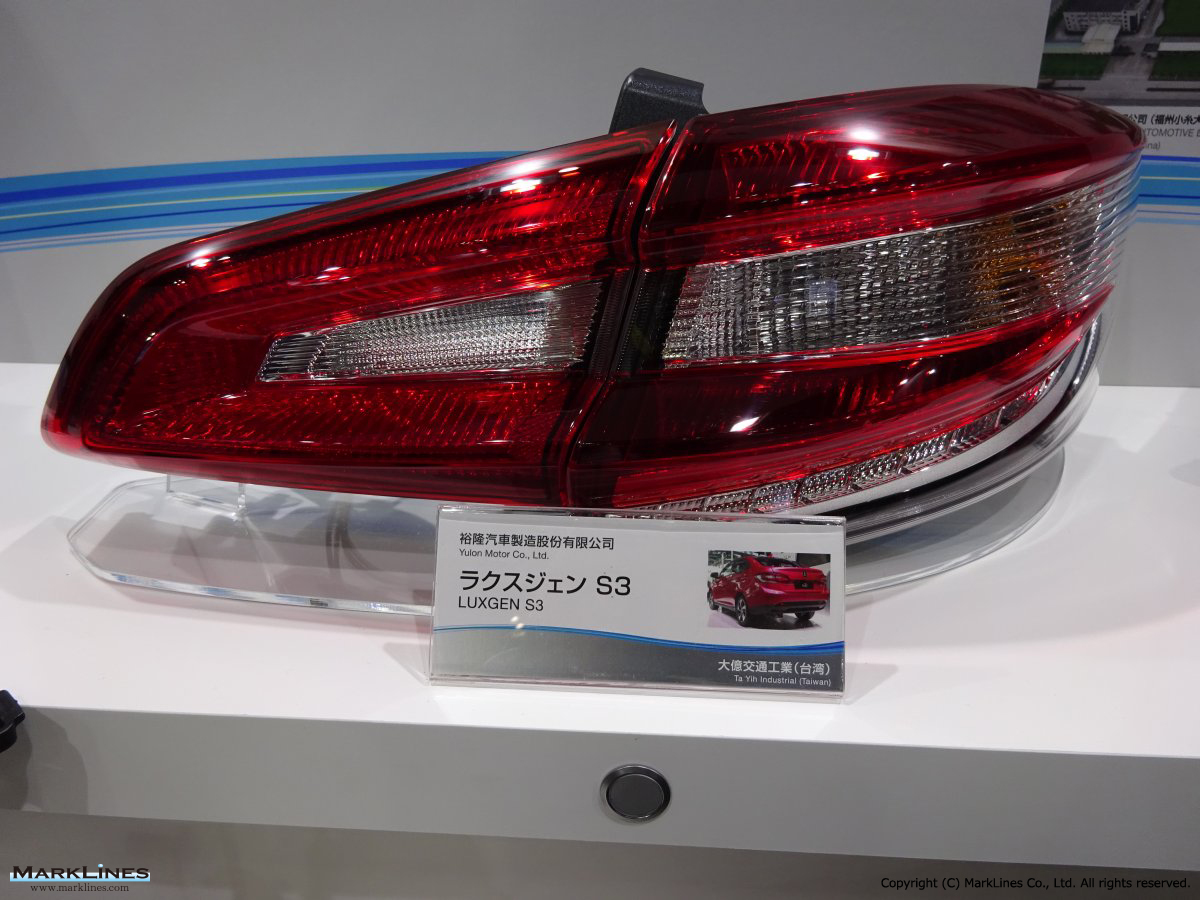
Rear lamp
 1
1
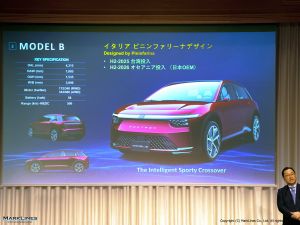
Foxtron’s Model B electric SUV approved for sale, with launch expected in Q4
 1
1
Mitsubishi Motors and Foxtron sign MOU for OEM supply of EV
Sort by :
1 - 15 of 15 results
Data changes for Production Statistics
ted, some of the figures may change. Dec. 10, 2014 Canada -Since October 2014, monthly production volume in Canada is updated twice for the preliminary and final data. Therefore, when the final data is updated, some of the figures may change. Oct. 23, 2014 Taiwan Production volume of Nissan and Yulon Motor for September 2014 has been revised. Oct. 20, 2014 Russia Production volume of Renault Logan and Renault Sandero in Russia has been corr...
Automotive Production Data Updated at: 2026/03/17
Taiwan - Automotive production in 2026 by OEM, vehicle type
hicles Commercial Vehicles Total Share Kuozui 5,891 716 348 6,955 50.4% 8,813 1,032 422 10,267 57.3% -32.3% China Motor 794 1,762 0 2,556 18.5% 844 2,228 0 3,072 17.2% -16.8% Taiwan Honda 1,769 0 0 1,769 12.8% 1,423 0 0 1,423 7.9% 24.3% KGM 660 255 0 915 6.6% 816 413 0 1,229 6.9% -25.5% Yulon 884 0 0 884 6.4% 1,065 0 0 1,065 5.9% -17.0% Ford Lio Ho N/A N/A N/A 724 5.2% N/A N/A N/A 795 4.4% -8.9% Formosa 0 0 7 7 0.1% 0 18 36 54 0.3...
Automotive Production Data Updated at: 2026/03/11
Taiwan - Automotive production in 2025 by OEM, vehicle type
cle Make Dec. 2025 Dec. 2024 Y-o-Y PCs LCVs CVs Total Share PCs LCVs CVs Total Share Kuozui 10,270 1,587 297 12,154 58.5% 11,900 2,204 372 14,476 63.3% -16.0% China Motor 162 2,573 0 2,735 13.2% 347 2,078 0 2,425 10.6% 12.8% Taiwan Honda 2,507 0 0 2,507 12.1% 1,903 0 0 1,903 8.3% 31.7% Yulon 1,901 0 0 1,901 9.2% 1,656 0 0 1,656 7.2% 14.8% KGM 1,165 306 0 1,471 7.1% 1,112 552 0 1,664 7.3% -11.6% Formosa 0 0 2 2 0.0% 0 36 35 71 0.3...
Automotive Production Data Updated at: 2026/02/12
Taiwan - Automotive production in 2024 by OEM, vehicle type
le Make Dec. 2024 Dec. 2023 Y-o-Y PCs LCVs CVs Total Share PCs LCVs CVs Total Share Kuozui 11,900 2,204 372 14,476 68.2% 11,462 1,907 166 13,535 58.0% 7.0% China Motor 347 2,078 0 2,425 11.4% 2,269 1,953 0 4,222 18.1% -42.6% Taiwan Honda 1,903 0 0 1,903 9.0% 2,295 0 0 2,295 9.8% -17.1% Yulon 1,656 0 0 1,656 7.8% 1,330 0 0 1,330 5.7% 24.5% Ford Lio Ho 311 378 0 689 3.2% 82 99 0 181 0.8% 280.7% Formosa 0 36 35 71 0.3% 0 0 21 21 0.1...
Automotive Production Data Updated at: 2025/07/04
Taiwan - Flash report, Automotive production volume, 2023
are PCs LCVs CVs Total Share Kuozui 11,462 1,907 166 13,535 60.2% 10,380 1,351 1,003 12,734 52.6% 6.3% China Motor 2,269 1,130 0 3,399 15.1% 897 2,481 0 3,378 14.0% 0.6% Taiwan Honda 2,295 0 0 2,295 10.2% 2,286 0 0 2,286 9.4% 0.4% Sangyang 1,379 360 0 1,739 7.7% 851 443 0 1,294 5.3% 34.4% Yulon 1,330 0 0 1,330 5.9% 3,028 0 0 3,028 12.5% -56.1% Ford Lio Ho 82 99 0 181 0.8% 815 563 0 1,378 5.7% -86.9% Formosa 0 0 21 21 0.1% 0 0 99 99 ...
Automotive Production Data Updated at: 2025/06/04
Taiwan - Flash report, Automotive production volume, 2022
eliminary reports and confirmed data. Taiwan - Production of vehicle Make Dec. 2022 Dec. 2021 Y-o-Y PCs LCVs CVs Total Share PCs LCVs CVs Total Share Kuozui 10,380 1,351 1,003 12,734 52.6% 11,066 517 520 12,103 49.5% 5.2% China Motor 897 2,481 0 3,378 14.0% 653 3,092 0 3,745 15.3% -9.8% Yulon 3,028 0 0 3,028 12.5% 2,511 0 0 2,511 10.3% 20.6% Taiwan Honda 2,286 0 0 2,286 9.4% 1,862 0 0 1,862 7.6% 22.8% Ford Lio Ho 815 563 0 1,378 5...
Automotive Production Data Updated at: 2025/06/04
Taiwan - Flash report, Automotive production volume, 2021
ake Dec. 2021 Dec. 2020 Y-o-Y PCs LCVs CVs Total Share PCs LCVs CVs Total Share Kuozui 11,066 517 520 12,103 49.5% 12,269 564 867 13,700 45.9% -11.7% China Motor 653 3,092 0 3,745 15.3% 1,007 3,437 0 4,444 14.9% -15.7% Ford Lio Ho 1,610 1,391 - 3,001 12.3% 1,296 2,150 0 3,446 11.5% -12.9% Yulon 2,511 0 0 2,511 10.3% 3,907 0 0 3,907 13.1% -35.7% Taiwan Honda 1,862 0 0 1,862 7.6% 2,927 0 0 2,927 9.8% -36.4% Sangyang 990 94 0 1,084 4.4...
Automotive Production Data Updated at: 2025/06/04
Taiwan - Flash report, Production volume, 2020
minary reports and confirmed data. Taiwan - Production of vehicle Make Dec. 2020 Dec. 2019 Y-o-Y PCs LCVs CVs Total Share PCs LCVs CVs Total Share Kuozui 12,269 564 867 13,700 45.9% 9,255 1,082 250 10,587 41.3% 29.4% China Motor 1,007 3,437 0 4,444 14.9% 954 3,925 130 5,009 19.6% -11.3% Yulon 3,907 0 0 3,907 13.1% 3,928 0 0 3,928 15.3% -0.5% Ford Lio Ho 1,296 2,150 - 3,446 11.5% 1,295 641 0 1,936 7.6% 78.0% Taiwan Honda 2,927 0 0 ...
Automotive Production Data Updated at: 2025/06/04
Taiwan - Flash report, Production volume, 2019
iminary reports and confirmed data. Taiwan - Production of vehicle Make Dec. 2019 Dec. 2018 Y-o-Y PCs LCVs CVs Total Share PCs LCVs CVs Total Share Kuozui 9,255 1,082 250 10,587 41.3% 4,844 1,094 486 6,424 33.9% 64.8% China Motor 954 3,925 130 5,009 19.6% 717 3,040 110 3,867 20.4% 29.5% Yulon 3,928 0 0 3,928 15.3% 3,676 0 0 3,676 19.4% 6.9% Taiwan Honda 3,315 0 0 3,315 12.9% 2,973 0 0 2,973 15.7% 11.5% Ford Lio Ho 1,295 641 - 1,93...
Automotive Production Data Updated at: 2020/01/10
Taiwan - Flash report, Production volume, 2018
reliminary reports and confirmed data. Taiwan - Production of vehicle Make Dec. 2018 Dec. 2017 Y-o-Y PCs LCVs CVs Total Share PCs LCVs CVs Total Share Kuozui 4,844 1,094 486 6,424 33.9% 8,497 893 194 9,584 38.9% -33.0% China Motor 717 3,040 110 3,867 20.4% 853 3,023 84 3,960 16.1% -2.3% Yulon 3,676 0 0 3,676 19.4% 5,366 0 0 5,366 21.8% -31.5% Taiwan Honda 2,973 0 0 2,973 15.7% 2,966 0 0 2,966 12.0% 0.2% Sangyang 743 240 0 983 5.2%...
Automotive Production Data Updated at: 2019/01/15
Taiwan - Flash report, Production volume, 2017
including different information sources, and discrepancies between preliminary reports and confirmed data. Taiwan - Production of vehicle Make Dec. 2017 Dec. 2016 Y-o-Y PCs LCVs CVs Total Share PCs LCVs CVs Total Share Kuozui 8,497 893 194 9,584 38.9% 11,110 1,127 183 12,420 46.0% -22.8% Yulon 5,366 0 0 5,366 21.8% 5,168 0 0 5,168 19.1% 3.8% China Motor 853 3,023 84 3,960 16.1% 839 3,102 31 3,972 14.7% -0.3% Taiwan Honda 2,966 0 0 ...
Automotive Production Data Updated at: 2018/07/25
Taiwan - Flash report, Production volume, 2016
luding different information sources, and discrepancies between preliminary reports and confirmed data. Taiwan - Production of vehicle Make Dec. 2016 Dec. 2015 Y-o-Y PCs LCVs CVs Total Share PCs LCVs CVs Total Share Kuozui 11,110 1,127 183 12,420 46.0% 16,573 1,077 174 17,824 60.1% -30.3% Yulon 5,168 0 0 5,168 19.1% 4,282 0 0 4,282 14.4% 20.7% China Motor 839 3,102 31 3,972 14.7% 649 2,839 45 3,533 11.9% 12.4% Taiwan Honda 2,591 0 0...
Automotive Production Data Updated at: 2017/01/11
Taiwan - Flash report, Production volume, 2015
fer from data in the detail report to be announced at a later date due to a difference in the data source. Taiwan - Production of vehicle Make Dec. 2015 Dec. 2014 Y-o-Y PCs LCVs CVs Total Share PCs LCVs CVs Total Share Kuozui 16,573 1,077 174 17,824 60.1% 19,124 992 189 20,305 55.7% -12.2% Yulon 4,282 0 0 4,282 14.4% 5,023 0 5 5,028 13.8% -14.8% China Motor 649 2,839 45 3,533 11.9% 1,711 2,659 79 4,449 12.2% -20.6% Taiwan Honda 2,190...
Automotive Production Data Updated at: 2016/04/25
Taiwan - Flash report, Production volume, 2014
differ from data in the detail report to be announced at a later date due to a difference in the data source. Taiwan - Production of vehicle Make Dec. 2014 Dec. 2013 Y-o-Y PCs LCVs CVs Total Share PCs LCVs CVs Total Share Kuozui 19,124 992 189 20,305 55.7% 16,894 640 144 17,678 53.5% 14.9% Yulon 5,023 0 5 5,028 13.8% 4,727 0 0 4,727 14.3% 6.4% China Motor 1,711 2,659 79 4,449 12.2% 1,606 2,977 73 4,656 14.1% -4.4% Taiwan Honda 2,860 ...
Automotive Production Data Updated at: 2015/01/13
Taiwan - Flash report, Production volume, 2013
ffer from data in the detail report to be announced at a later date due to a difference in the data source. Taiwan - Production of vehicle Make Dec. 2013 Dec. 2012 Y-o-Y PCs LCVs CVs Total Share PCs LCVs CVs Total Share Kuozui 16,894 640 144 17,678 53.5% 14,074 823 295 15,192 54.8% 16.4% Yulon 4,727 0 0 4,727 14.3% 2,442 0 68 2,510 9.1% 88.3% China Motor 1,606 2,977 73 4,656 14.1% 1,556 2,733 3 4,292 15.5% 8.5% Ford Lio Ho 2,080 66...
Automotive Production Data Updated at: 2014/01/15


 Japan
Japan USA
USA Mexico
 Germany
 China (Shanghai)
 Thailand
 India
India