


Search Results by Category
All information related to {{ key_word }}.
AI Navigator will guide you. Click here for information about {{ key_word }}.
Images
 6
6
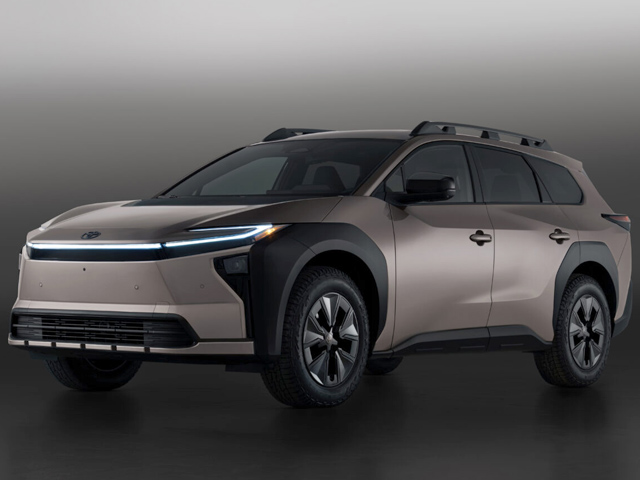
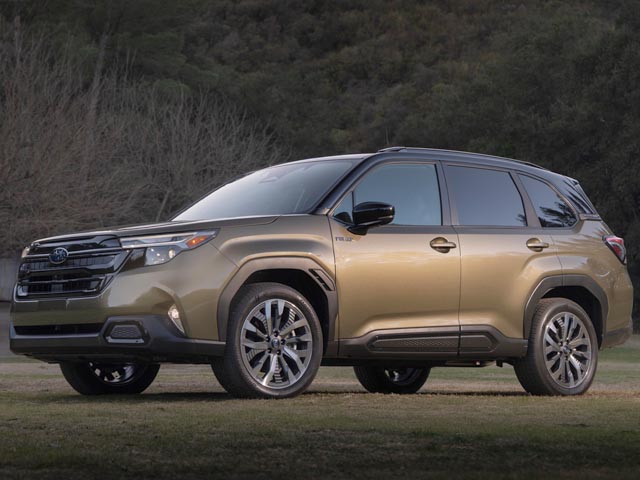
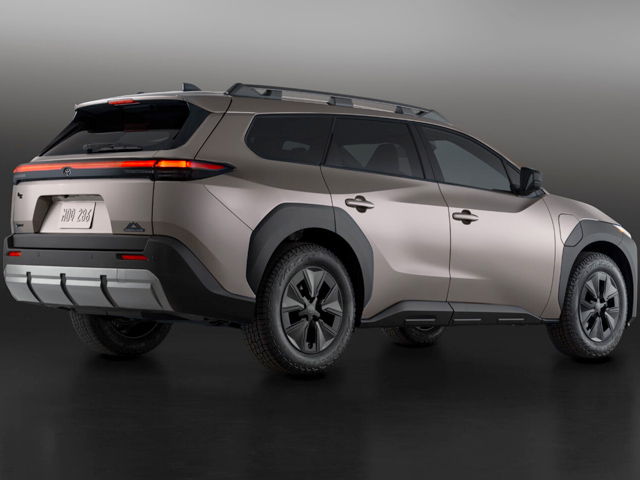
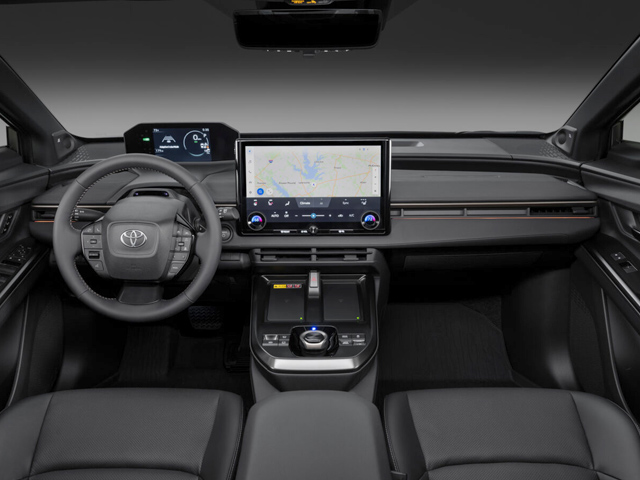
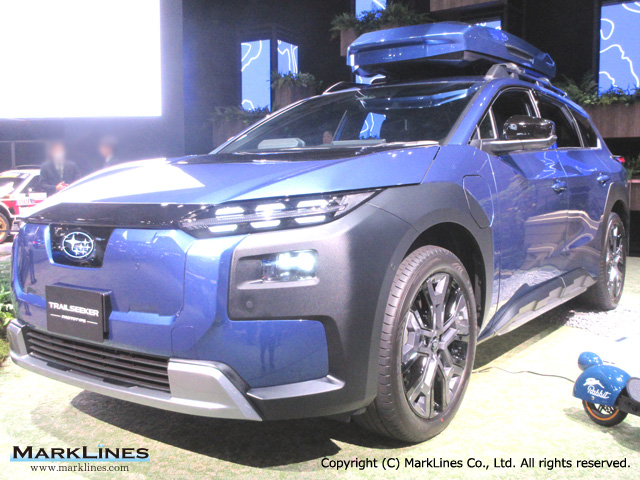
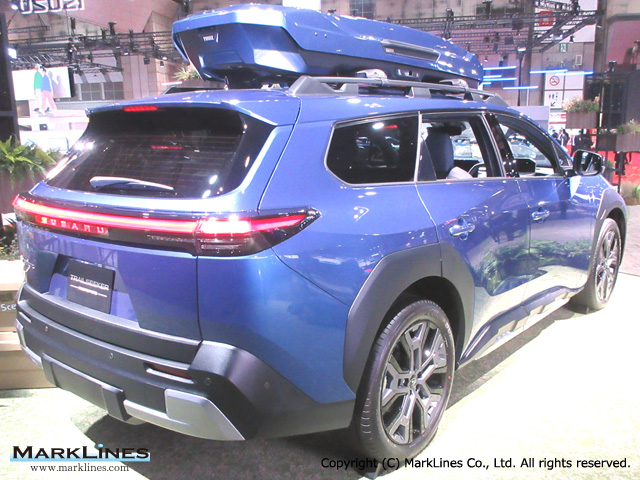
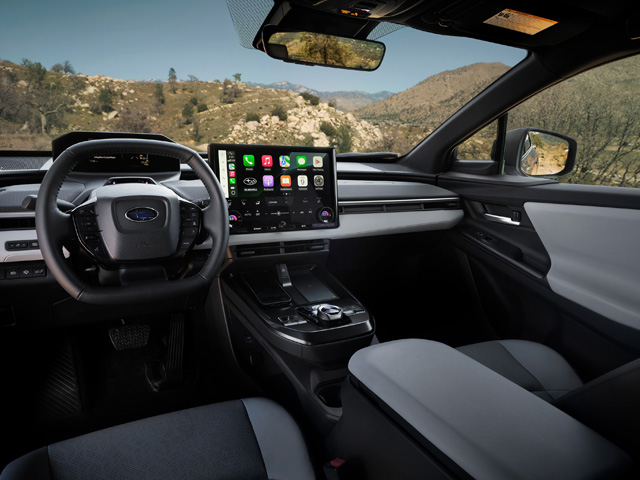
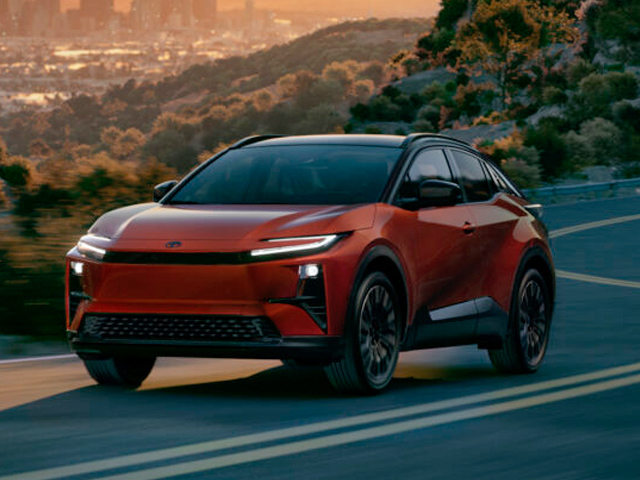
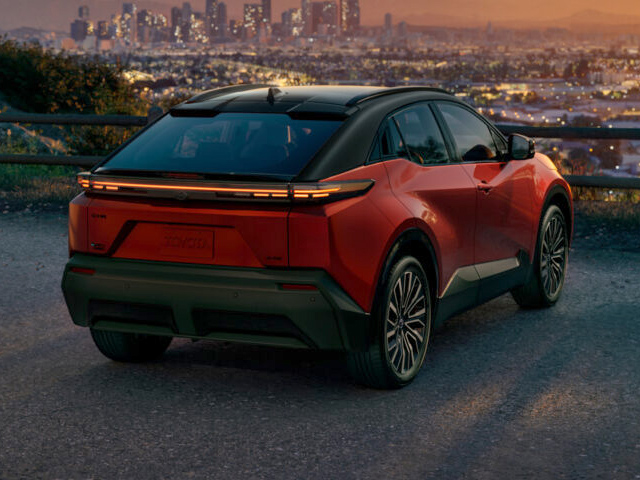
bZ4X Touring/bZ Woodland/Trailseeker/E-Outback
 8
8
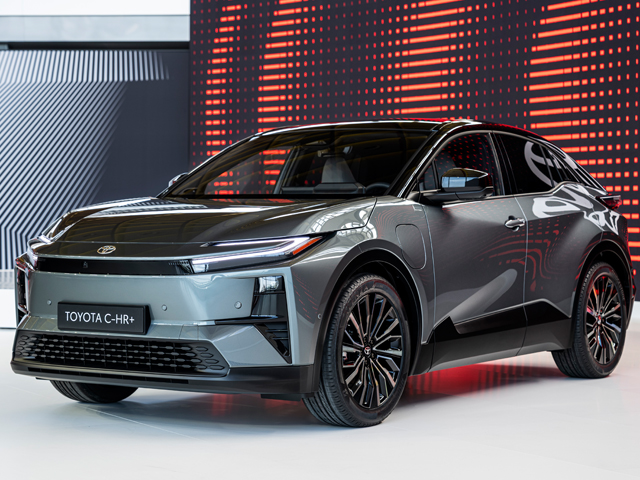
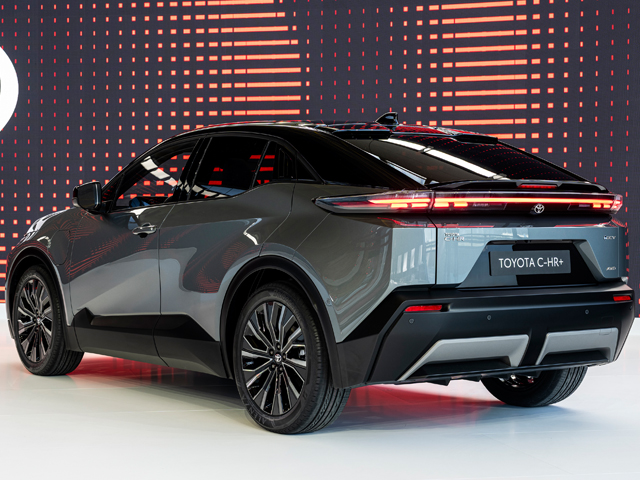
C-HR+/C-HR/Uncharted
 3
3
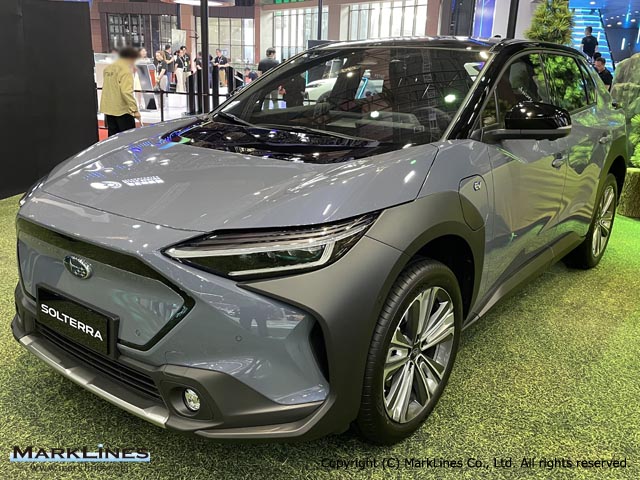
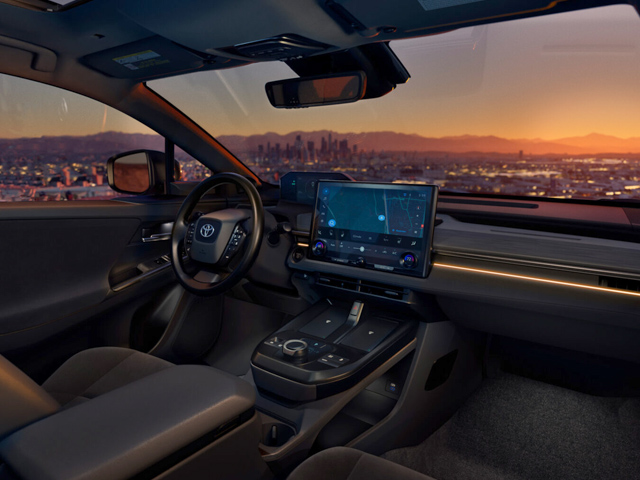
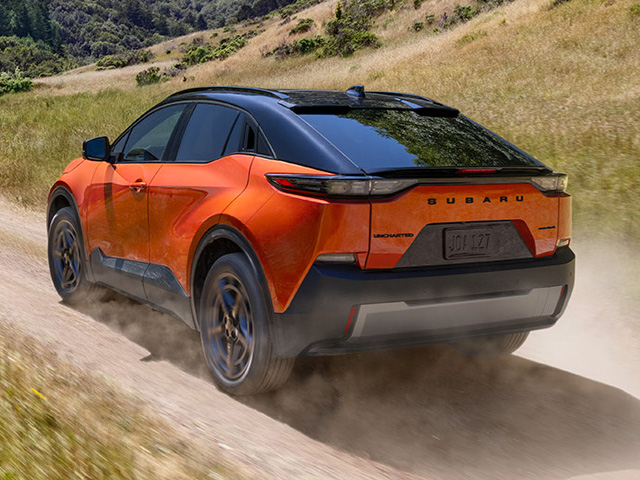
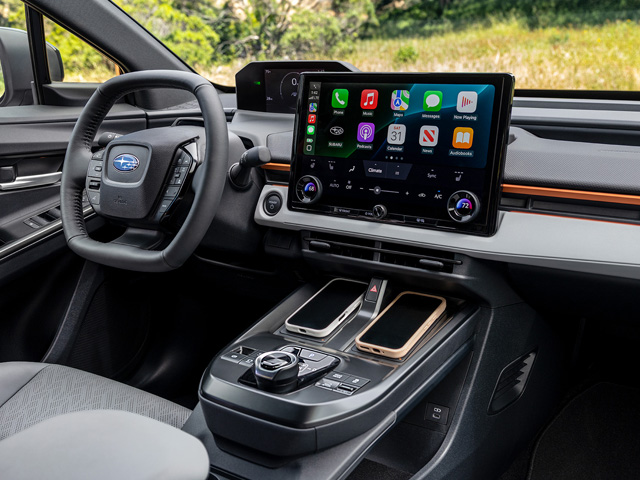
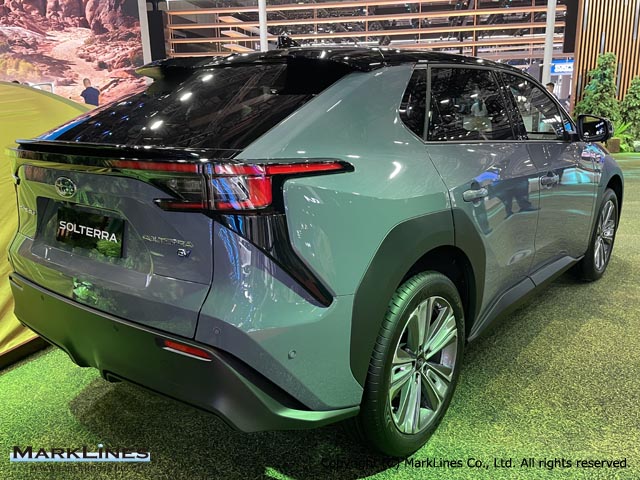
Solterra
 3
3
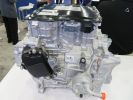
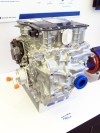
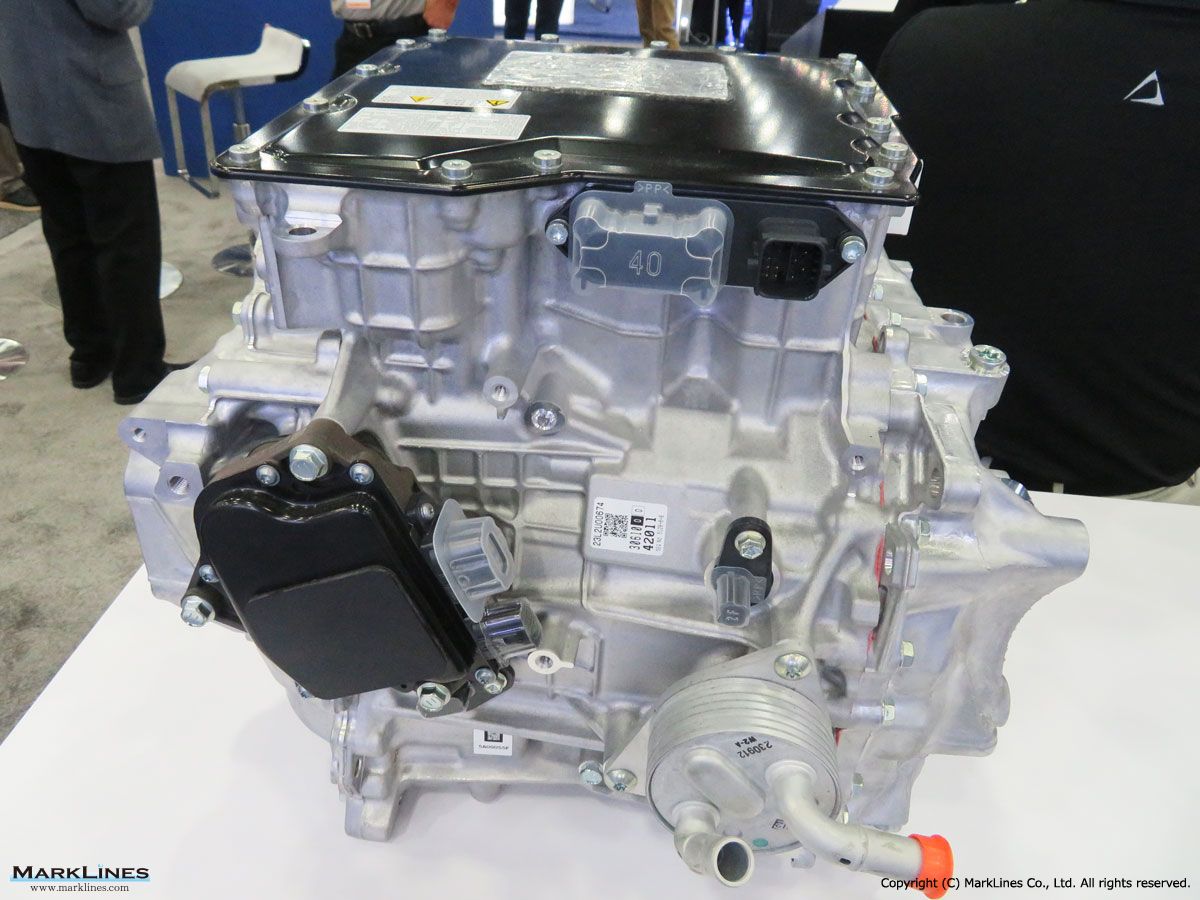
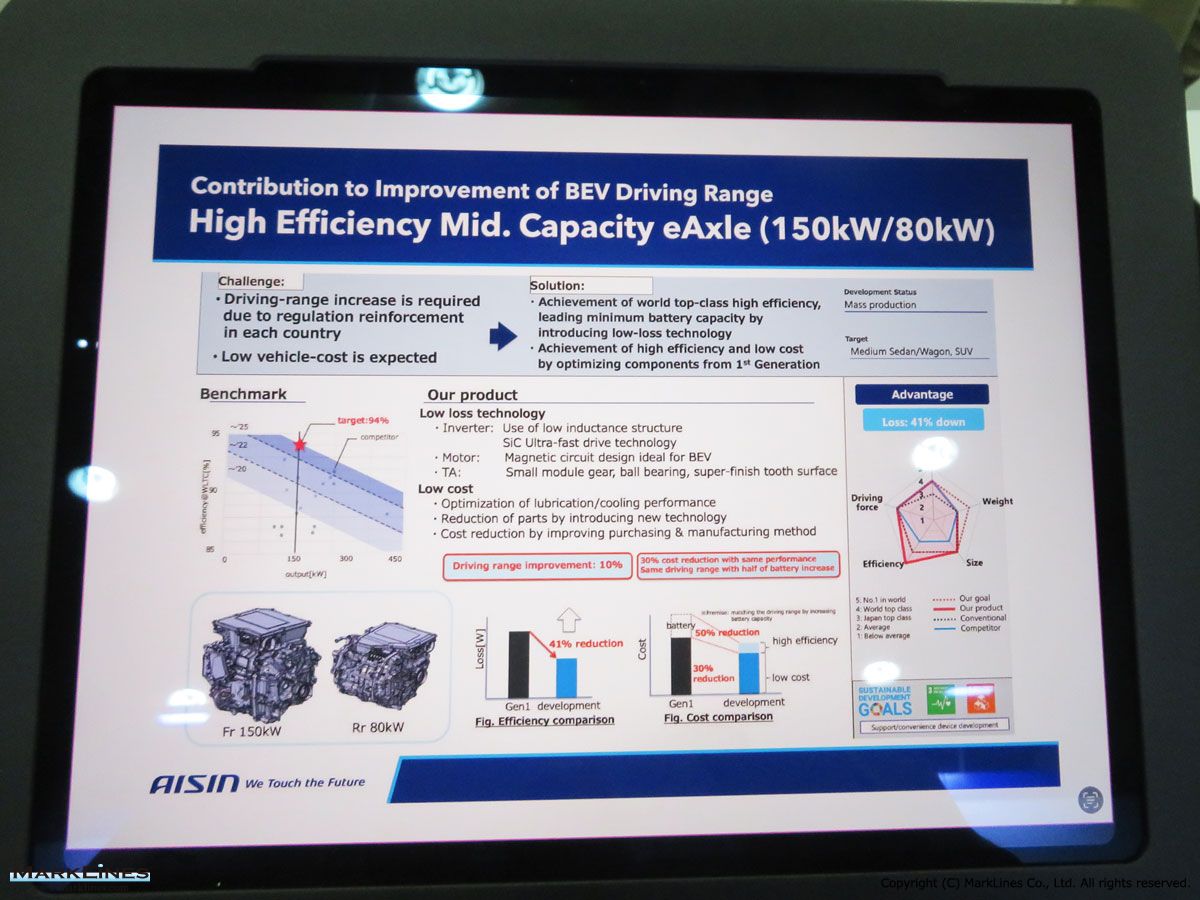
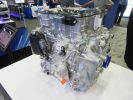
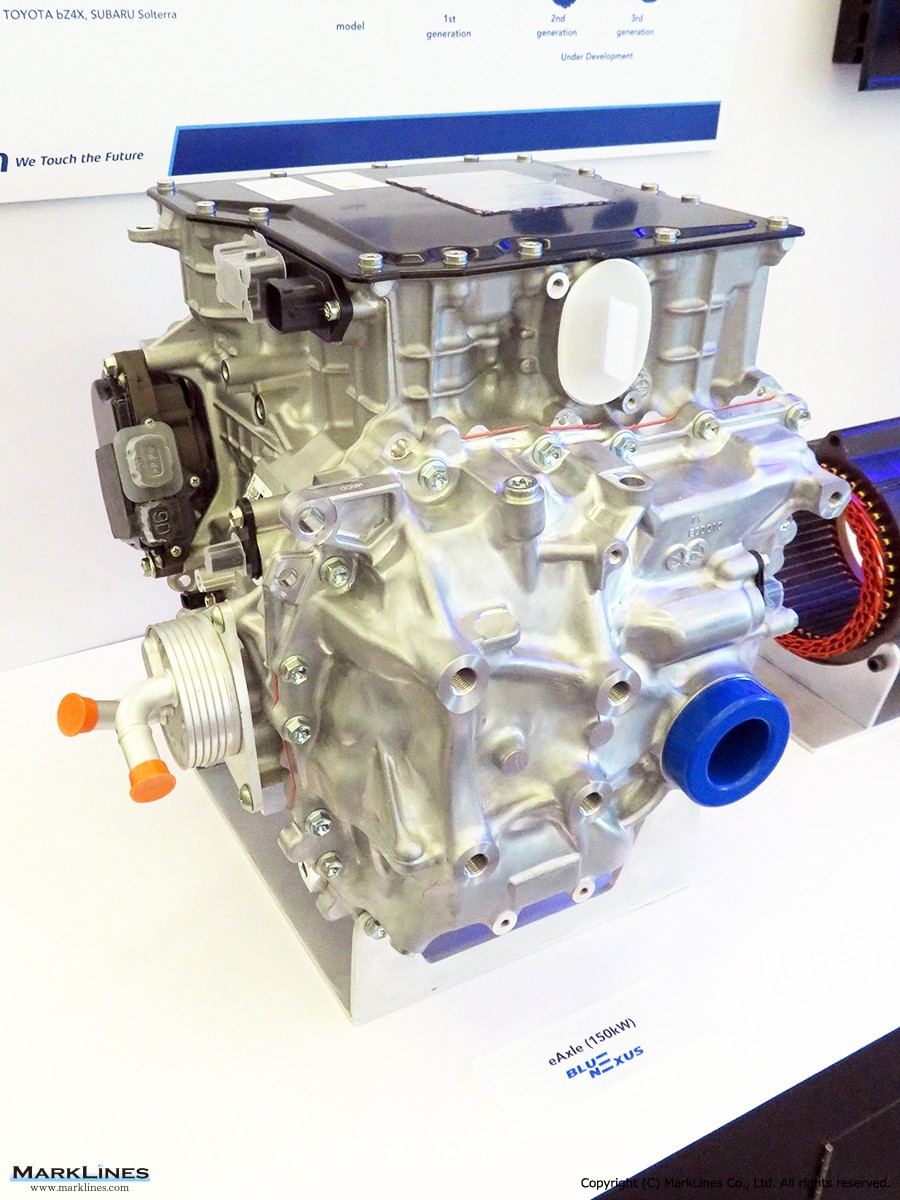
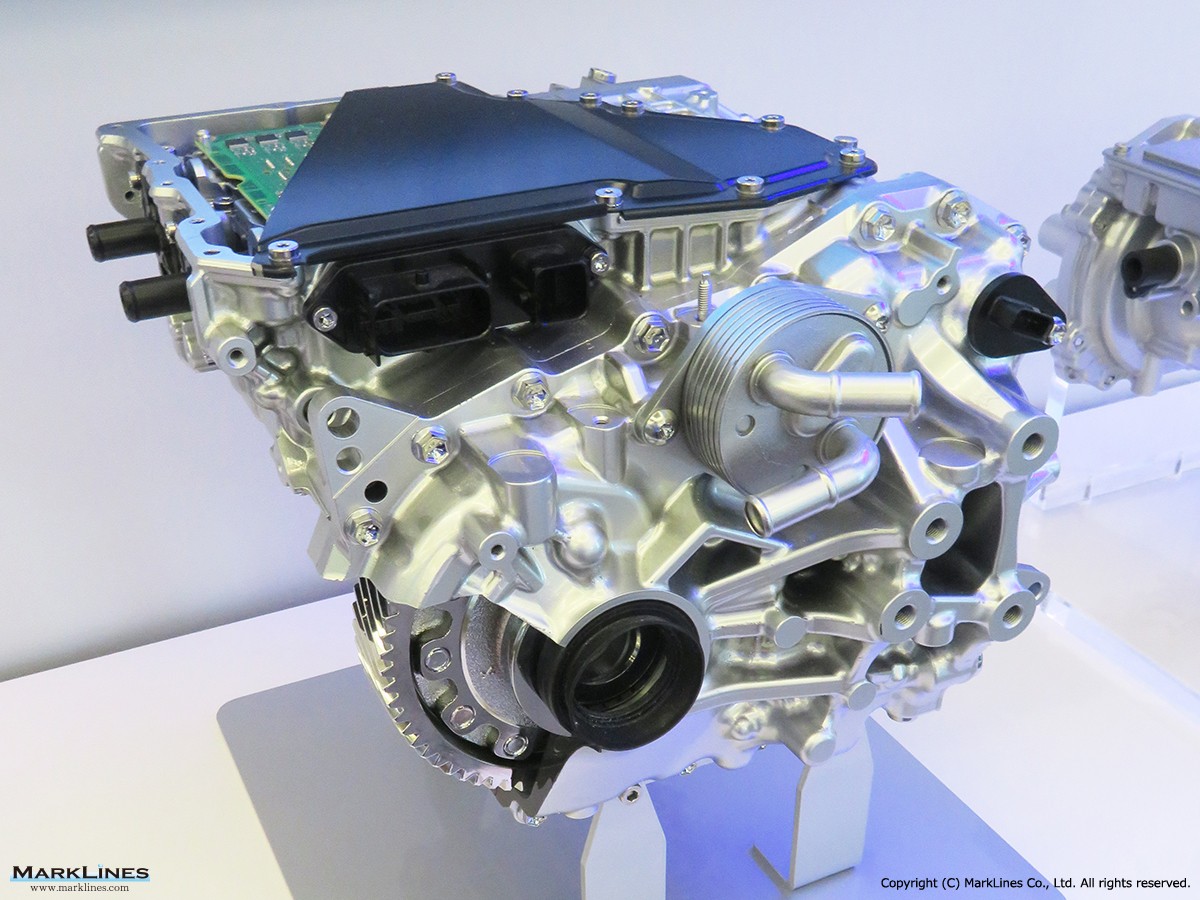
eAxle (150kW)
 4
4
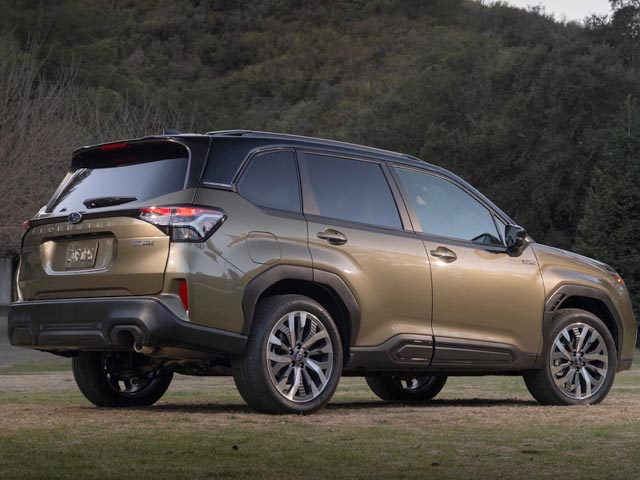
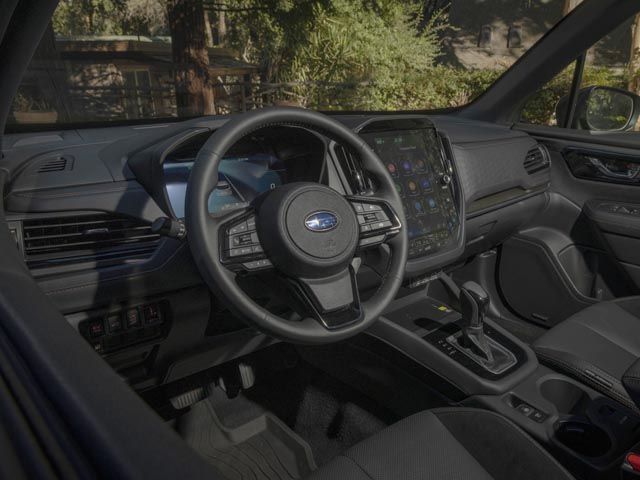
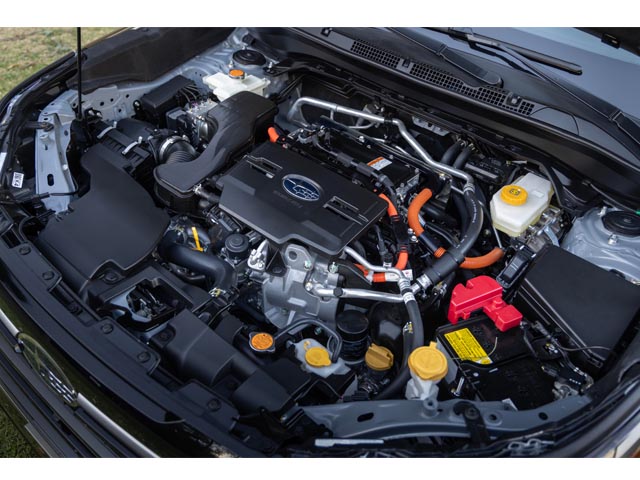
Forester Hybrid
 3
3
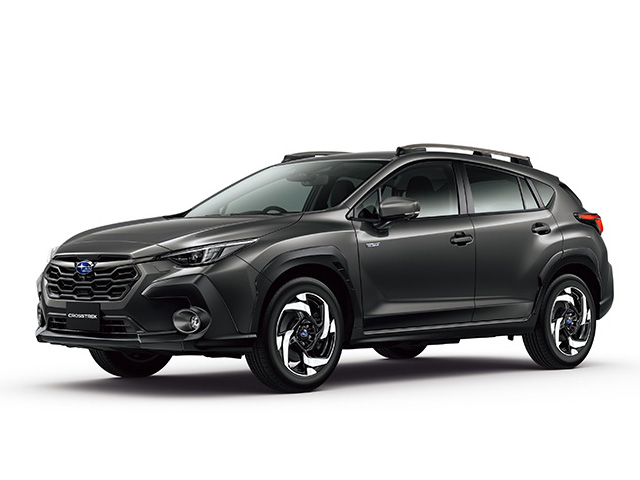
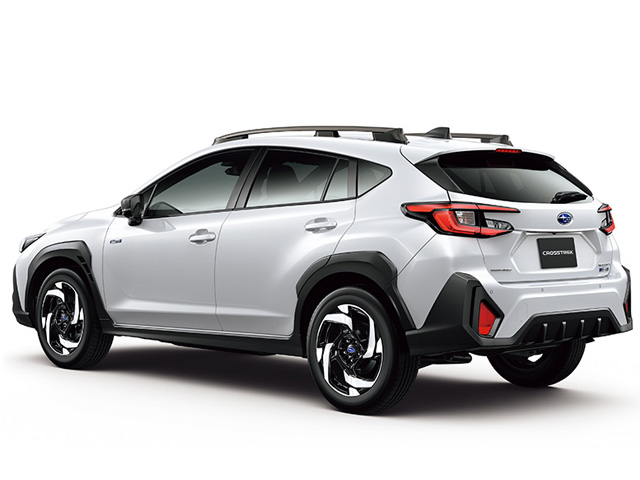
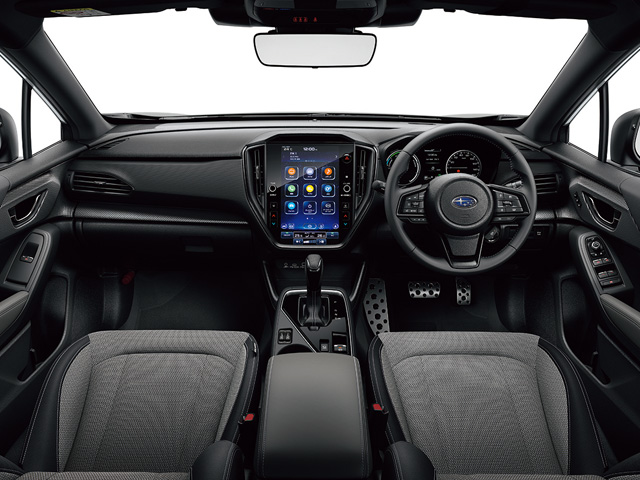
Crosstrek e-BOXER S:HEV
 1
1
eAxle (150 kW)
 1
1
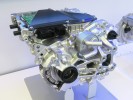
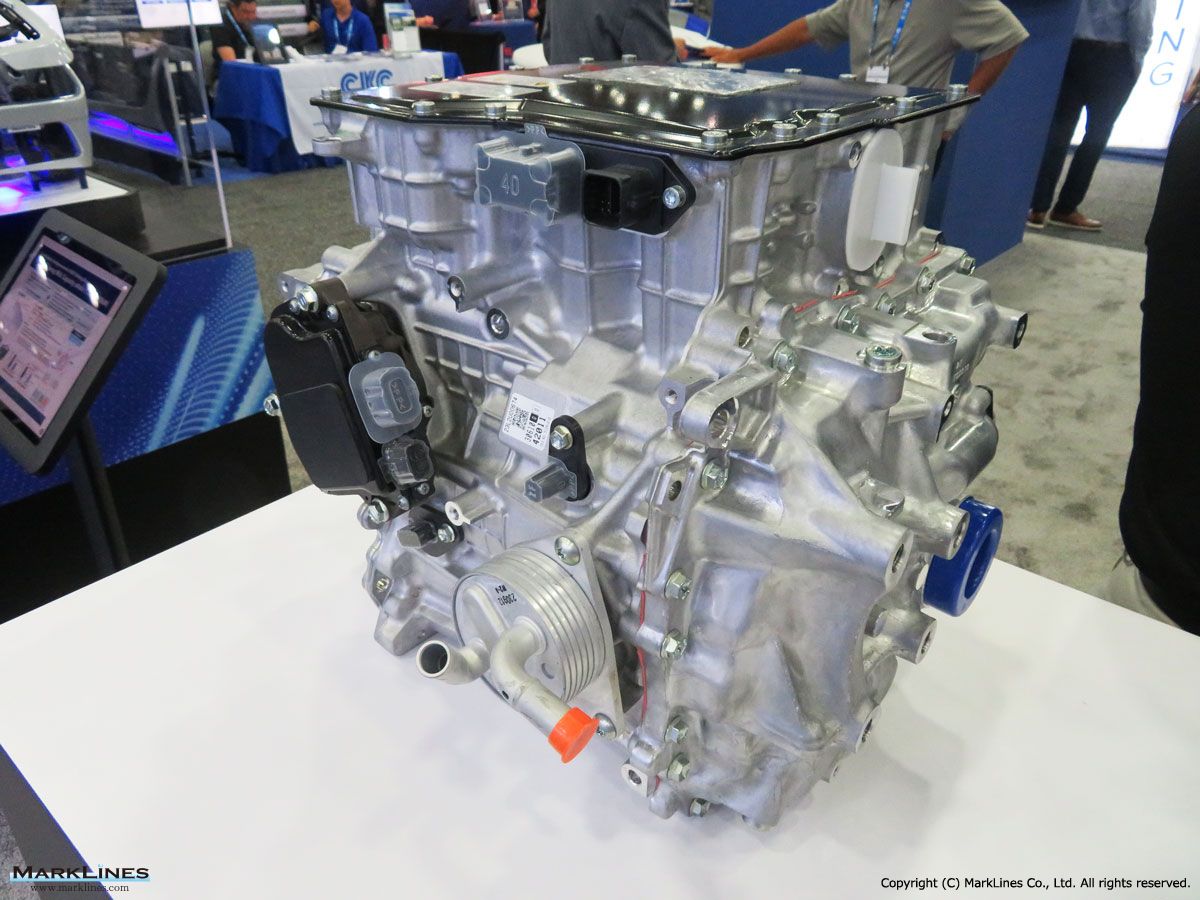
eAxle (80 kW)
 8
8
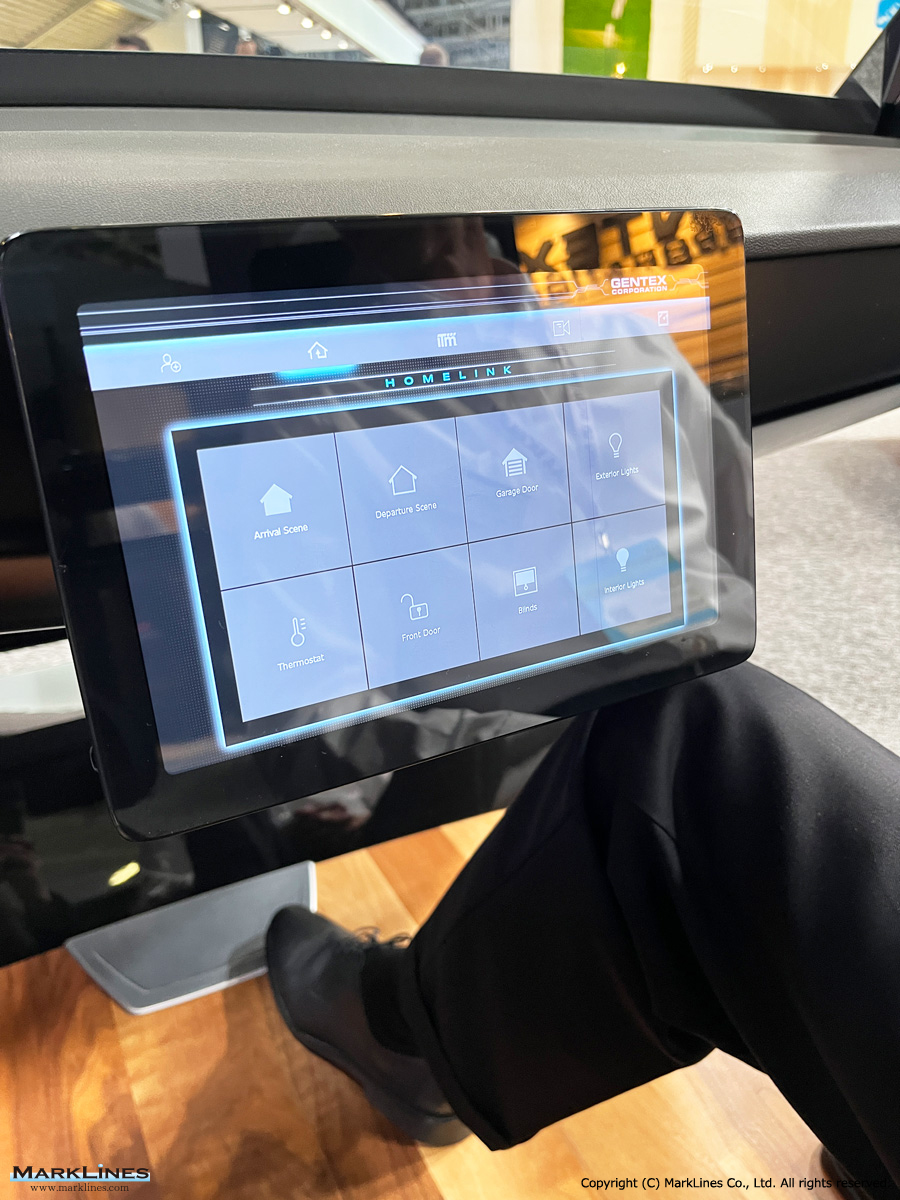
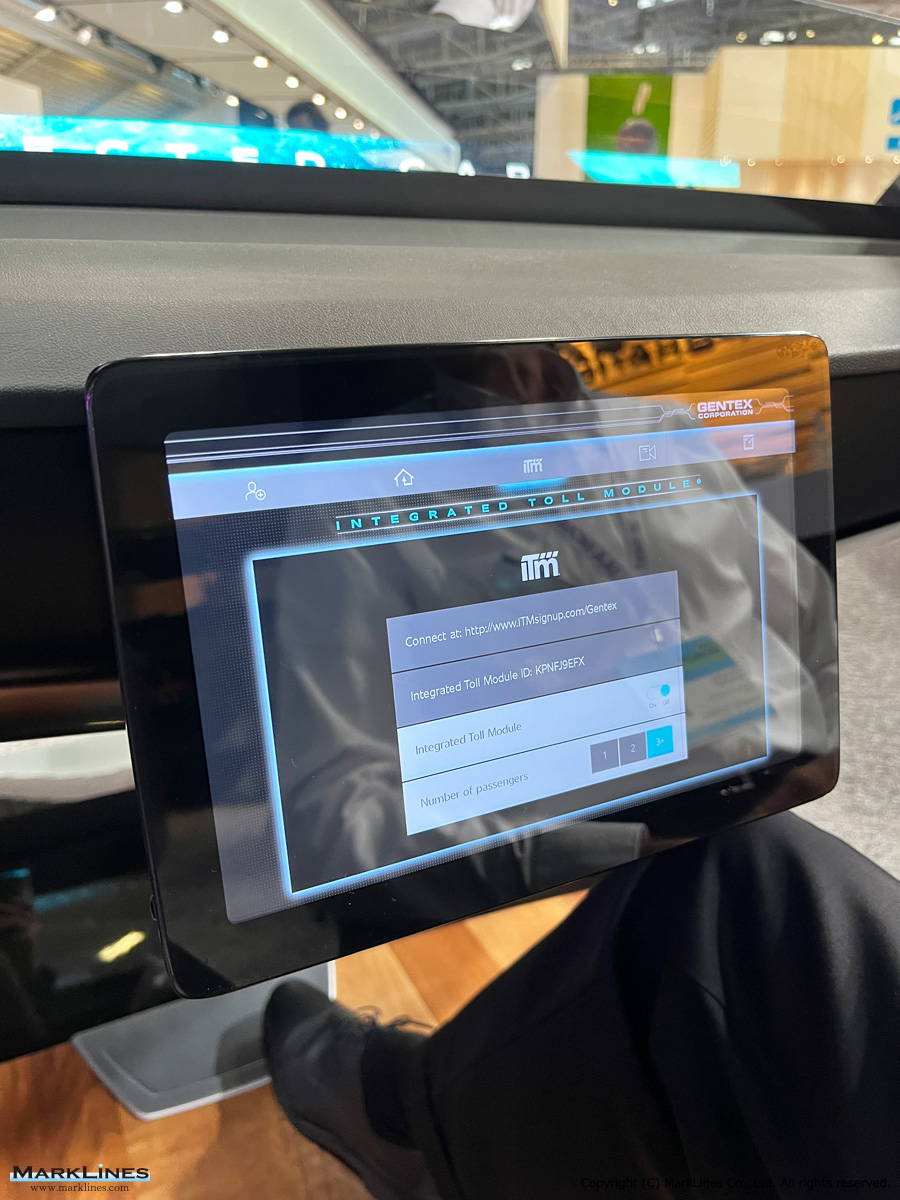
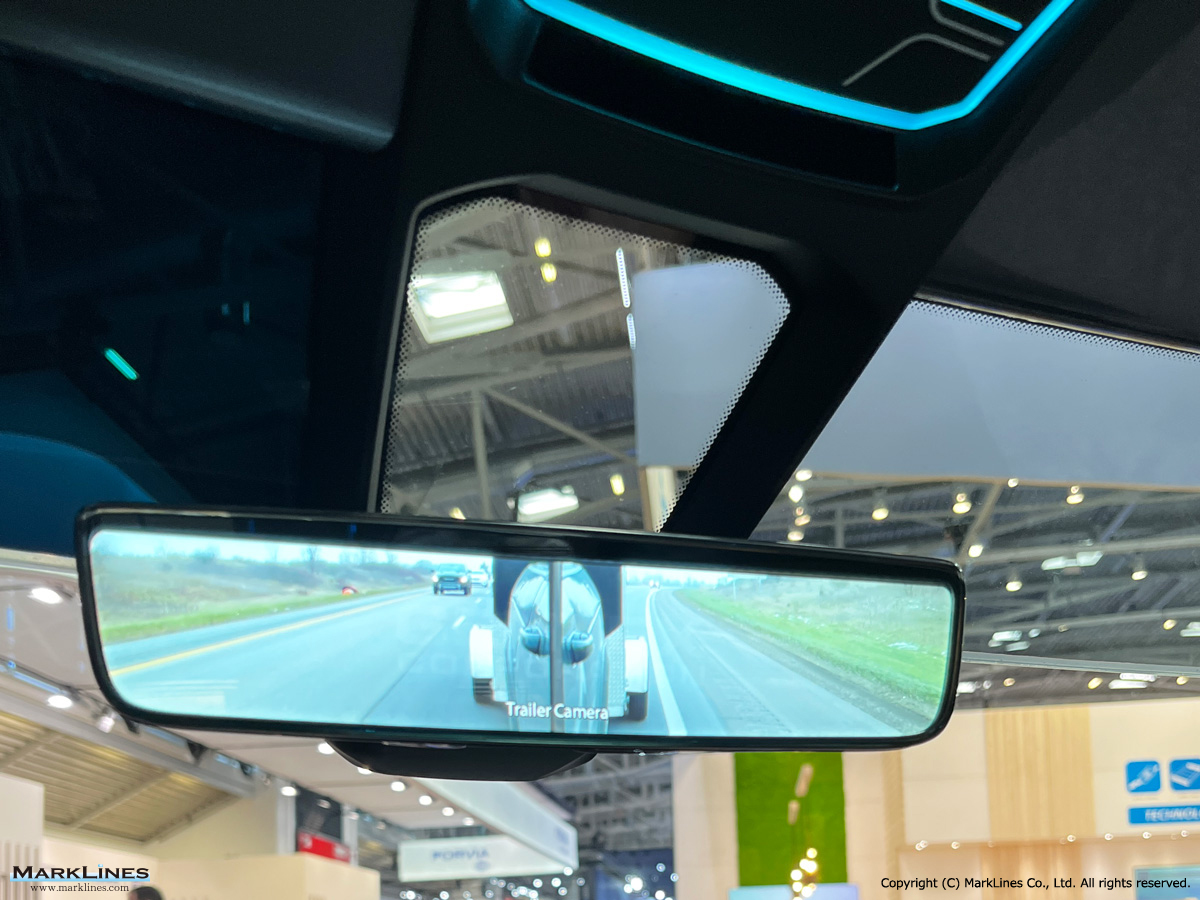
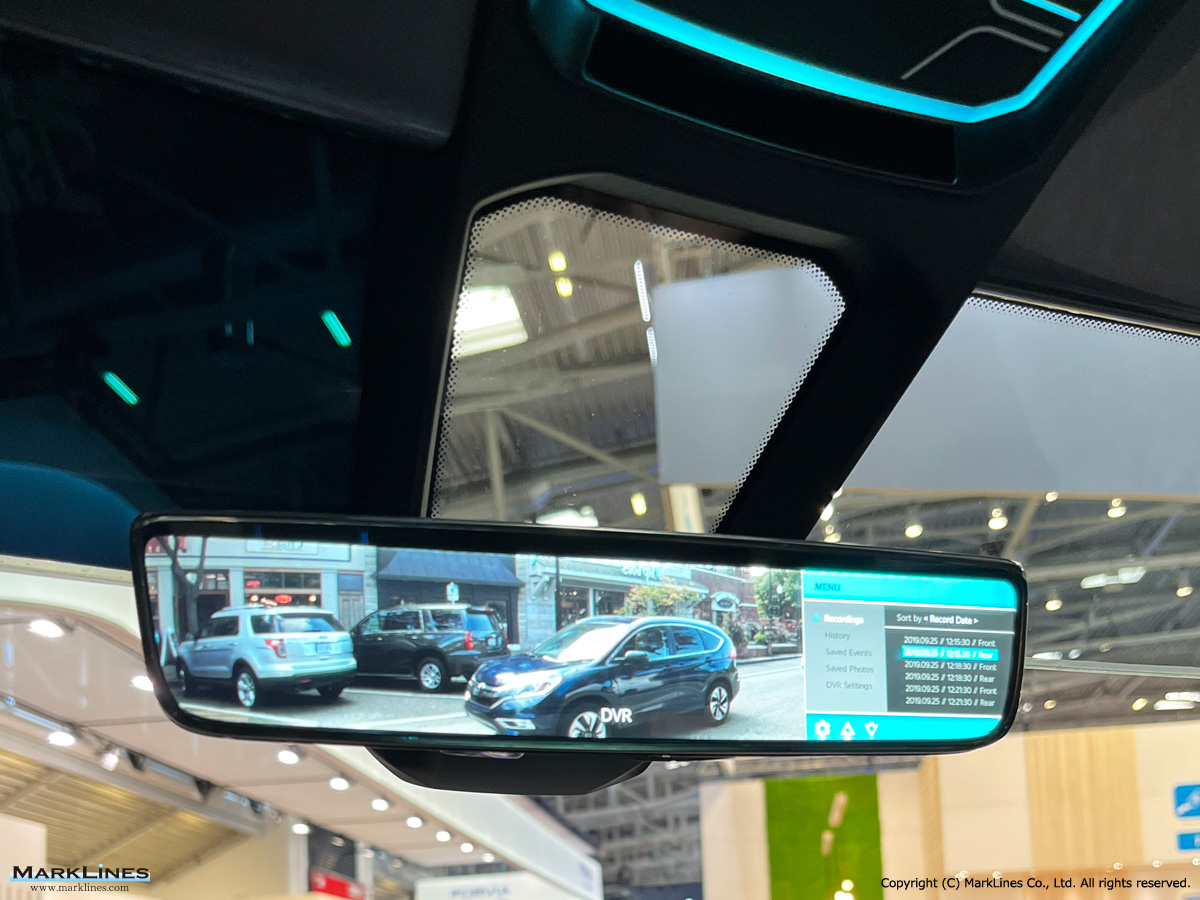
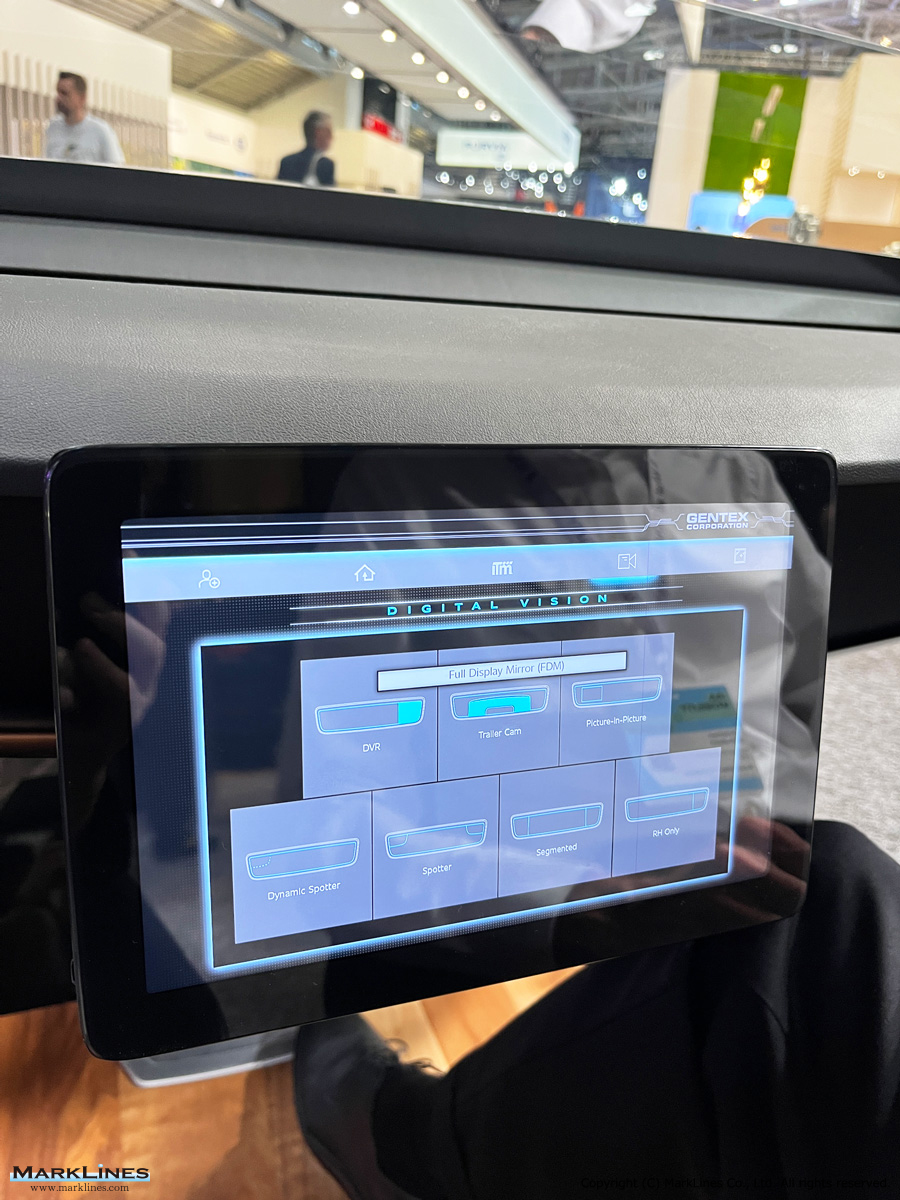
Full display mirror
 4
4
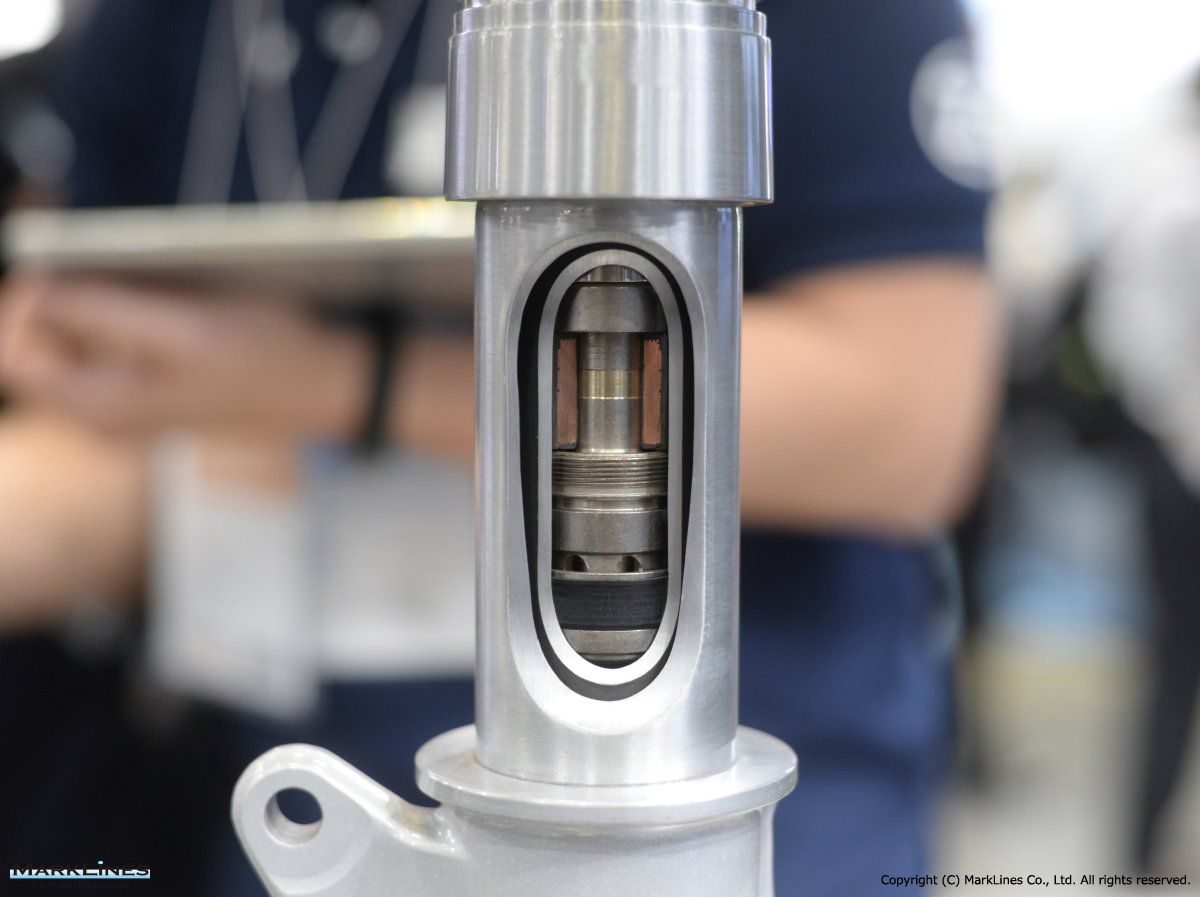
Continuous Damping Control (CDC)
Sort by :
1 - 20 of 28 results
Japan - Automotive production in 2026 by OEM, vehicle type
Vs Y-o-Y Total Share Y-o-Y Toyota - - - - 278,916 39.7% -2.6% Suzuki - - - - 80,463 11.5% -1.1% Daihatsu - - - - 70,618 10.1% 13.3% Honda - - - - 67,550 9.6% 8.7% Mazda - - - - 67,375 9.6% 12.0% Nissan 43,839 -5.7% 5,698 -0.1% 49,537 7.1% -5.1% Mitsubishi - - - - 47,672 6.8% 11.7% Subaru - - - - 39,694 5.7% -22.6% Total - - - - 701,825 100.0% 0.5% Source: Various publicity materials by automakers Export volume of Japanese ...
Automotive Production Data Updated at: 2026/03/30
Data changes for Production Statistics
ti QX50 (EX)" under the Nissan category. Honda Since 2009:"Accord/Acura TSX" has been divided into "Accord" and "Acura TSX." Toyota "Corolla/Scion xB" has been changed to "Corolla Rumion/Scion xB." "Mark II/Mark X" has been changed to "Mark X." 2012:"Mark II" has been changed to "Mark X." Subaru 2011-2013(Annual data):"Impreza" has been changed to "Impreza/XV." May 13, 2015 India Production data of Passenger cars & UVs/MPVs by mod...
Automotive Production Data Updated at: 2026/03/17
2025 global production volume by Japanese OEMs
% 689,802 -0.5% - - 2,706,255 -10.8% Nissan 2,950,035 -5.7% 565,444 -13.9% 503,245 62,199 2,384,591 -3.5% Daihatsu 1,530,549 16.3% 779,101 50.2% - - 751,448 -5.7% Mazda 1,156,707 -3.7% 716,690 -4.4% 716,690 0 440,017 -2.6% Mitsubishi 883,828 -6.4% 471,467 -2.1% - - 412,361 -11.0% Subaru 878,016 -6.4% 540,194 -5.5% - - 337,822 -7.7% Total 24,169,499 0.3% 7,994,530 2.1% - - 16,174,969 -0.6% Source: Compiled from domestic a...
Automotive Production Data Updated at: 2026/03/03
Japan - Automotive production in 2025 by OEM, vehicle type
,620 12.0% -3.4% Daihatsu - - - - 69,401 10.6% 34.0% Mazda 66,024 5.9% 0 -% 66,024 10.1% 5.9% Honda - - - - 61,417 9.4% 9.1% Nissan 40,997 -8.1% 5,334 -11.6% 46,331 7.1% -8.5% Mitsubishi - - - - 45,336 6.9% 16.1% Subaru - - - - 40,210 6.1% -16.9% Total - - - - 656,562 100.0% 1.7% Vehicle production volume of Japanese passenger ...
Automotive Production Data Updated at: 2026/02/26
2026 – Japanese OEM Production and Sales Plans
r. 2026 Nov. 2025 Not announced - - Unchanged - - Fiscal year ending Mar. 2026 Jul. 2025 Not announced - - 878 4% Japan: 130 (10%) North America: 153 (-18%) Europe: 60 (18%) ASEAN: 287 (15%) China: 13 (8%) Australia/New Zealand: 82 (-5%) Others: 153 (10%) Fiscal year ending Mar. 2026 May 2025 Subaru Unchanged - - Unchanged - Japan: 104 (-0.2%) Overseas: 816 (-1.9%) (Includes North America: 727 (-0.6%) Othres: 89 (-11.6%) Fiscal year ending ...
Automotive Production Data Updated at: 2026/02/20
Japan - Automotive production in 2024 by OEM, vehicle type
2024) Make PCs Y-o-Y CVs Y-o-Y Total Share Y-o-Y Toyota - - - - 255,402 39.6% -5.7% Suzuki - - - - 81,429 12.6% -8.7% Mazda 62,348 -6.5% 0 -% 62,348 9.7% -6.5% Honda - - - - 56,313 8.7% -18.7% Daihatsu - - - - 51,774 8.0% -0.9% Nissan 44,621 -20.7% 6,033 22.4% 50,654 7.8% -17.2% Subaru - - - - 48,405 7.5% -10.7% Mitsubishi - - - - 39,038 6.0% -6.2% Total - - - - 645,363 100.0% -8.5% Vehicle production volume of Japane...
Automotive Production Data Updated at: 2025/07/04
Japan - Flash report, Automotive production volume, 2023
panese passenger car manufacturers (December 2023) Make PCs Y-o-Y CVs Y-o-Y Total Share Y-o-Y Toyota - - - - 270,802 38.4% 22.2% Suzuki - - - - 89,212 12.6% 7.4% Honda - - - - 69,261 9.8% 24.2% Mazda 66,713 7.0% 0 -% 66,713 9.5% 7.0% Nissan 56,268 5.9% 4,930 -14.6% 61,198 8.7% 3.9% Subaru - - - - 54,219 7.7% -5.3% Daihatsu - - - - 52,219 7.4% -33.1% Mitsubishi - - - - 41,624 5.9% -5.6% Total - - - - 705,248 100.0% 6.7% ...
Automotive Production Data Updated at: 2025/06/04
Japan - Flash report, Automotive production volume, 2022
enger car manufacturers (December 2022) Make PCs Y-o-Y CVs Y-o-Y Total Share Y-o-Y Toyota - - - - 221,567 33.5% -15.0% Suzuki - - - - 83,069 12.6% 3.6% Daihatsu - - - - 78,028 11.8% -8.2% Mazda 62,347 -20.2% 0 -% 62,347 9.4% -20.2% Nissan 53,116 108.9% 5,771 36.1% 58,887 8.9% 98.5% Subaru - - - - 57,270 8.7% 30.8% Honda - - - - 55,753 8.4% -16.0% Mitsubishi - - - - 44,091 6.7% 72.0% Total - - - - 661,012 100.0% -1.3% V...
Automotive Production Data Updated at: 2025/06/04
Japan - Flash report, Automotive production volume, 2021
olume of Japanese passenger car manufacturers (December 2021) Make PCs Y-o-Y CVs Y-o-Y Total Share Y-o-Y Toyota - - - - 260,760 38.9% 3.2% Daihatsu - - - - 84,985 12.7% 1.0% Suzuki - - - - 80,178 12.0% -13.0% Mazda 78,104 -0.5% 0 -% 78,104 11.7% -0.5% Honda - - - - 66,411 9.9% 8.0% Subaru - - - - 43,794 6.5% -25.7% Nissan 25,423 -50.2% 4,239 -34.3% 29,662 4.4% -48.4% Mitsubishi - - - - 25,627 3.8% -22.0% Total - - - - 669,5...
Automotive Production Data Updated at: 2025/06/04
Japan - Flash report, Production volume, 2020
e of Japanese passenger car manufacturers (December 2020) Make PCs Y-o-Y CVs Y-o-Y Total Share Y-o-Y Toyota - - - - 252,698 35.2% 6.3% Suzuki - - - - 92,110 12.8% 14.6% Daihatsu - - - - 84,110 11.7% 7.4% Mazda 78,490 10.1% 0 -100.0% 78,490 10.9% 8.8% Honda - - - - 61,486 8.6% 21.2% Subaru - - - - 58,964 8.2% 2.1% Nissan 51,020 -3.7% 6,448 -21.7% 57,468 8.0% -6.1% Mitsubishi - - - - 32,847 4.6% -36.9% Total - - - - 718,173 1...
Automotive Production Data Updated at: 2025/06/04
2023 global production volume by Japanese OEMs
,224,996 1.7% 995,948 8.3% - - 2,229,048 -1.0% Daihatsu 1,669,230 -1.7% 820,965 -5.5% - - 848,265 2.4% Mazda 1,253,654 14.8% 839,170 14.2% 839,170 0 414,484 16.1% Mitsubishi 1,024,010 1.1% 500,638 13.6% - - 523,372 -8.4% Subaru 959,147 13.0% 608,327 8.1% - - 350,820 22.6% Total 25,796,411 7.6% 8,572,848 16.1% - - 17,223,563 3.9% S...
Automotive Production Data Updated at: 2025/04/14
2022 global production volume by Japanese OEMs
,172,192 10.7% 919,891 5.1% 2,252,301 13.1% Daihatsu 1,697,849 11.8% 869,161 -1.1% 828,688 29.6% Mazda 1,091,896 1.6% 734,833 -0.1% 734,833 0 357,063 5.2% Mitsubishi 1,012,408 -3.5% 440,762 0.3% 571,646 -6.2% Subaru 848,867 14.0% 562,601 18.4% 286,266 6.2% Total 23,970,886 1.8% 7,386,544 -0.1% - - 16,584,342 2.6% ...
Automotive Production Data Updated at: 2025/04/14
2024 global production volume by Japanese OEMs
% 1,029,910 3.4% - - 2,269,692 1.8% Nissan 3,144,470 -8.7% 656,990 -8.6% 594,593 62,397 2,487,480 -8.7% Daihatsu 1,315,564 -21.2% 518,881 -36.8% - - 796,683 -6.0% Mazda 1,201,049 -4.2% 749,428 -10.7% 749,428 0 451,621 9.0% Mitsubishi 944,708 -7.7% 481,616 -3.8% - - 463,092 -11.5% Subaru 937,893 -2.2% 571,930 -6.0% - - 365,963 4.3% Total 24,098,764 -6.6% 7,830,365 -8.7% - - 16,268,399 -5.5% Source: Compiled from domestic ...
Automotive Production Data Updated at: 2025/03/28
2021 global production volume by Japanese OEMs (Preliminary)
,652 11.1% 874,927 -5.8% - - 1,990,725 20.6% Daihatsu 1,515,130 8.6% 875,763 -3.8% - - 639,367 32.1% Mazda 1,074,987 -8.5% 735,649 -1.5% 735,649 0 339,338 -20.7% Mitsubishi 1,049,174 22.8% 439,588 10.7% - - 609,586 33.4% Subaru 744,787 -15.8% 475,141 -16.7% - - 269,646 -14.3% Total 23,554,886 3.2% 7,391,194 -4.2% - - 16,163,692 7.0% ...
Automotive Production Data Updated at: 2024/03/29
2020 global production volume by Japanese OEMs (Preliminary)
.5% - - 3,669,083 -15.2% Nissan 3,629,672 -26.8% 509,224 -37.0% 428,017 81,207 3,120,448 -24.8% Suzuki 2,578,901 -15.5% 928,387 -1.9% - - 1,650,514 -21.7% Daihatsu 1,394,595 -18.9% 910,686 -4.5% - - 483,909 -36.8% Mazda 1,175,139 -21.0% 747,033 -26.1% 740,378 6,655 428,106 -10.4% Subaru 884,874 -10.4% 570,416 -7.8% - - 314,458 -14.7% Mitsubishi 854,091 -37.6% 396,996 -35.9% - - 457,095 -39.0% Total 22,825,343 -17.2% 7,7...
Automotive Production Data Updated at: 2021/02/05
2019 global production volume by Japanese OEMs (Preliminary)
3,055,860 -11.1% 946.768 -6.6% - - 2,109,092 -12.9% Mazda 1,487,917 -6.8% 1,010,275 1.4% 1,000,085 10,190 477,642 -20.5% Daihatsu 1,474,430 0.4% 953,541 2.4% - - 520,889 -3.1% Mitsubishi 1,368,599 -5.9% 619,464 -8.4% - - 749,135 -3.8% Subaru 987,283 -3.1% 618,764 -6.2% - - 368,519 2.5% Total 27,556,401 -4.0% 9,215,476 -0.2% - - 18,340,925 -5.8% Source: C...
Automotive Production Data Updated at: 2020/07/09
Japan - Flash report, Production volume, 2019
car manufacturers (December 2019) Make PCs Y-o-Y CVs Y-o-Y Total Share Y-o-Y Toyota - - - - 237,631 34.4% -1.1% Suzuki - - - - 80,342 11.6% -4.9% Daihatsu - - - - 78,334 11.4% 2.8% Mazda 71,272 -17.3% 884 -2.9% 72,156 10.5% -17.1% Nissan 52,967 -19.8% 8,234 -4.9% 61,201 8.9% -18.1% Subaru - - - - 57,741 8.4% 11.6% Mitsubishi - - - - 52,024 7.5% -9.1% Honda - - - - 50,724 7.3% -38.0% Total - - - - 690,153 100.0% -8.4% V...
Automotive Production Data Updated at: 2020/01/31
2018 global production volume by Japanese OEMs (Preliminary)
1,013,916 2.7% - - 2,422,673 4.7% Mazda 1,596,767 -0.7% 996,264 2.6% 984,291 11,973 600,503 -5.6% Daihatsu 1,466,968 16.1% 929,401 1.1% 756,745 172,656 537,567 56.3% Mitsubishi 1,455,067 20.2% 676,317 16.7% - - 778,750 23.4% Subaru 1,019,364 -5.0% 659,965 -7.0% - - 359,399 -1.1% Total 28,704,207 0.8% 9,236,859 0.5% - - 19,467,348 1.0% ...
Automotive Production Data Updated at: 2019/02/01
Japan - Flash report, Production volume, 2018
% 23,500 -10.5% 240,360 31.9% -8.4% Mazda 86,168 4.5% 910 28.5% 87,078 11.6% 4.7% Suzuki - - - - 84,479 11.2% 3.4% Honda - - - - 81,821 10.9% 6.6% Daihatsu 61,805 -1.1% 14,398 -3.0% 76,203 10.1% -1.5% Nissan 66,039 2.8% 8,654 72.6% 74,693 9.9% 7.9% Mitsubishi - - - - 57,223 7.6% 23.9% Subaru - - - - 51,759 6.9% -15.9% Total - - - - 753,616 100.0% -0.6% Vehicle production volume of Japanese passenger car manufacturers (2018) ...
Automotive Production Data Updated at: 2019/01/31
Japan - Flash report, Production volume, 2017
tal Share Y-o-Y Toyota 236,146 7.7% 26,255 16.6% 262,401 34.6% 8.5% Mazda 82,469 8.4% 708 -4.1% 83,177 11.0% 8.3% Suzuki - - - - 81,693 10.8% 20.7% Daihatsu 62,496 5.4% 14,840 26.1% 77,336 10.2% 8.8% Honda - - - - 76,758 10.1% -1.5% Nissan 64,213 -26.9% 5,013 -45.4% 69,226 9.1% -28.7% Subaru - - - - 61,560 8.1% 2.7% Mitsubishi - - - - 46,191 6.1% -12.4% Total - - - - 758,342 100.0% 1.8% Vehicle production volume of Japanese...
Automotive Production Data Updated at: 2018/09/27


 Japan
Japan USA
USA Mexico
 Germany
 China (Shanghai)
 Thailand
 India
India