


Search Results by Category
All information related to {{ key_word }}.
AI Navigator will guide you. Click here for information about {{ key_word }}.
Images
 1
1
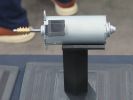
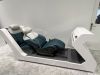
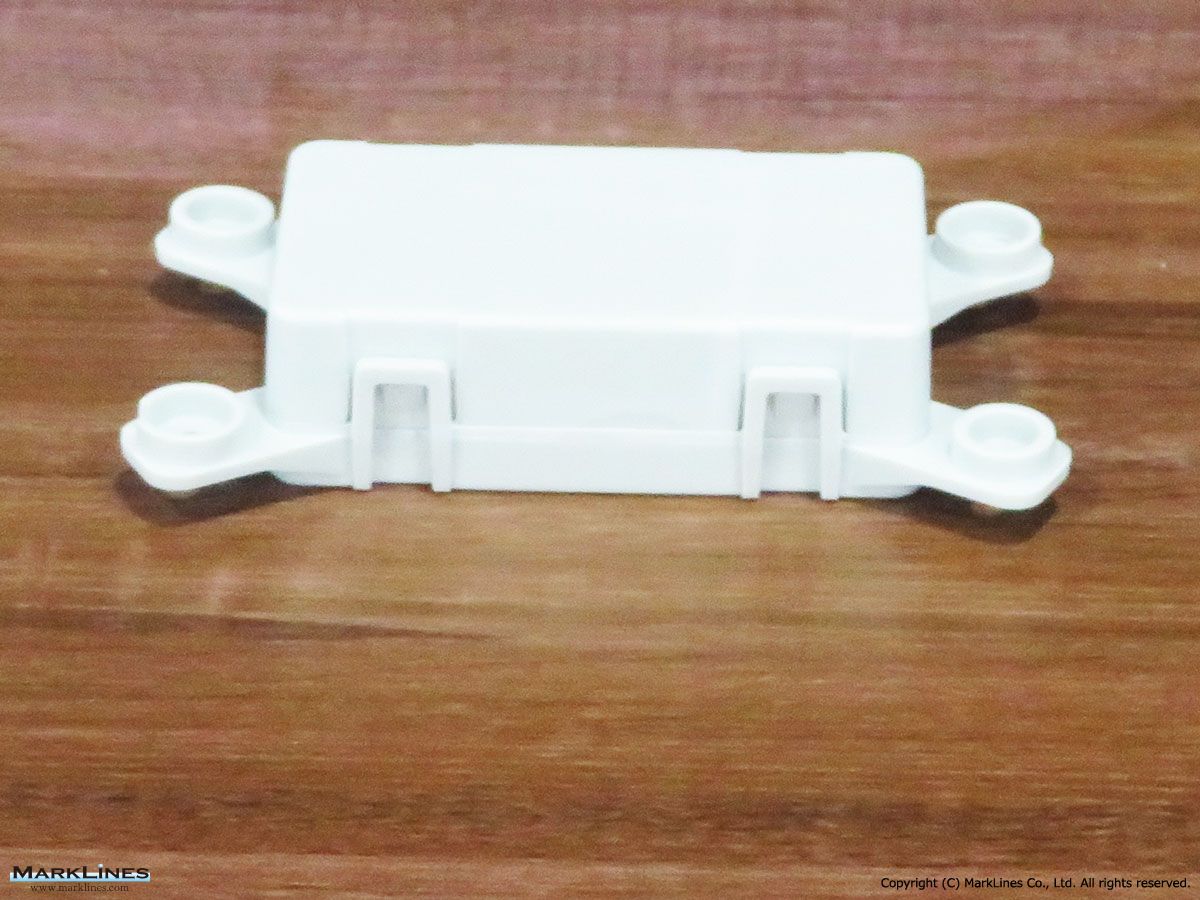
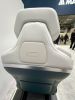
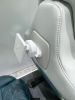
CM3 seat motor
 4
4
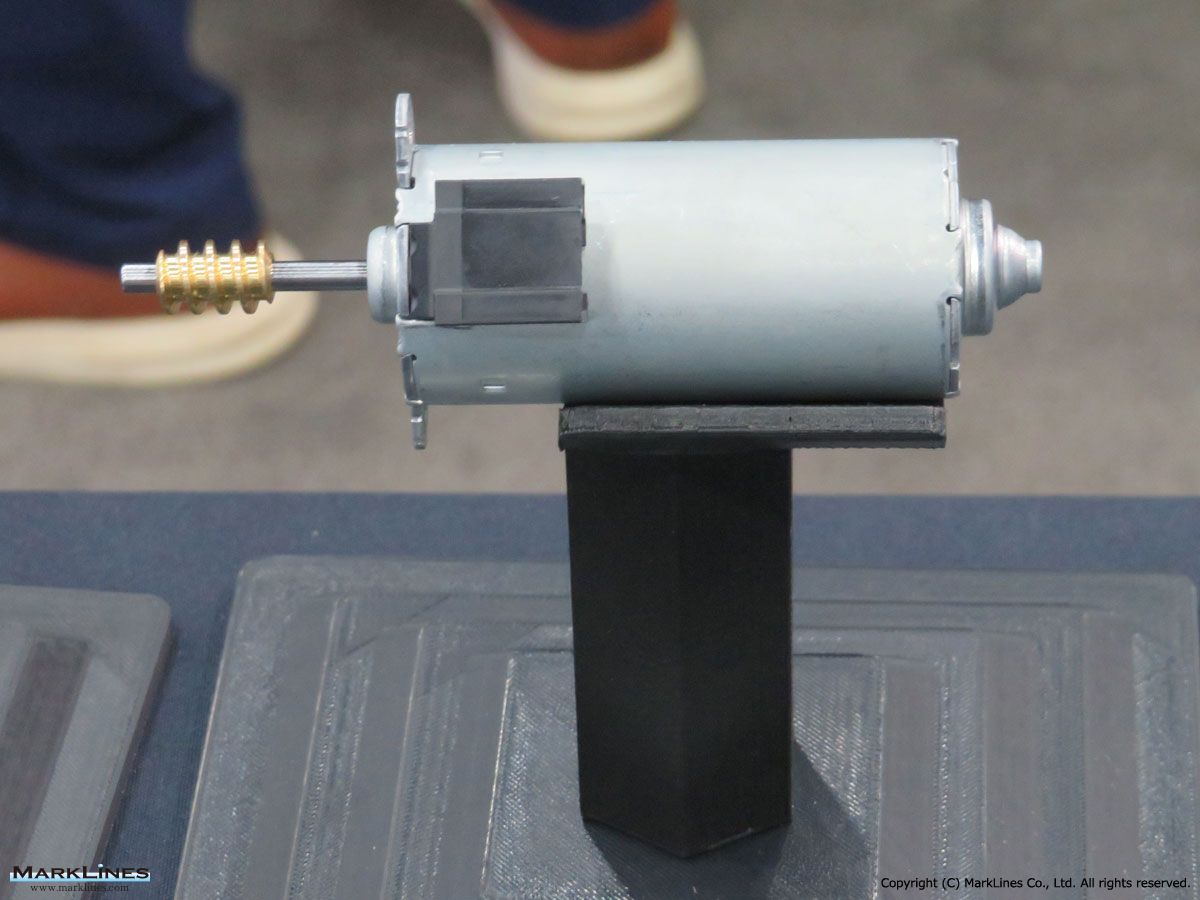
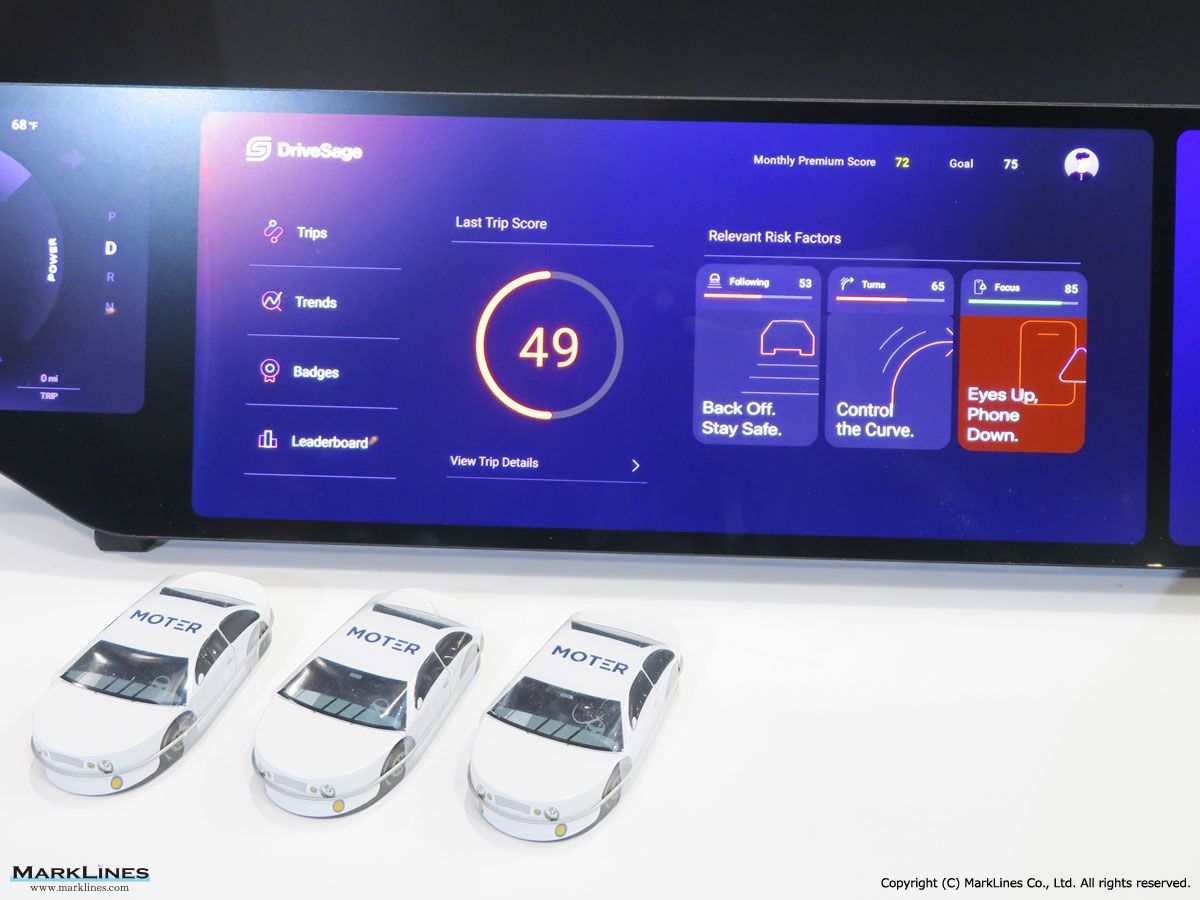
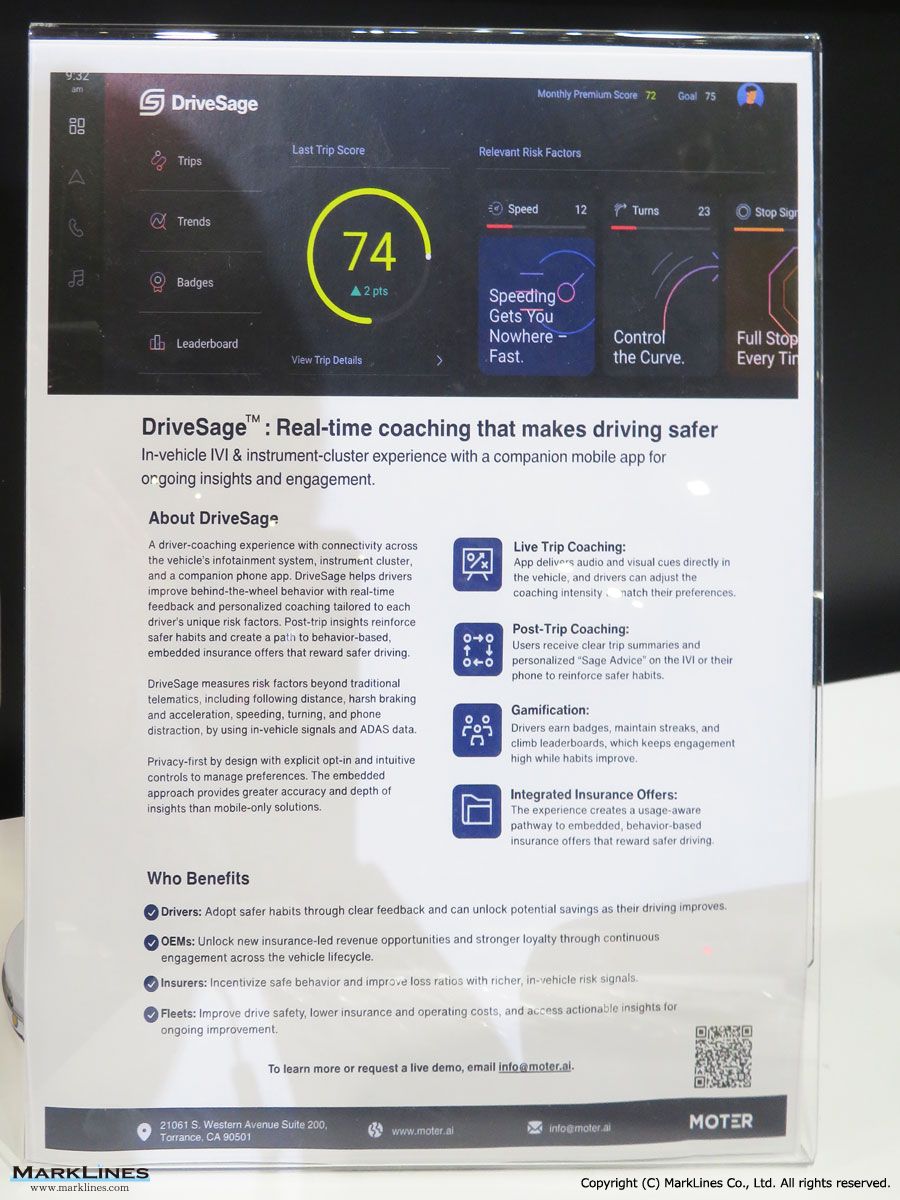
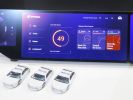
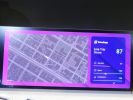
DriveSage application demonstration
 1
1
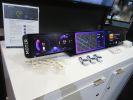
ACAM200 in-cabin monitoring radar
 3
3
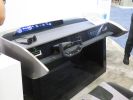
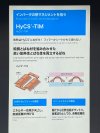
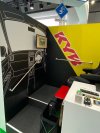
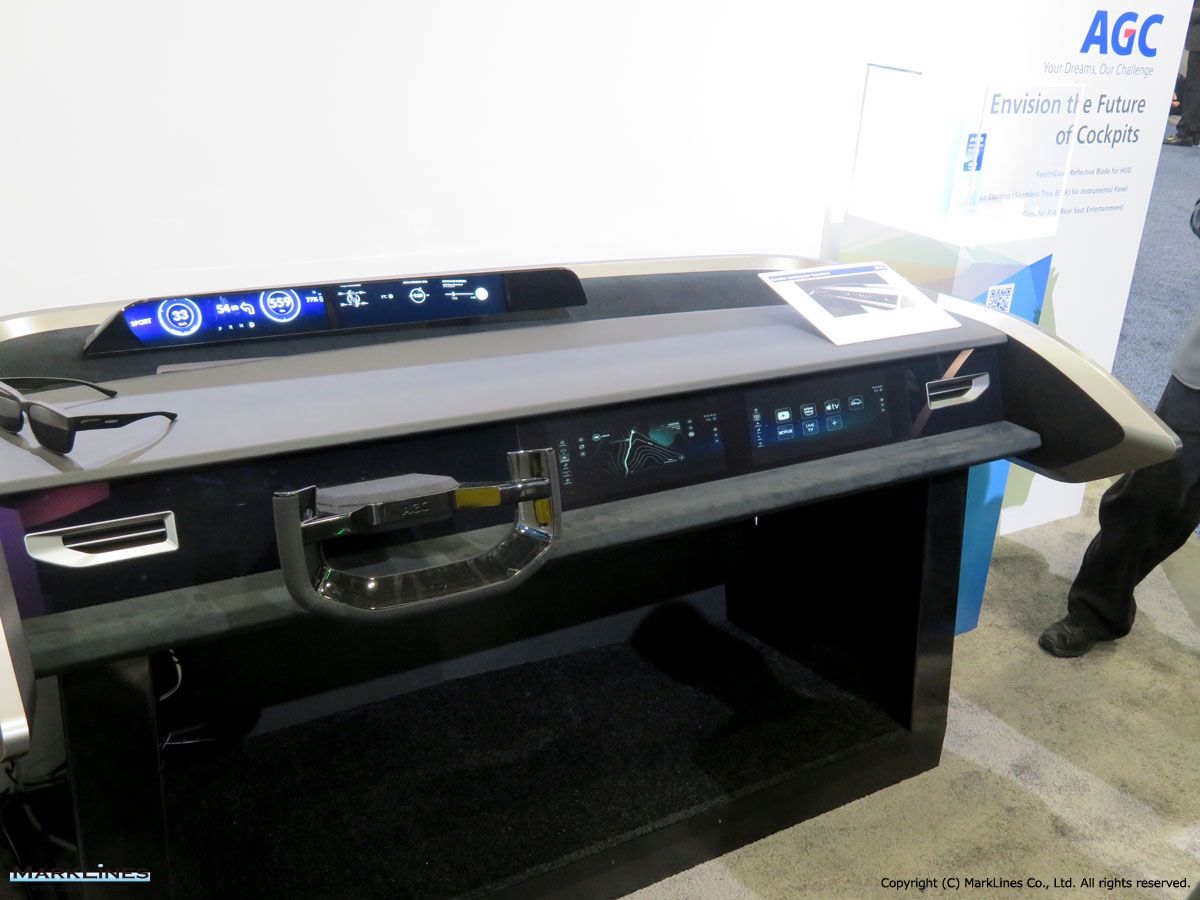
Cockpit concept featuring Company technologies
 2
2
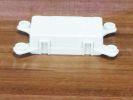
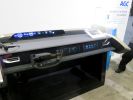
Car seat heater
 4
4
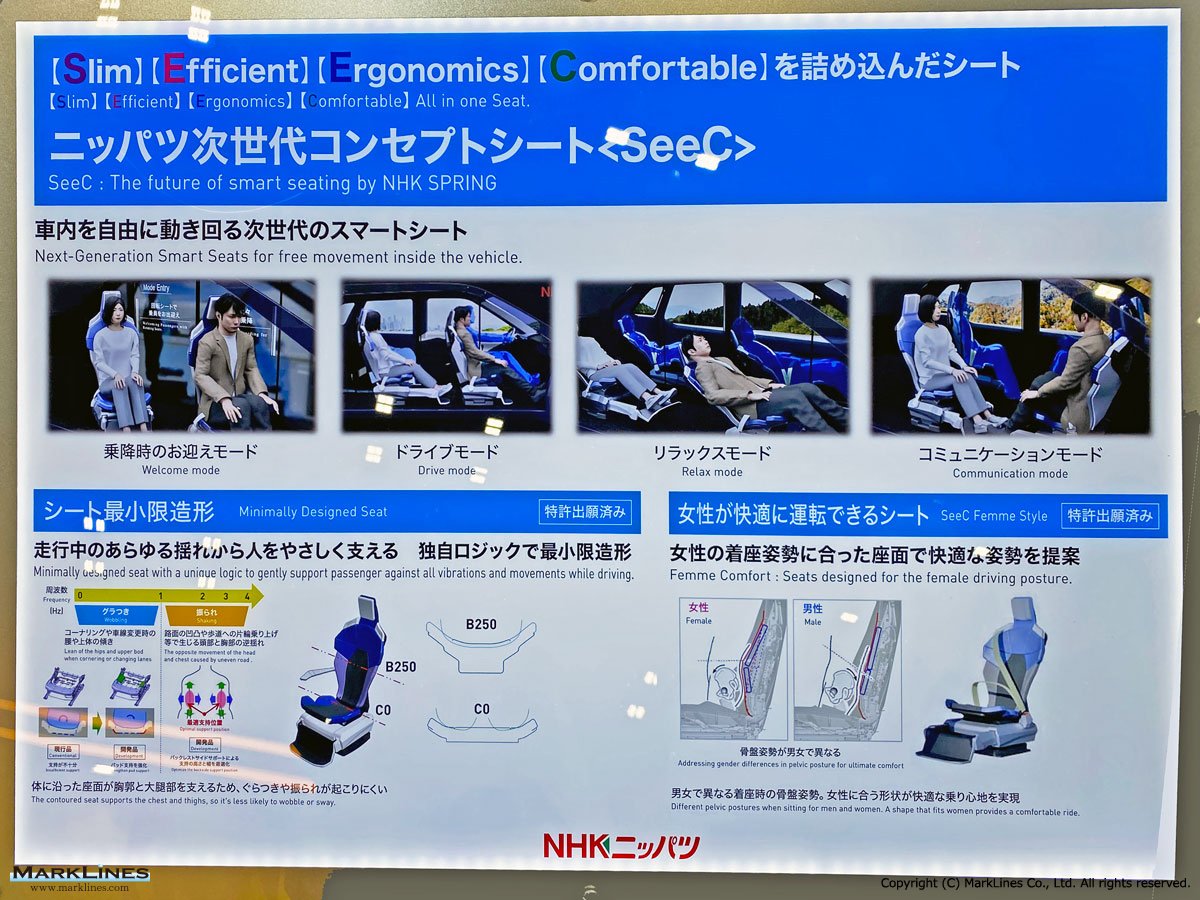
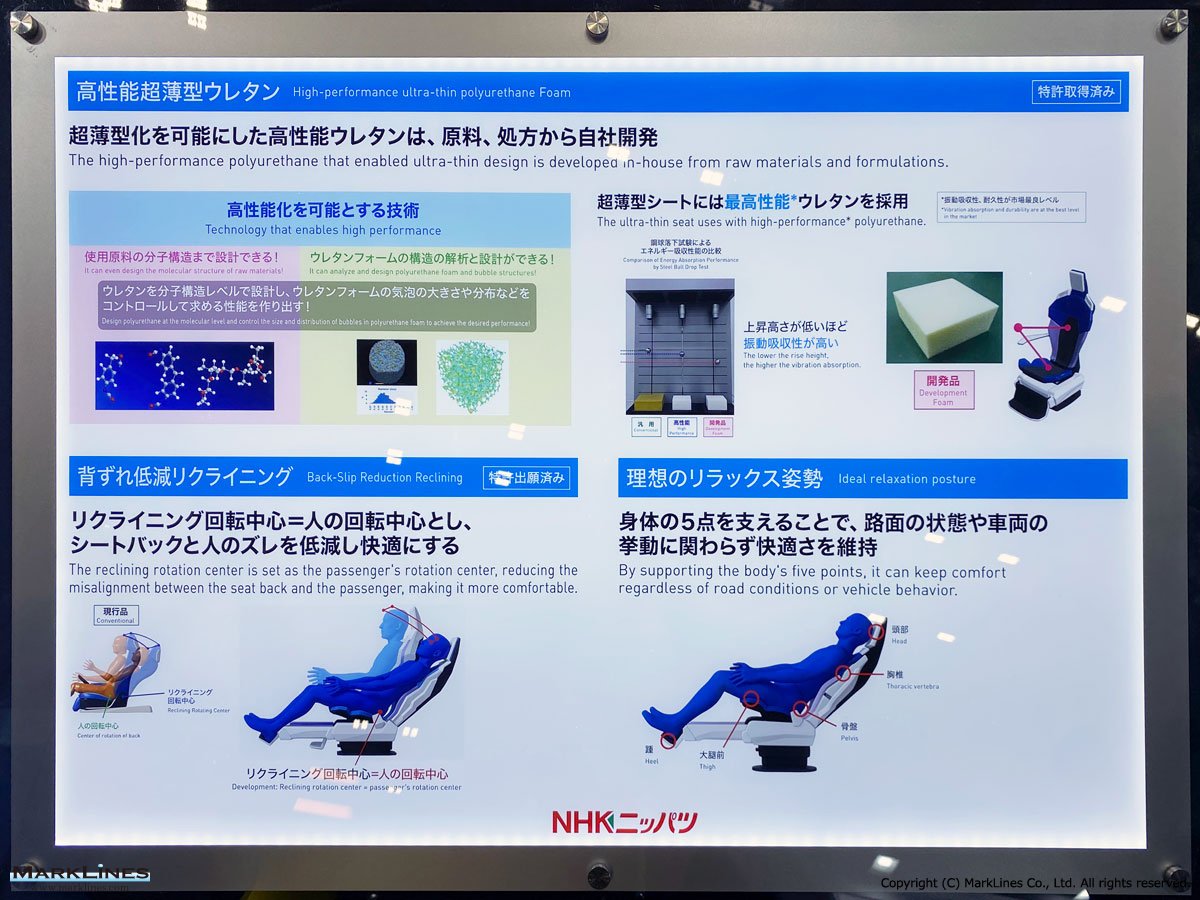
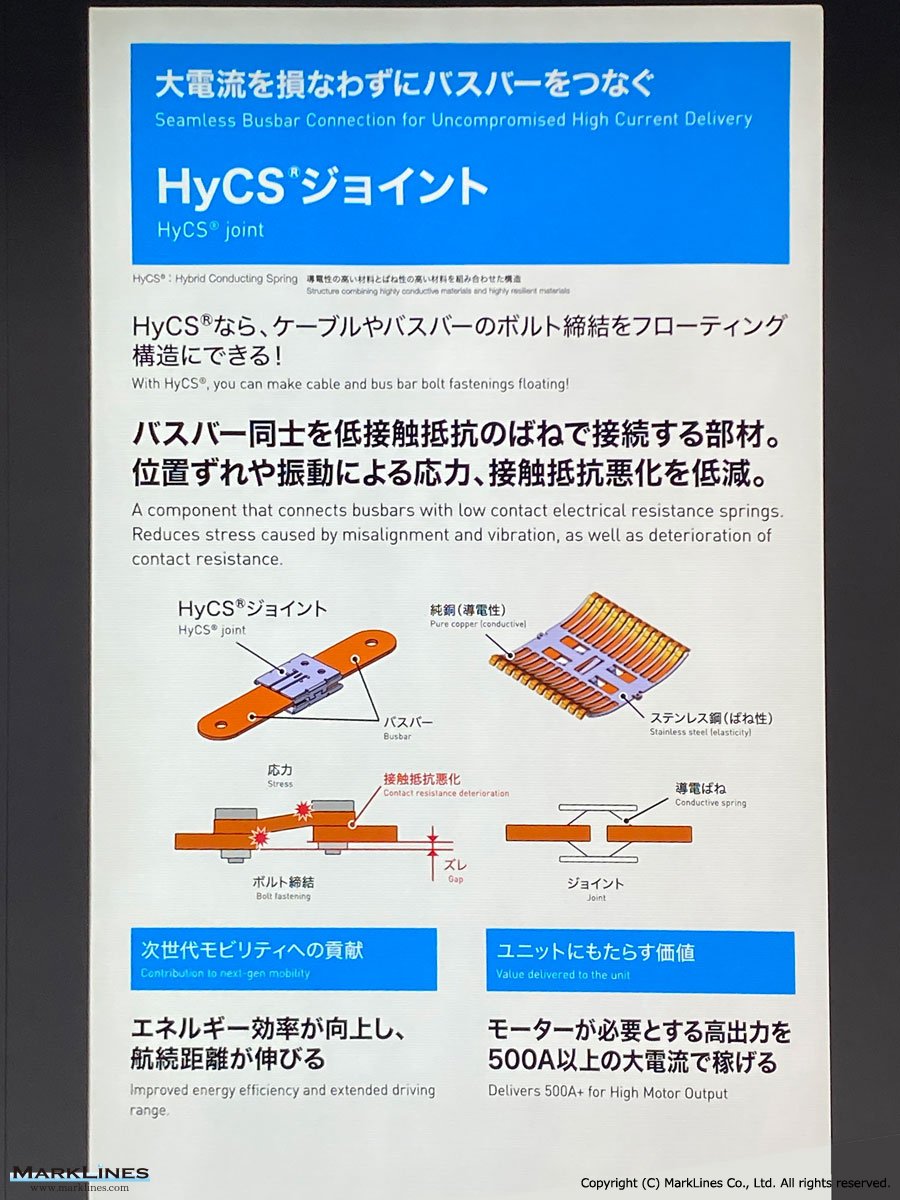
Various panels
 5
5
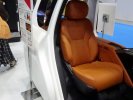
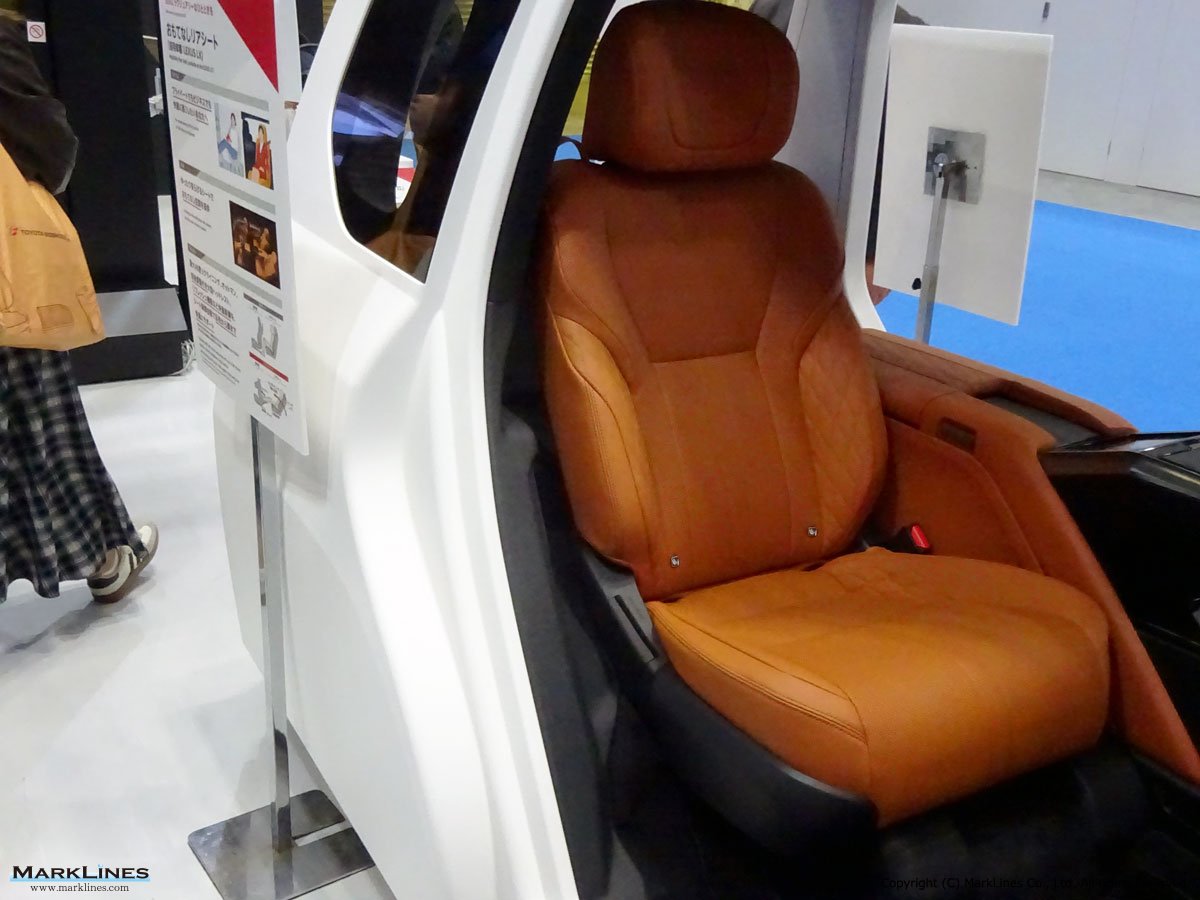
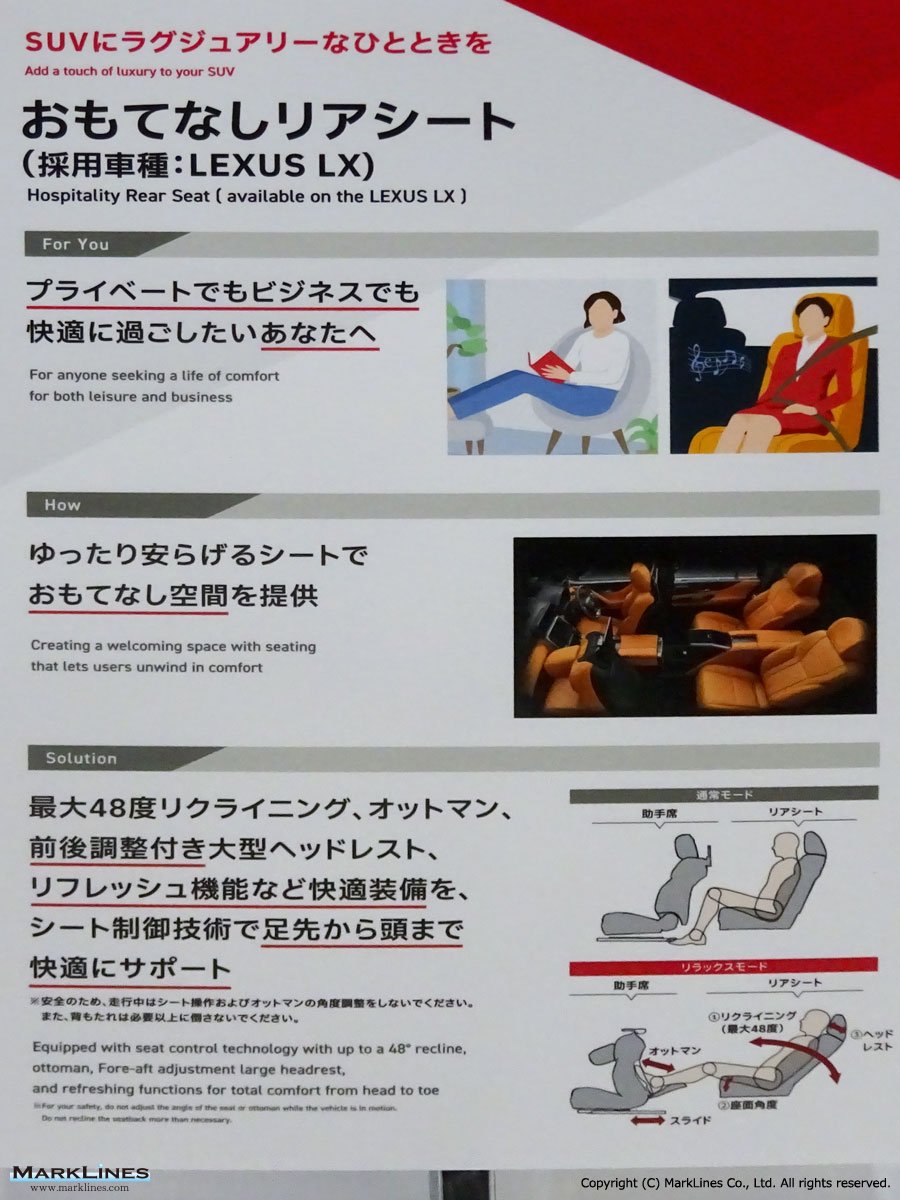
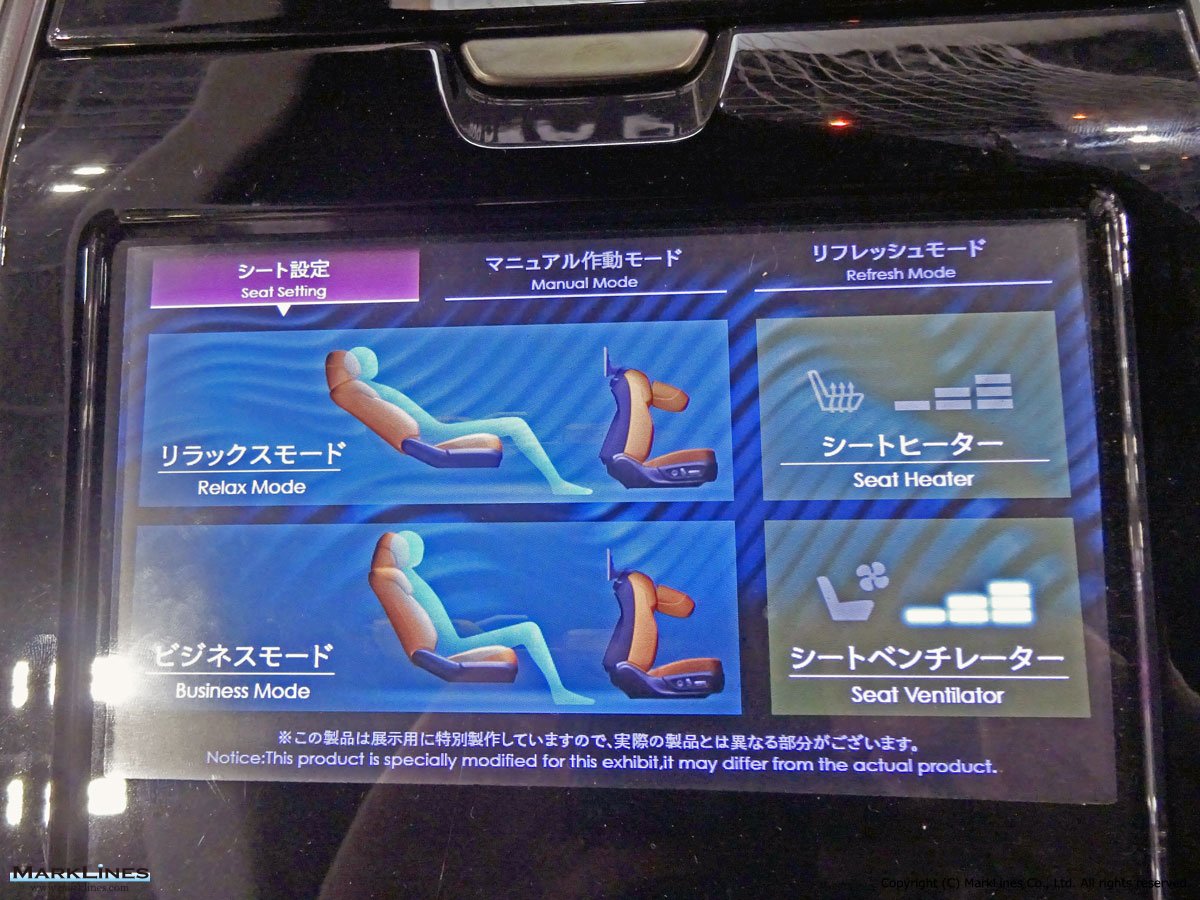
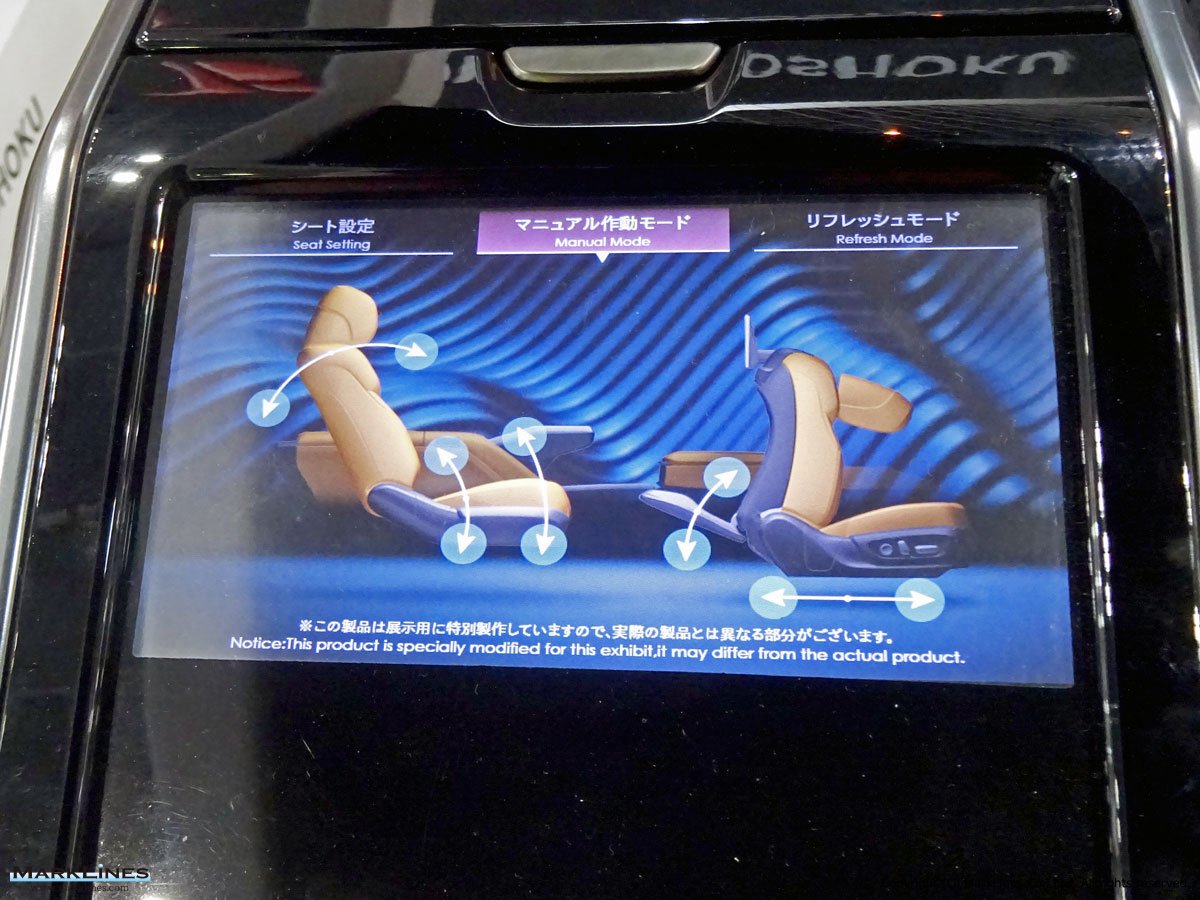
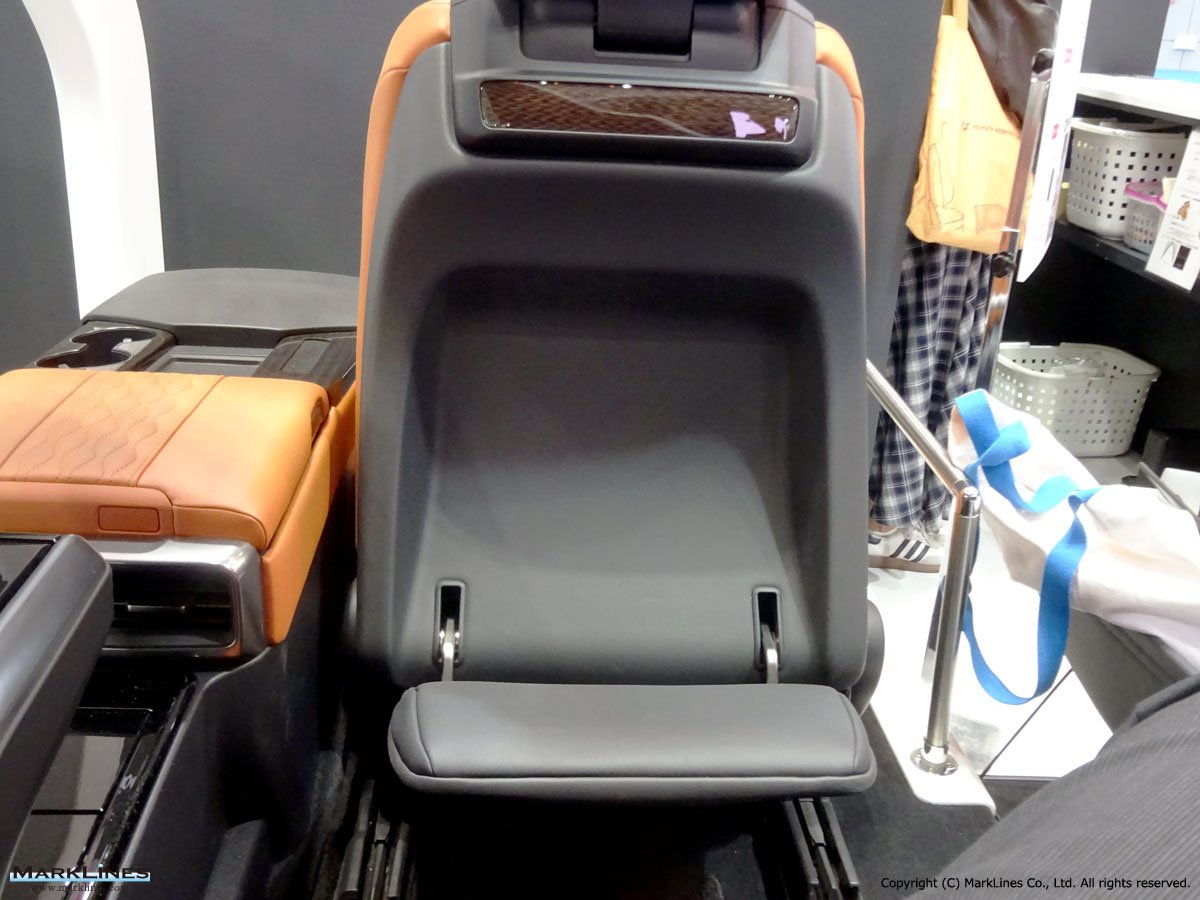
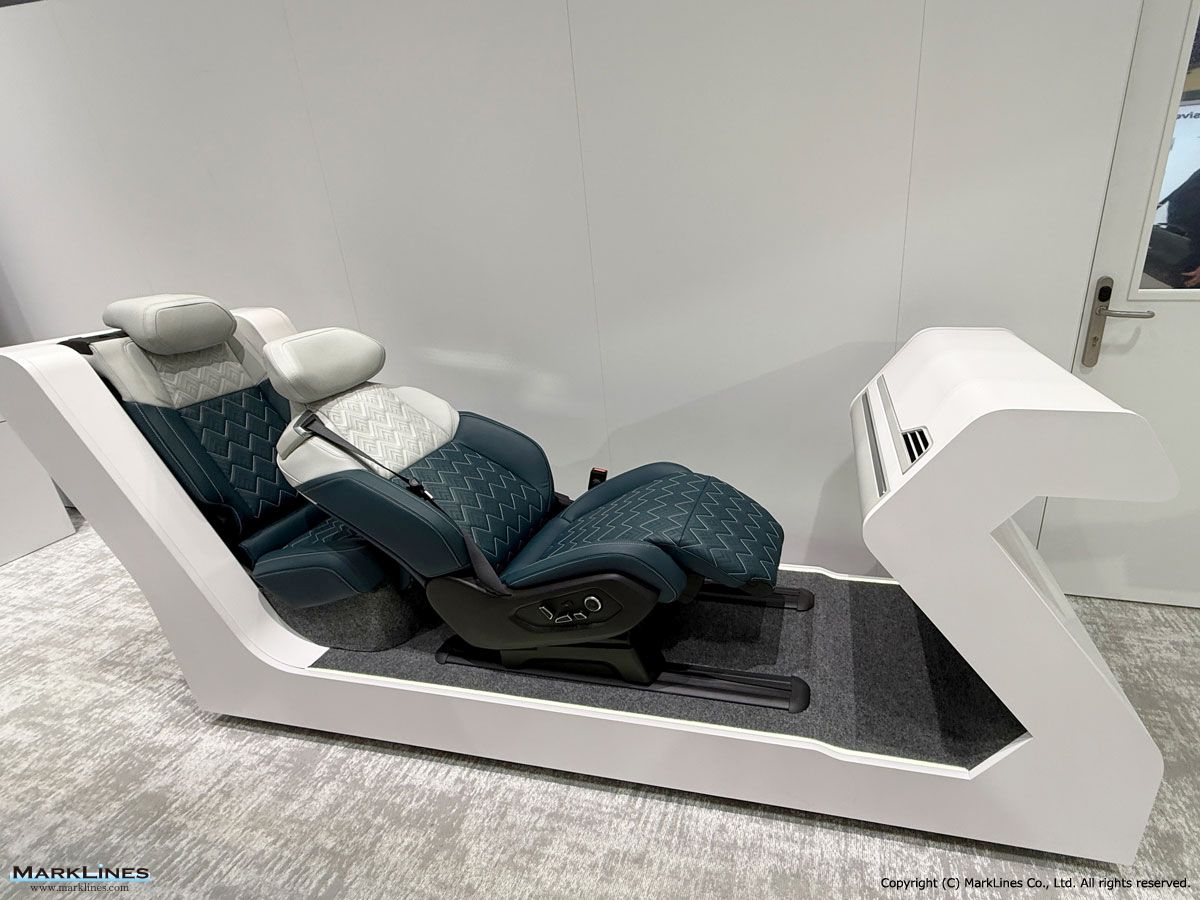
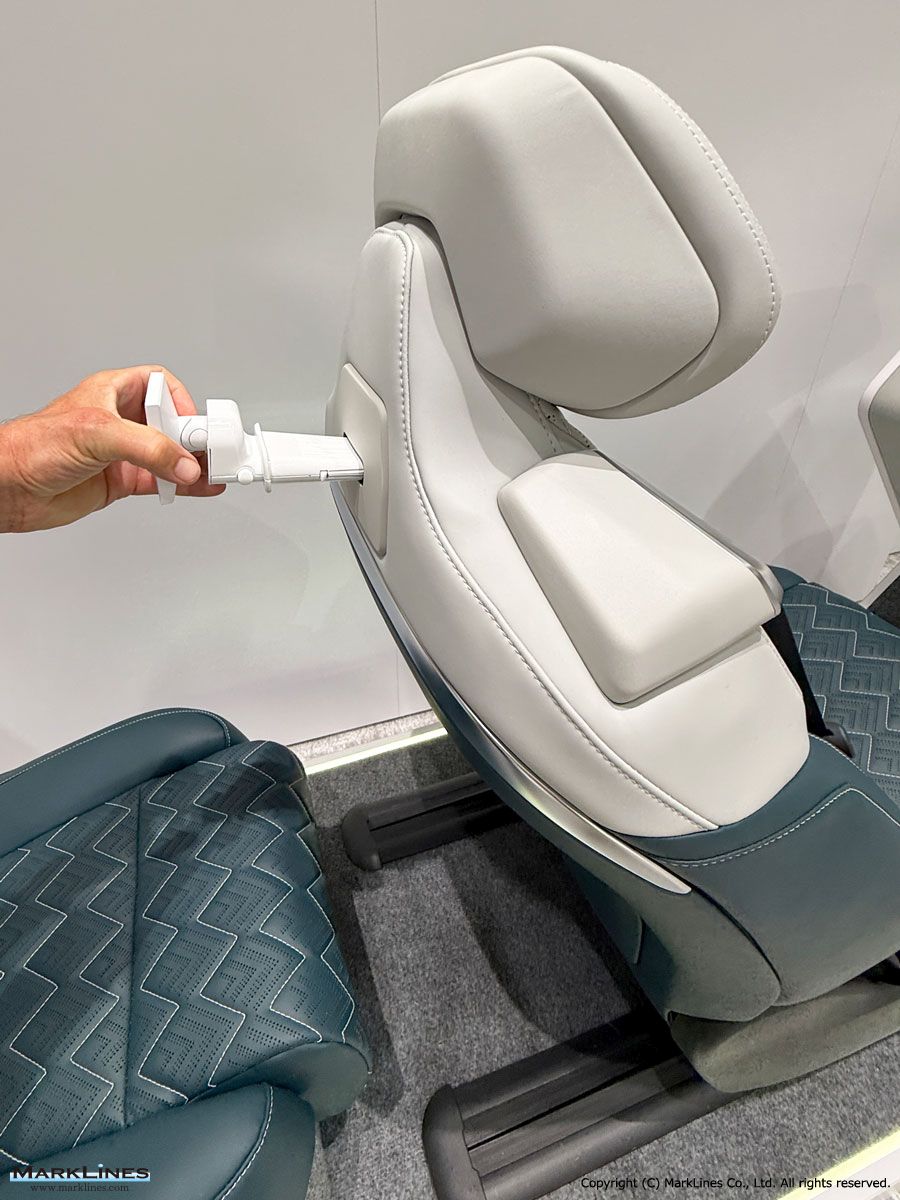
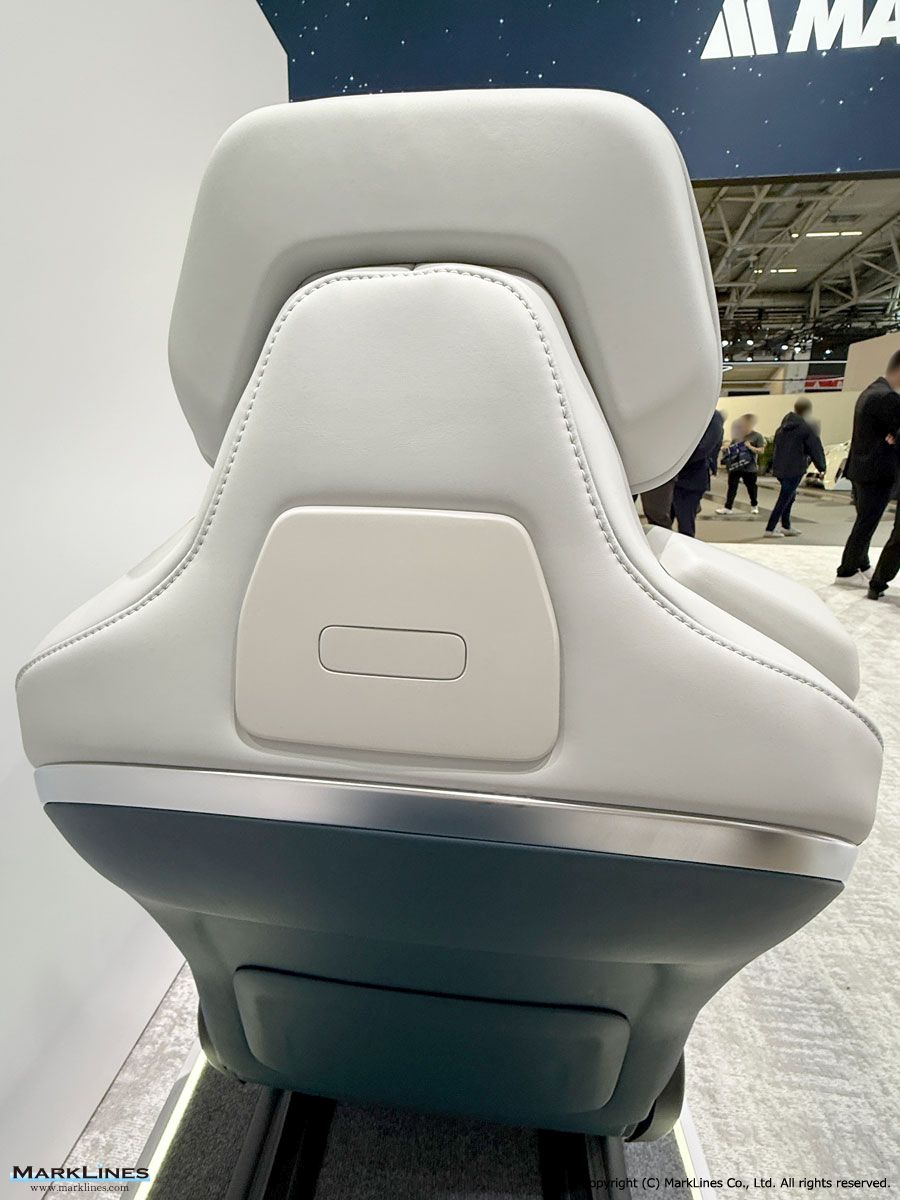
Hospitality Rear Seat
 6
6
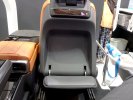
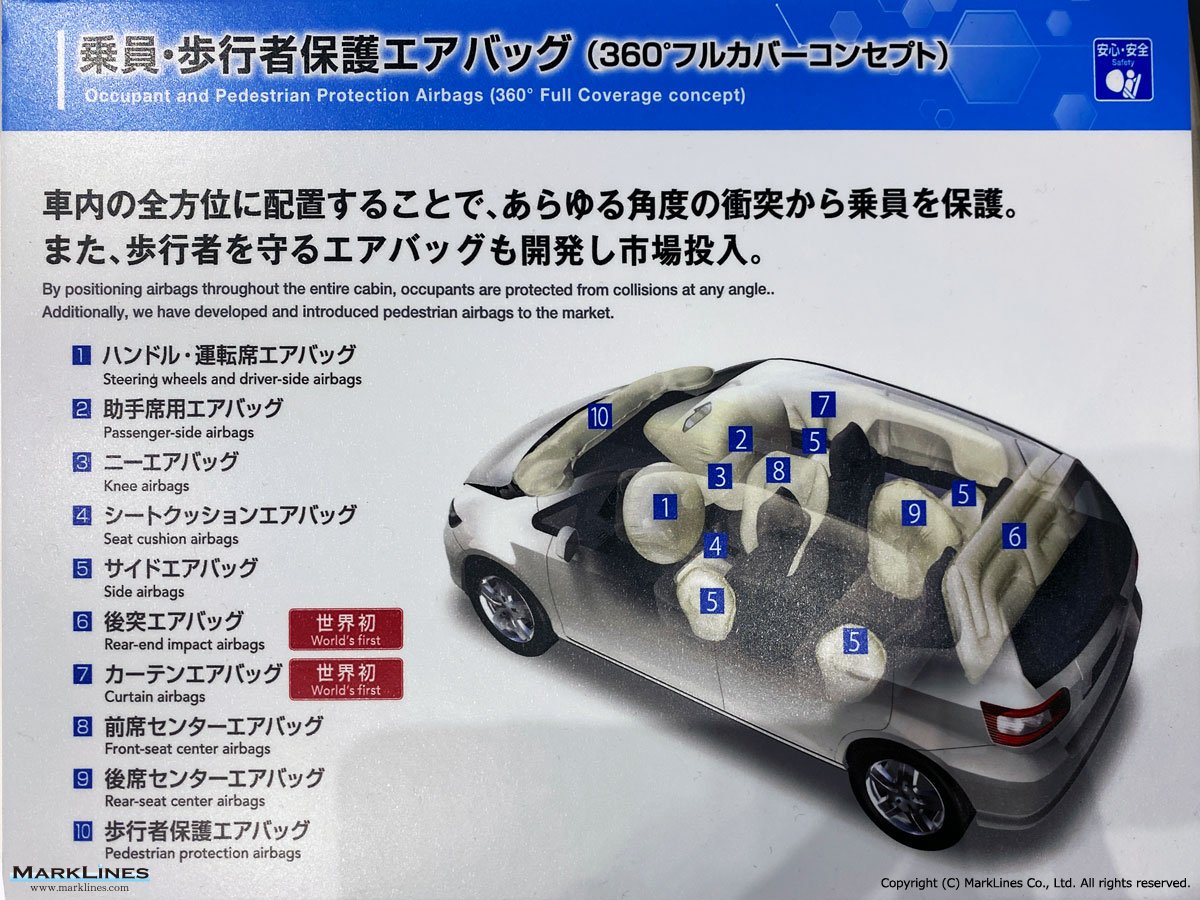
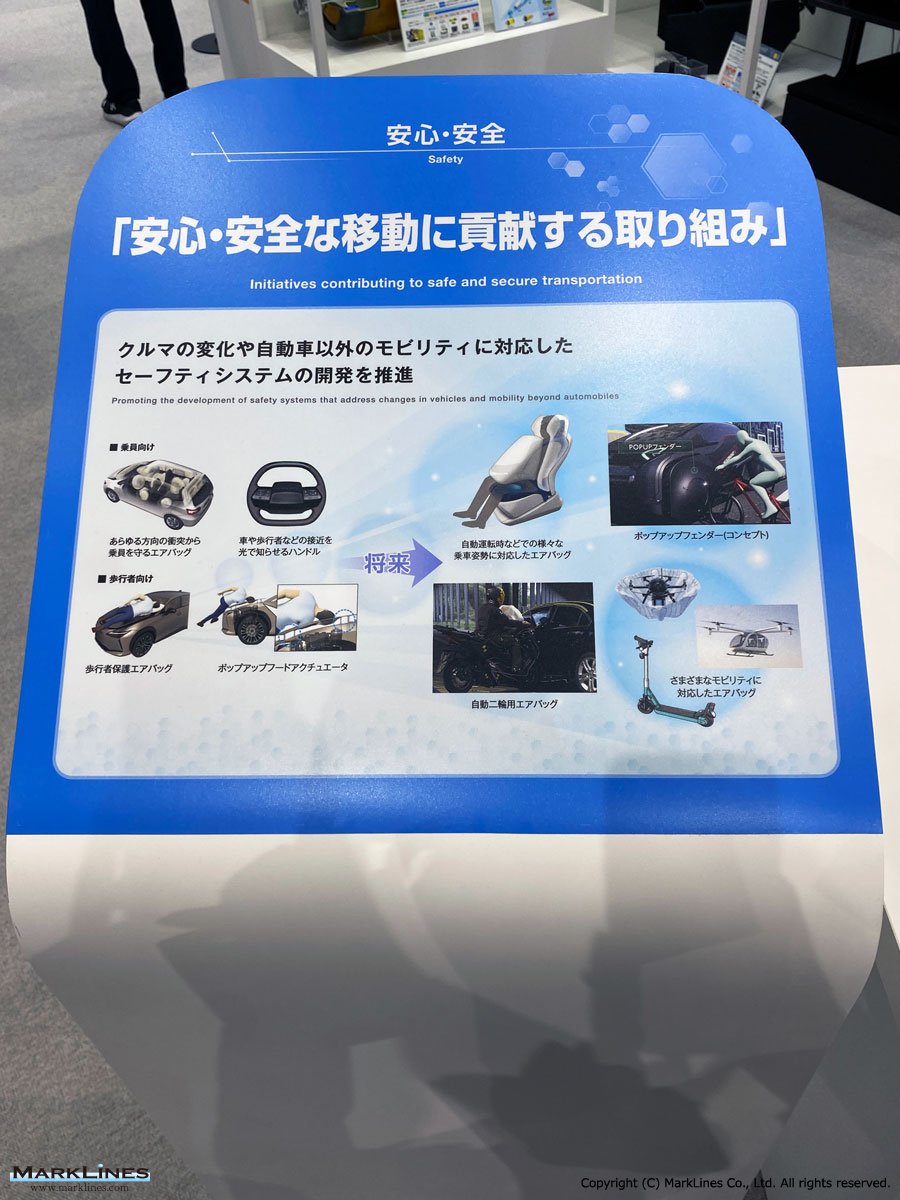
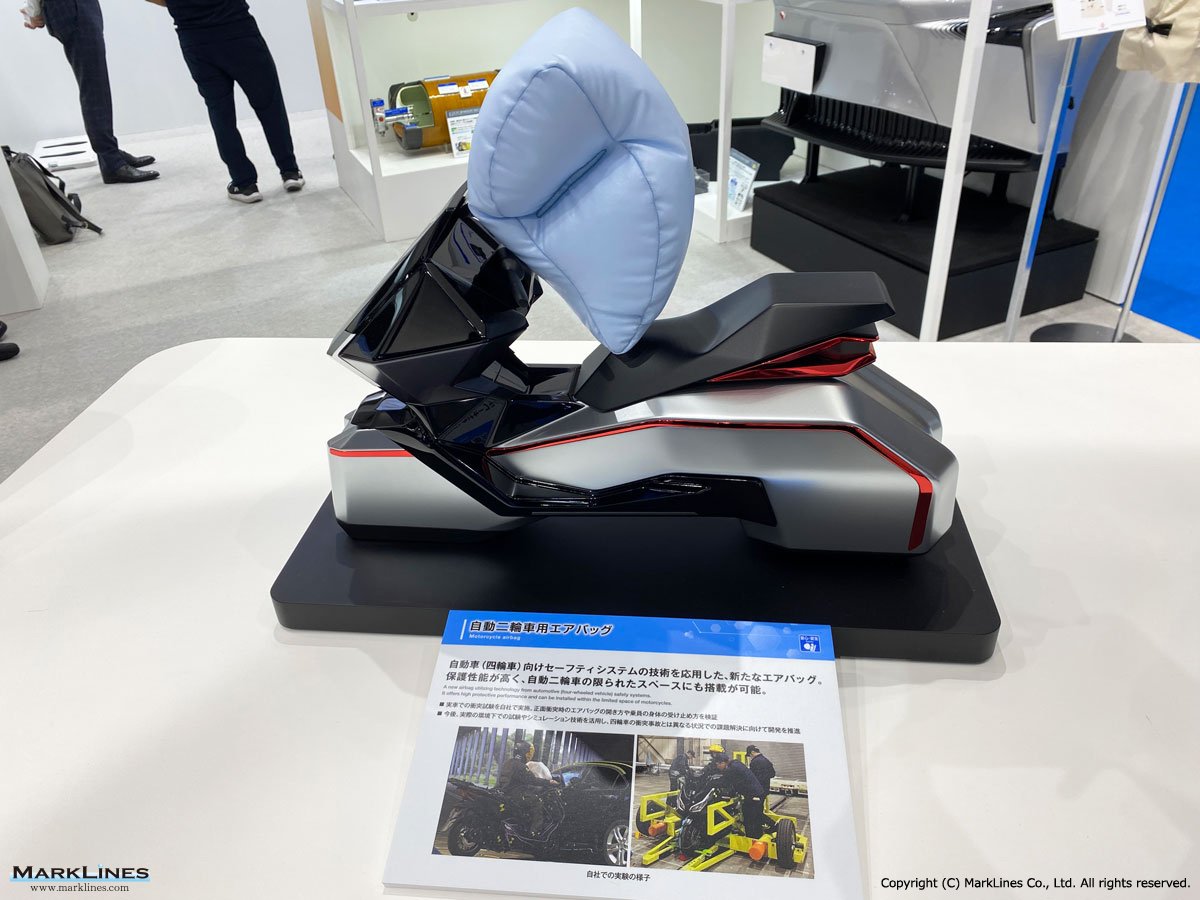
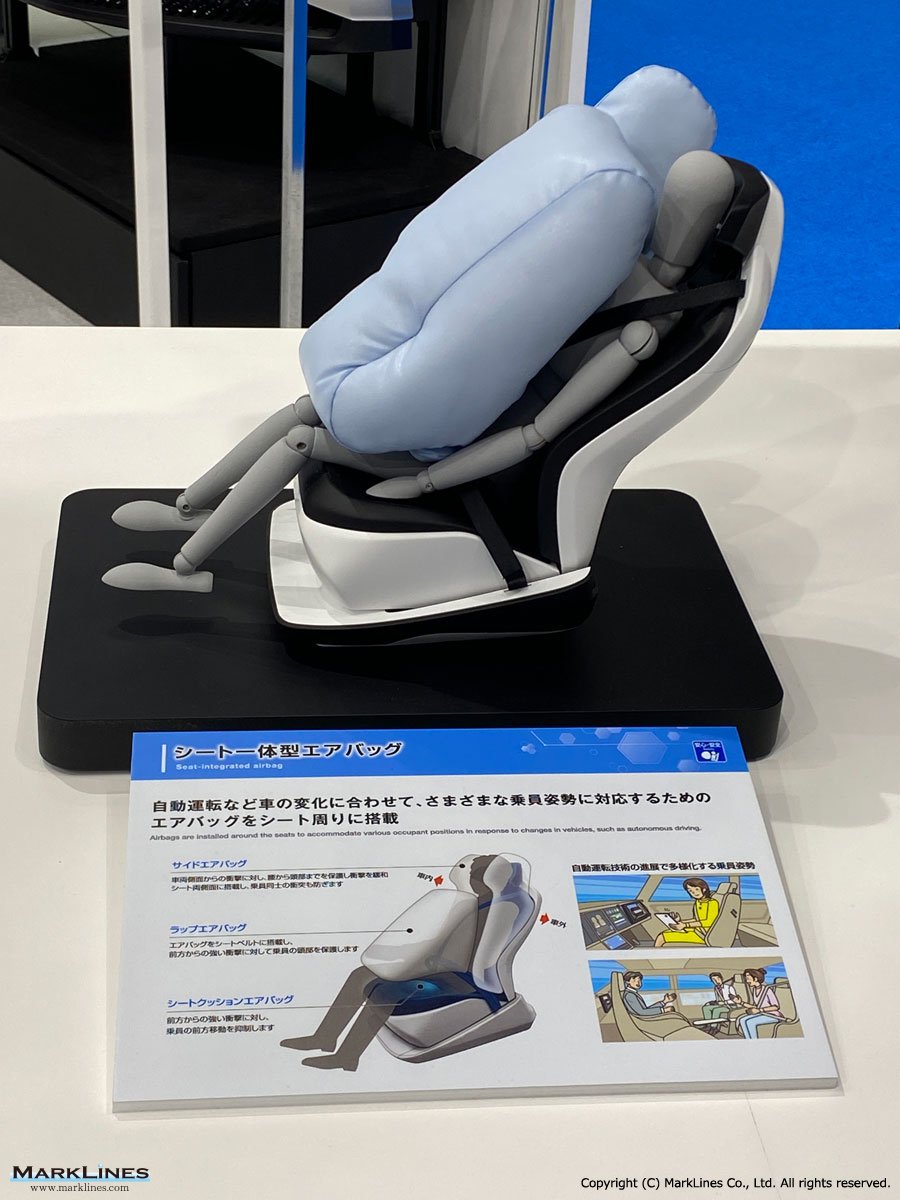
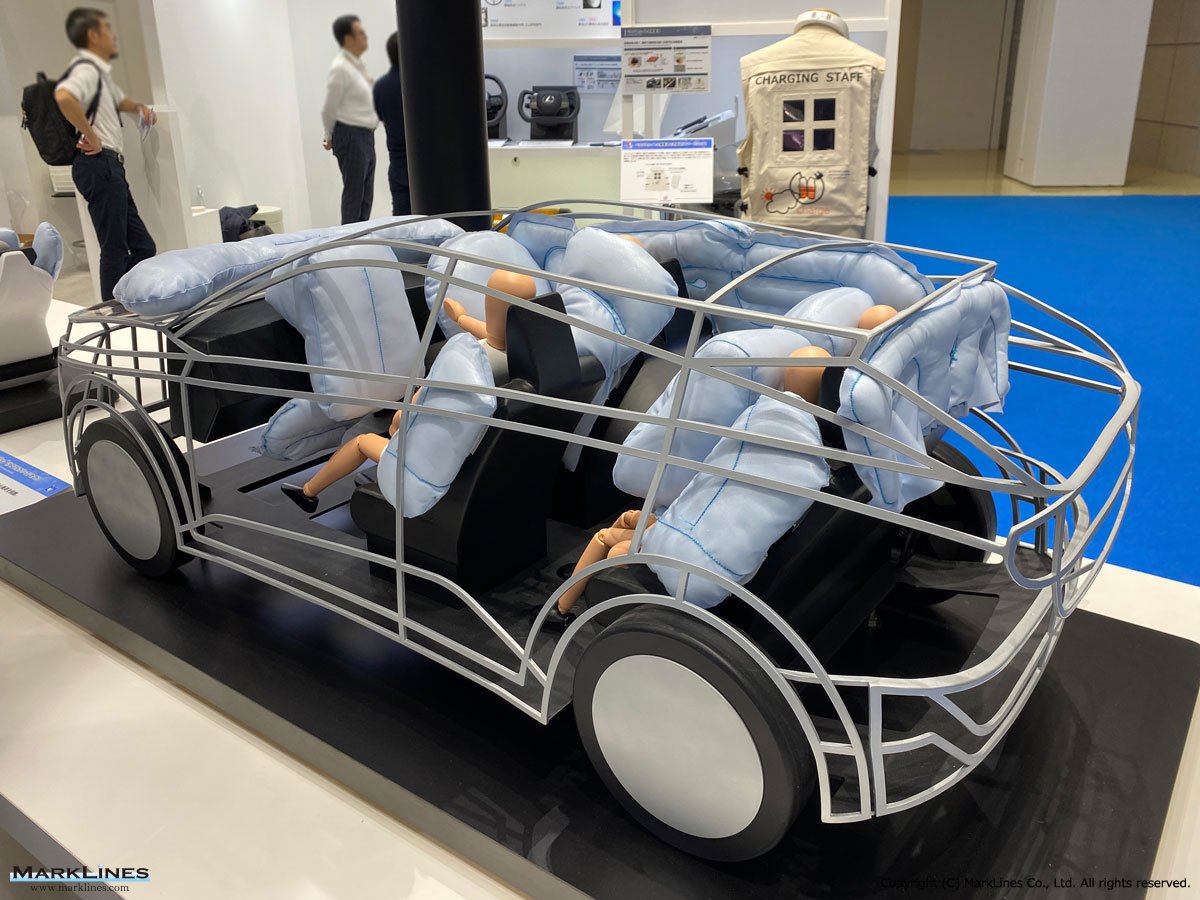
Various Airbags
 1
1
Damping Force Experience Area
 4
4
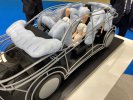
Medium Rail ZG Lounger
Sort by :
1 - 7 of 7 results
Portugal - Flash report, Production volume, 2019
ns including different information sources, and discrepancies between preliminary reports and confirmed data. Passenger Cars Maker/Brand 2019 2018 Y-o-Y 2019 2018 Y-o-Y Mar. Share Mar. Share Jan.-Mar. Share Jan.-Mar. Share VW 21,516 83.1% 15,448 83.3% 39.3% 64,141 82.1% 49,993 84.1% 28.3% Seat 2,331 9.0% 1,483 8.0% 57.2% 7,311 9.4% 4,954 8.3% 47.6% Citroen 1,217 4.7% 398 2.1% 205.8% 4,010 5.1% 1,372 2.3% 192.3% Peugeot 821 3.2% 1,22...
Automotive Production Data Updated at: 2019/04/17
Portugal - Flash report, Production volume, 2018
including different information sources, and discrepancies between preliminary reports and confirmed data. Passenger Cars Maker/Brand 2018 2017 Y-o-Y 2018 2017 Y-o-Y Dec. Share Dec. Share Jan.-Dec. Share Jan.-Dec. Share VW 15,462 88.8% 10,137 84.2% 52.5% 201,334 86.0% 76,618 60.6% 162.8% Seat 0 0.0% 923 7.7% -100.0% 19,588 8.4% 33,638 26.6% -41.8% Peugeot 711 4.1% 582 4.8% 22.2% 6,890 2.9% 10,386 8.2% -33.7% Citroen 1,247 7.2% 394 ...
Automotive Production Data Updated at: 2019/01/17
Portugal - Flash report, Production volume, 2017
s including different information sources, and discrepancies between preliminary reports and confirmed data. Passenger Cars Maker/Brand 2017 2016 Y-o-Y 2017 2016 Y-o-Y Dec. Share Dec. Share Jan.-Dec. Share Jan.-Dec. Share VW 10,137 84.2% 3,567 55.9% 184.2% 76,618 60.6% 53,912 54.3% 42.1% Seat 923 7.7% 2,081 32.6% -55.6% 33,638 26.6% 31,214 31.5% 7.8% Peugeot 582 4.8% 363 5.7% 60.3% 10,386 8.2% 7,551 7.6% 37.5% Citroen 394 3.3% 371 ...
Automotive Production Data Updated at: 2018/07/25
Portugal - Flash report, Production volume, 2016
p for reasons including different information sources, and discrepancies between preliminary reports and confirmed data. PCs Maker/Brand 2016 2015 Y-o-Y 2016 2015 Y-o-Y Dec. Share Dec. Share Jan.-Dec. Share Jan.-Dec. Share VW 3,567 55.9% 1,747 43.2% 104.2% 53,912 54.3% 74,233 64.3% -27.4% Seat 2,081 32.6% 1,287 31.8% 61.7% 31,214 31.5% 27,925 24.2% 11.8% Peugeot 363 5.7% 379 9.4% -4.2% 7,551 7.6% 6,090 5.3% 24.0% Citroen 371 5.8% 62...
Automotive Production Data Updated at: 2017/01/16
Portugal - Flash report, Production volume, 2015
time to time differ from data in the detail report to be announced at a later date due to a difference in the data source. PCs Maker/Brand 2015 2014 Y-o-Y 2015 2014 Y-o-Y Dec. Share Dec. Share Jan.-Dec. Share Jan.-Dec. Share VW 1,747 43.2% 2,619 58.5% -33.3% 74,233 64.3% 79,638 67.6% -6.8% Seat 1,287 31.8% 1,291 28.8% -0.3% 27,925 24.2% 22,612 19.2% 23.5% Citroen 628 15.5% 224 5.0% 180.4% 7,220 6.3% 6,934 5.9% 4.1% Peugeot 379 9.4% 3...
Automotive Production Data Updated at: 2016/04/22
Portugal - Flash report, Production volume, 2014
time to time differ from data in the detail report to be announced at a later date due to a difference in the data source. PCs Maker/Brand 2014 2013 Y-o-Y 2014 2013 Y-o-Y Dec. Share Dec. Share Jan.-Dec. Share Jan.-Dec. Share VW 2,619 58.5% 3,657 58.7% -28.4% 79,638 67.6% 71,210 64.9% 11.8% Seat 1,291 28.8% 1,401 22.5% -7.9% 22,612 19.2% 19,990 18.2% 13.1% Peugeot 345 7.7% 647 10.4% -46.7% 8,560 7.3% 9,696 8.8% -11.7% Citroen 224 5.0%...
Automotive Production Data Updated at: 2015/01/13
Portugal - Flash report, Production volume, 2013
to time differ from data in the detail report to be announced at a later date due to a difference in the data source. PCs Maker/Brand 2013 2012 Y-o-Y 2013 2012 Y-o-Y Dec. Share Dec. Share Jan.-Dec. Share Jan.-Dec. Share VW 3,657 58.7% 1,001 45.3% 265.3% 71,210 64.9% 93,157 80.5% -23.6% Seat 1,401 22.5% 893 40.4% 56.9% 19,990 18.2% 19,393 16.8% 3.1% Peugeot 647 10.4% 178 8.1% 263.5% 9,696 8.8% 1,734 1.5% 459.2% Citroen 525 8.4% 13...
Automotive Production Data Updated at: 2014/01/15


 Japan
Japan USA
USA Mexico
 Germany
 China (Shanghai)
 Thailand
 India
India