


Search Results by Category
All information related to {{ key_word }}.
AI Navigator will guide you. Click here for information about {{ key_word }}.
Images
 5
5
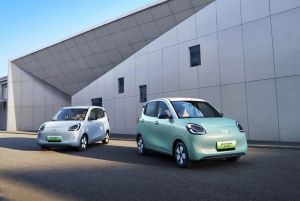
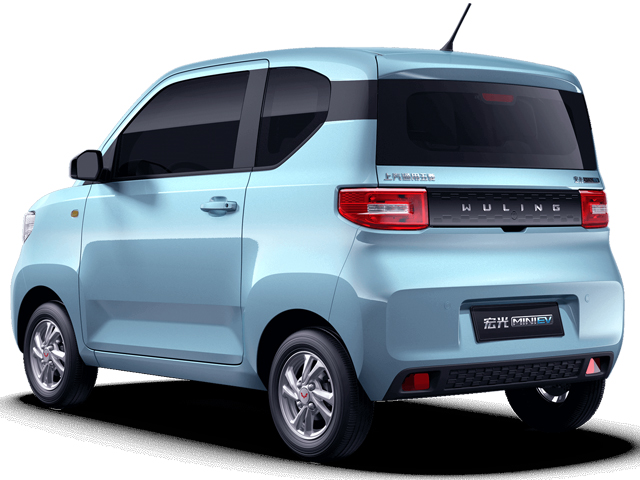
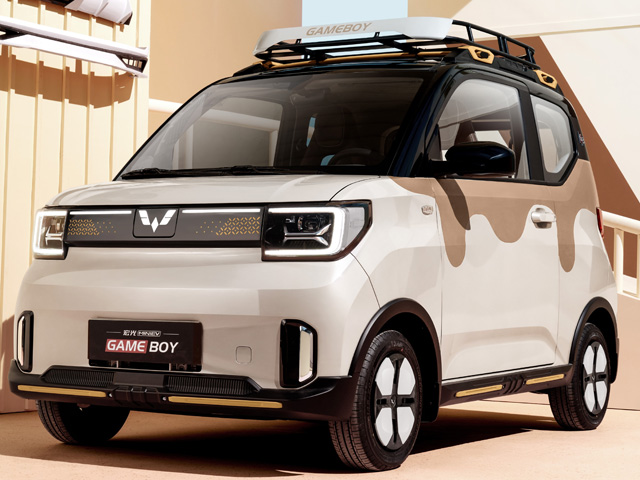
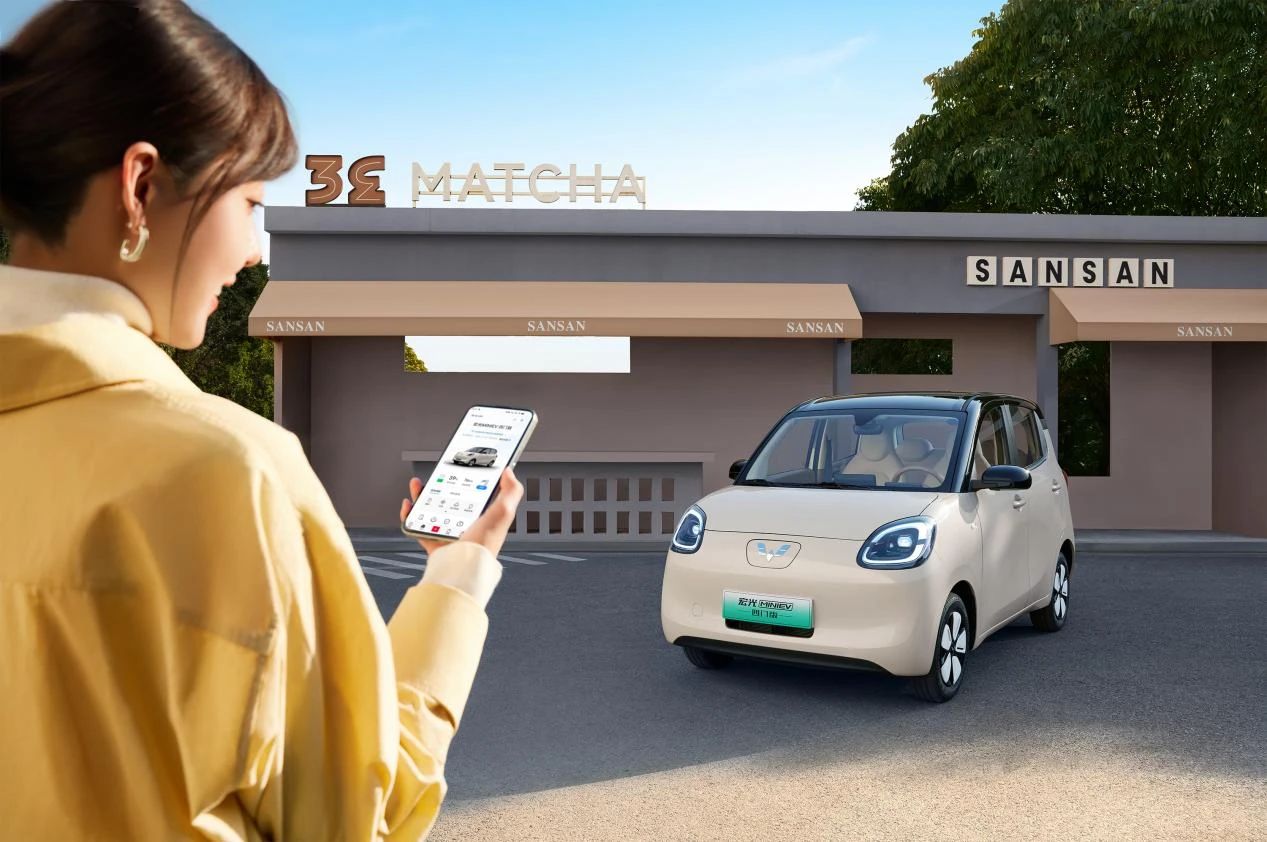
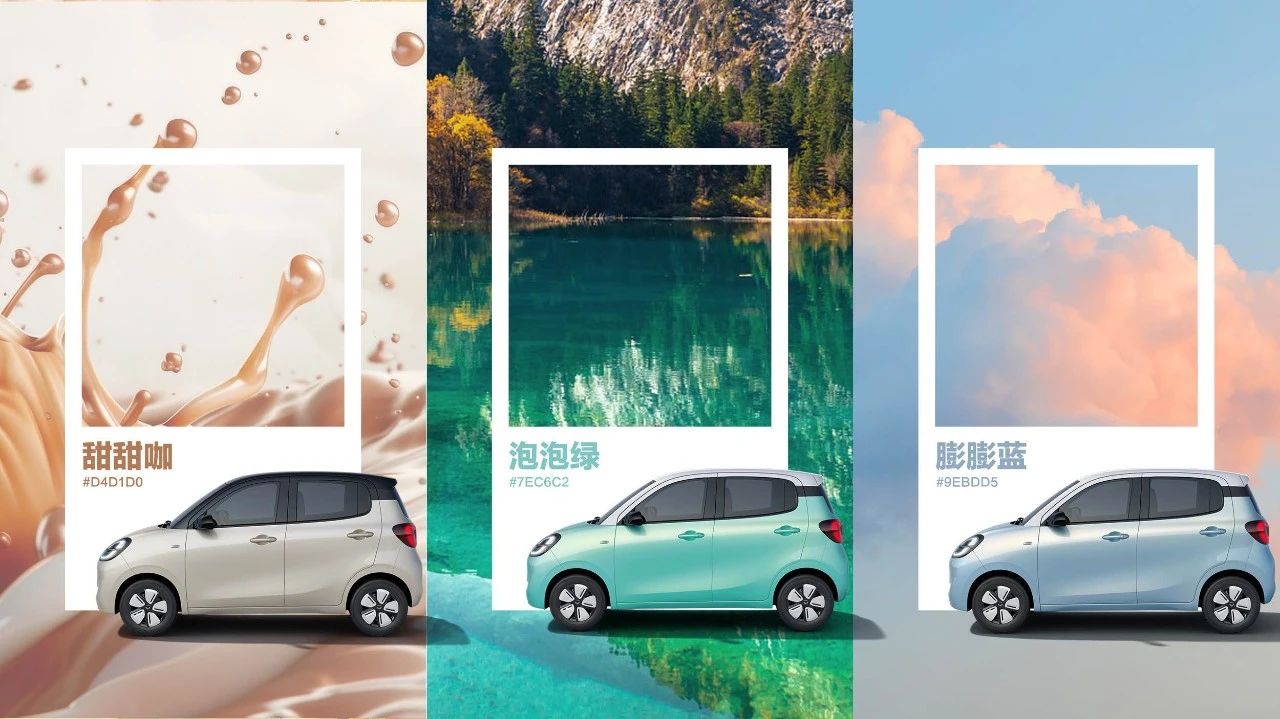
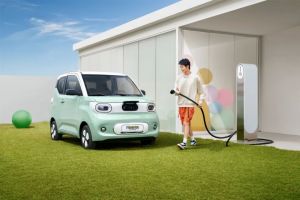
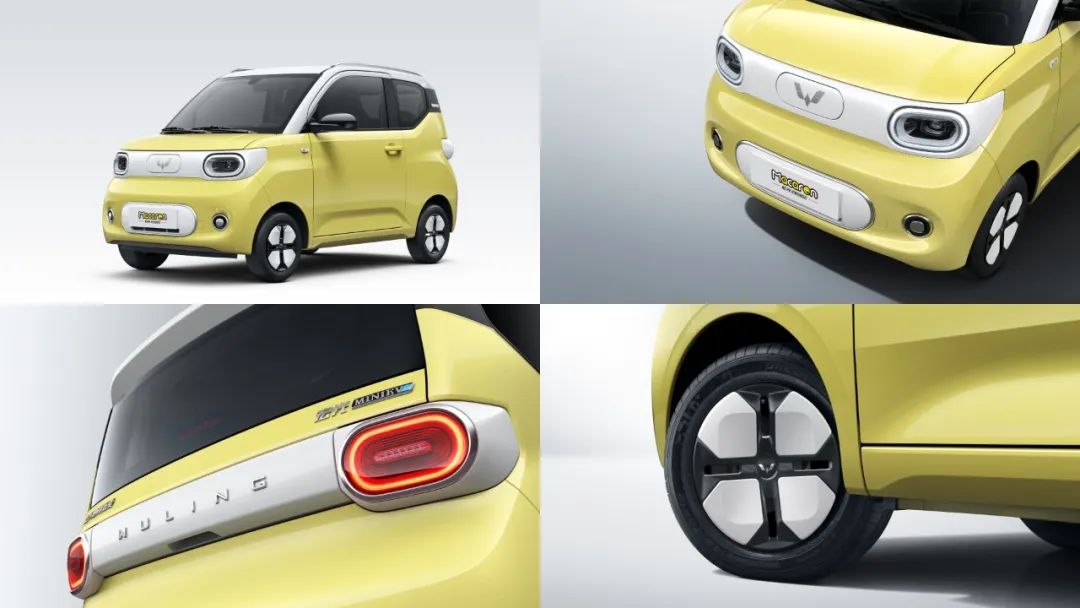
Wuling Hongguang MINI EV/Macaron/Gameboy/Convertible/4-door
 4
4
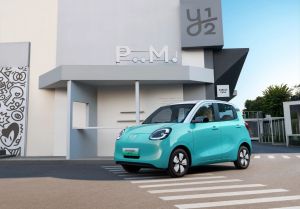
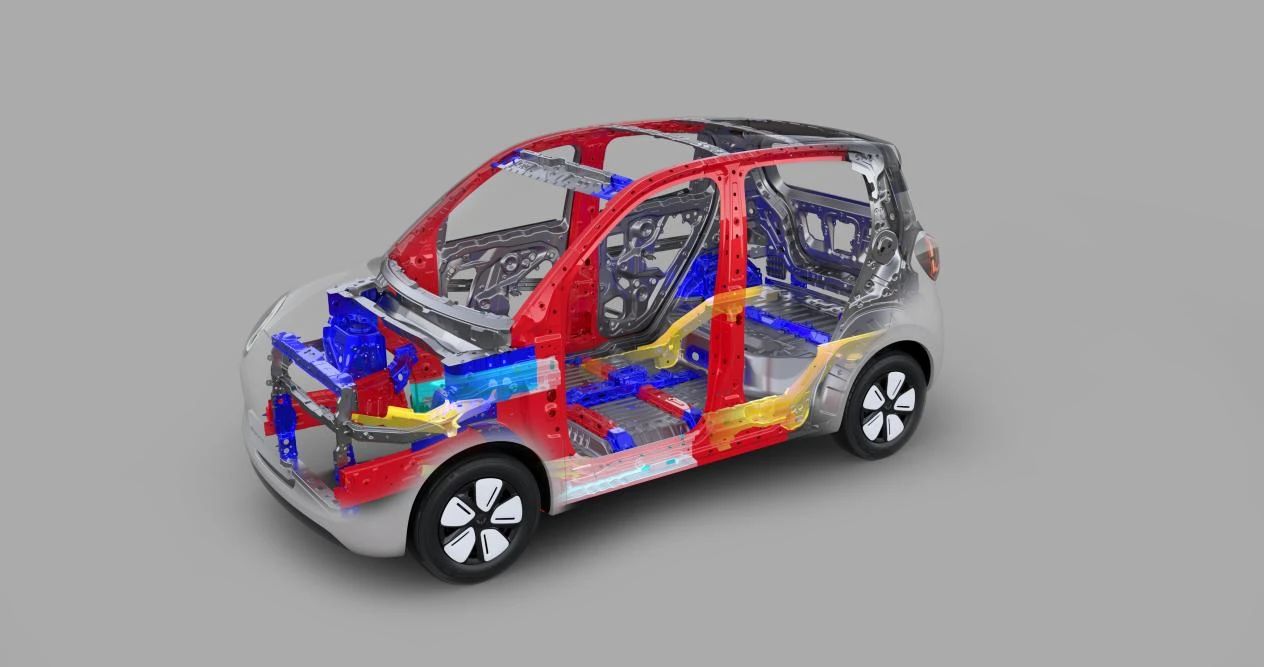
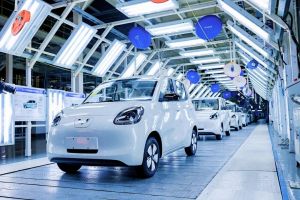
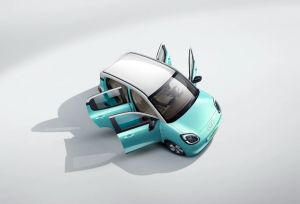
SGMW launches Hongguang MINI EV 4-Door hatchback
 3
3
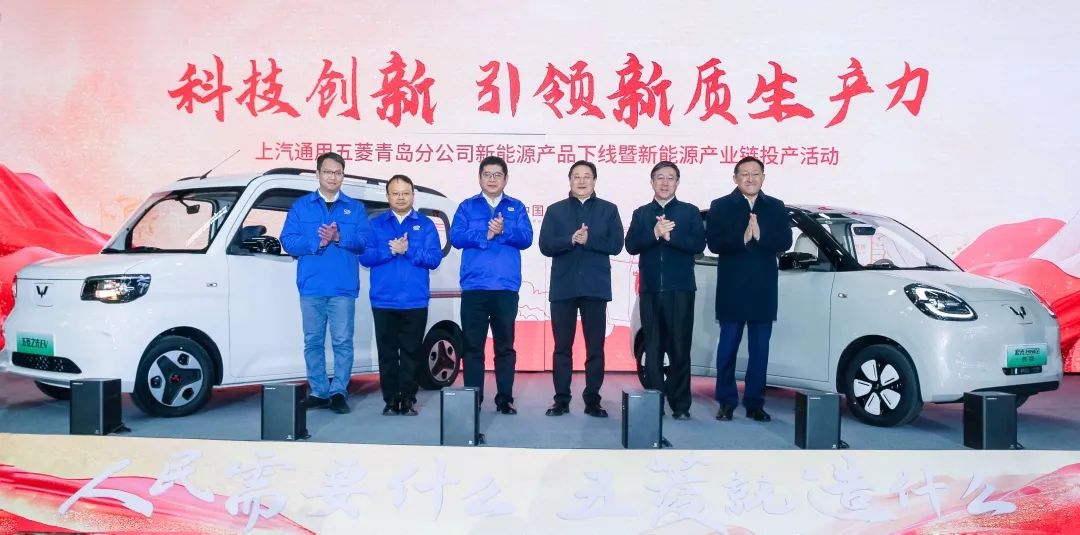
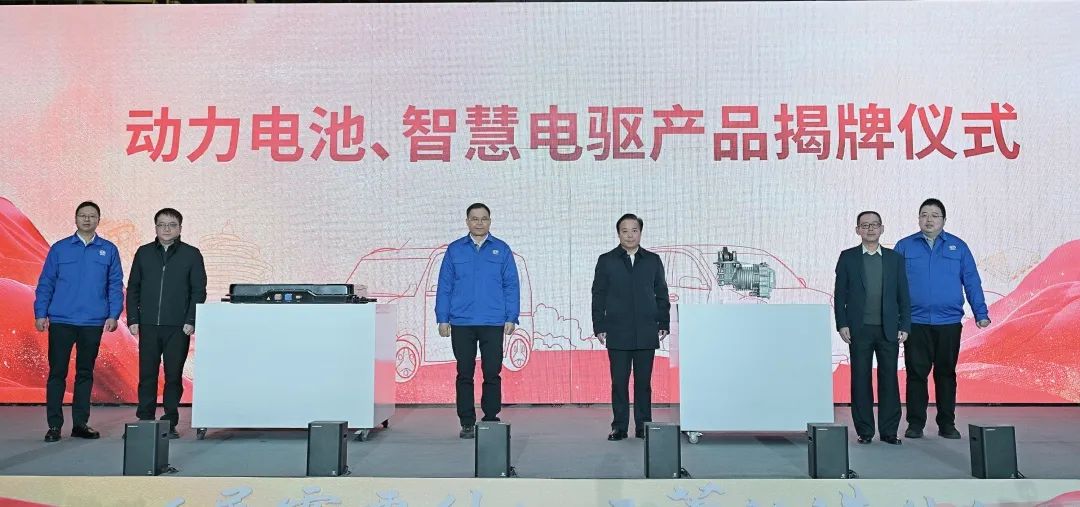
SGMW Qingdao branch kicks off production of New Energy Vehicles, marking commencement of new energy industry chain
 4
4
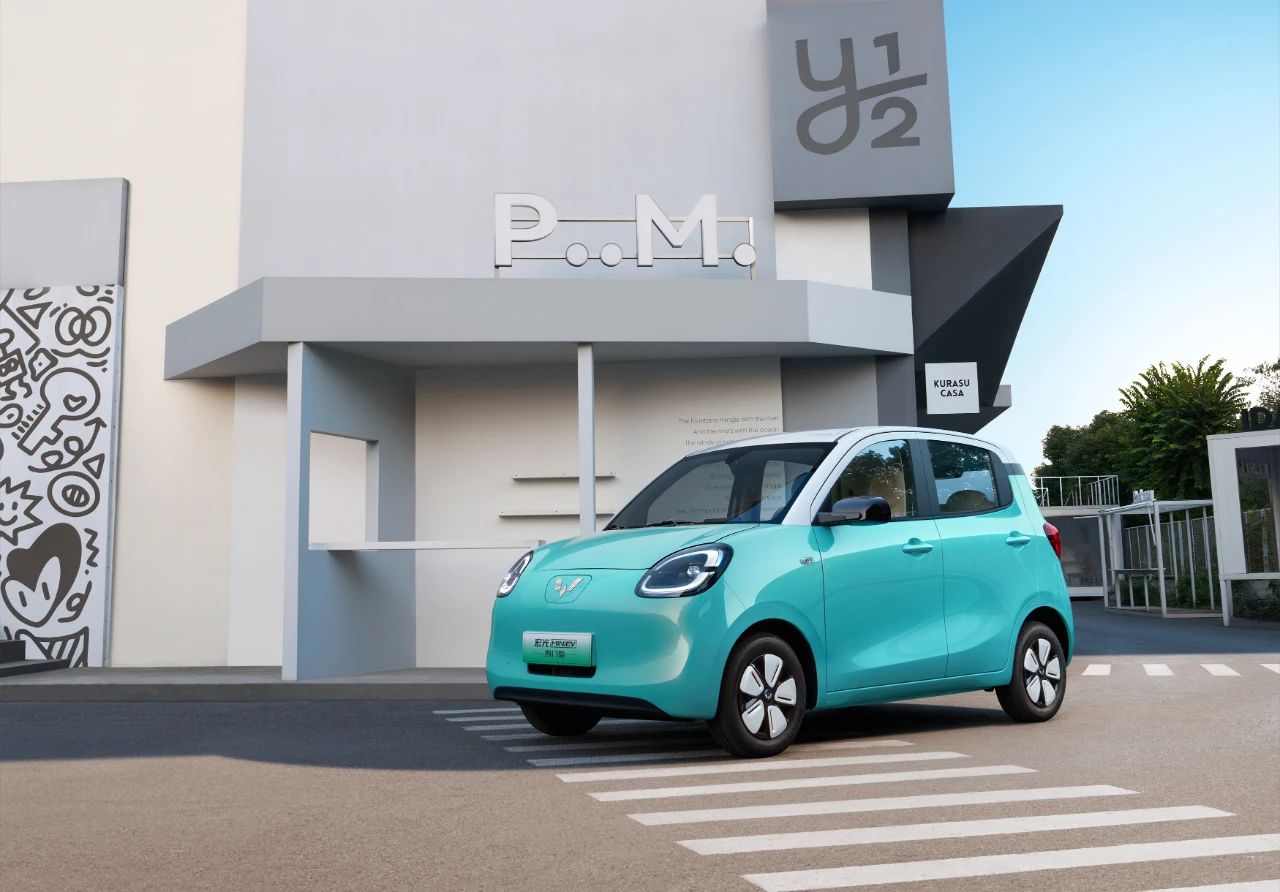
Wuling Motors unveils Hongguang MINI EV 4-door hatchback
 4
4
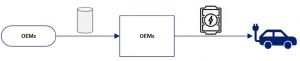
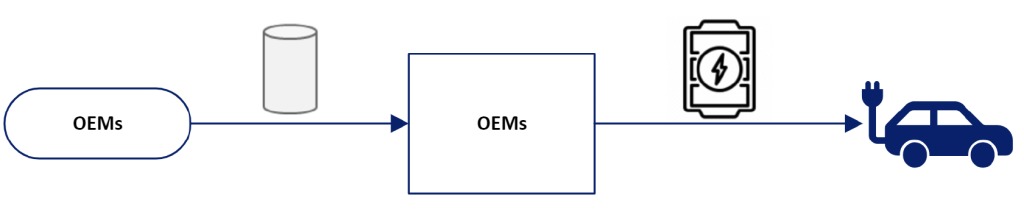
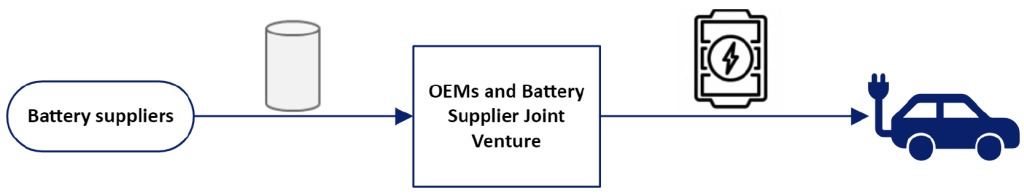
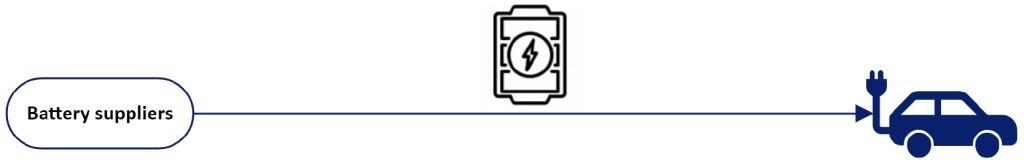
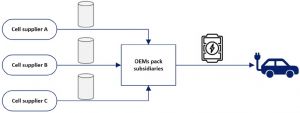
GlobalData blog: Sourcing strategies for Battery Electric Vehicle battery packs – a Chinese case study
 3
3
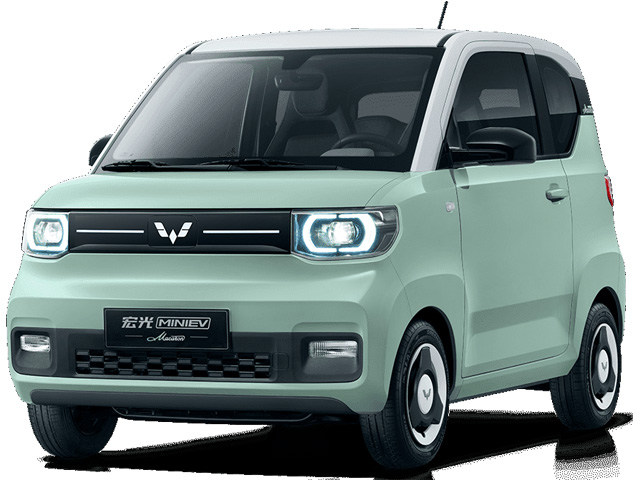
Wuling Motors officially launches 3rd-gen Hongguang MINI EV Macaron hatchback
 3
3
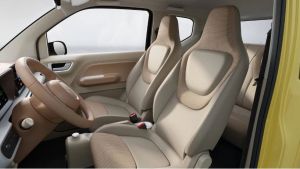
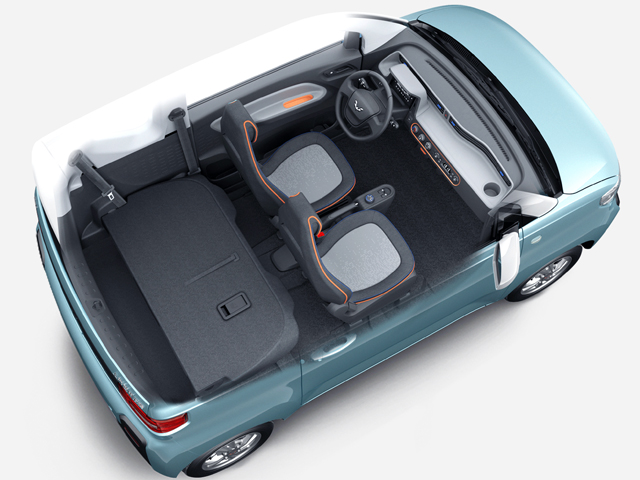
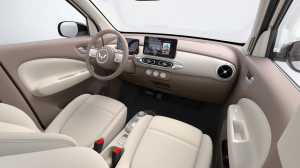
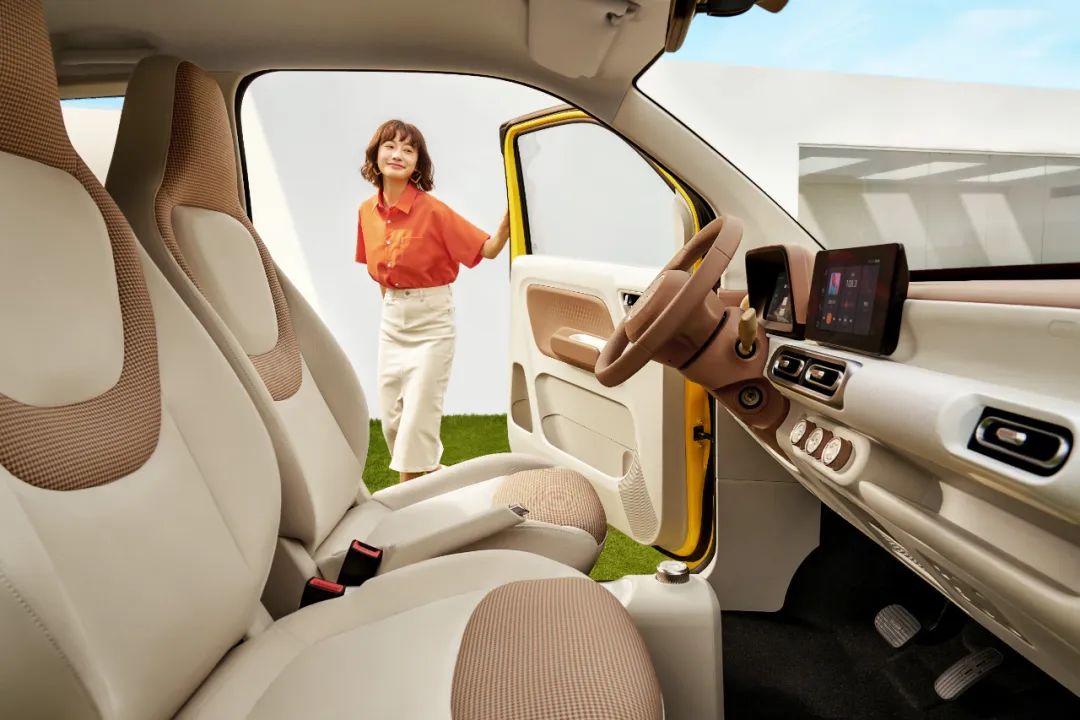
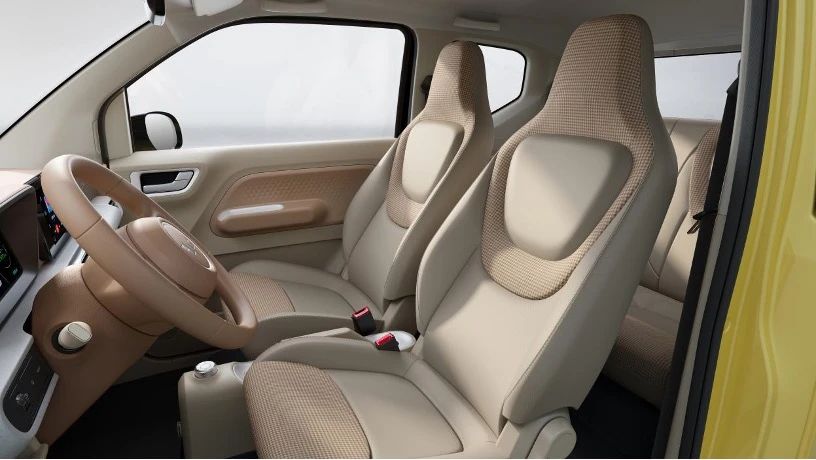
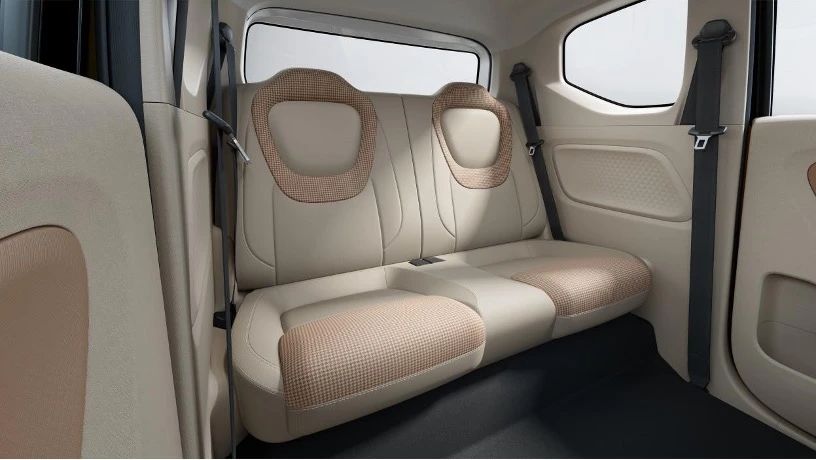
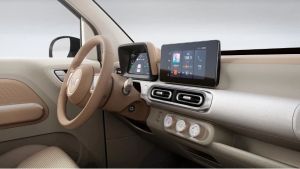
Wuling Motors unveils interior design of 3rd-gen Hongguang MINI EV Macaron hatchback
 1
1
Wuling Motors officially unveils exterior design of 3rd-gen Hongguang MINI EV Macaron hatchback
Sort by :
1 - 8 of 8 results
China - New car sales in 2025 by OEM, model, vehicle type
million units, up 100% y/y. New vehicle sales by type (Factory shipments) Dec. 2025 Jan.-Dec. 2025 Units (10,000) Share(%) Y-o-Y(%) Units(10,000) Share(%) Y-o-Y(%) Sedan/Hatchback 112.4 34.4 -10.2 1,242.4 36.1 7.9 MPV 11.2 3.4 -17.0 121.3 3.5 15.5 SUV 159.0 48.6 -6.3 1,612.3 46.9 9.5 Mini Van 2.1 0.6 -41.7 34.3 1.0 25.3 Passenger Cars Total 284.7 87.0 -8.7 3,010.3 87.5 9.2 Commercial Vehicles Total 42.5 13.0 15.3 429.6 ...
Automotive Sales Data Updated at: 2026/02/10
China - New car sales in 2024 by OEM, model, vehicle type
ciple of pursuing progress while ensuring stability in terms of economic development in 2025, a move conducive to further strengthening development confidence, stimulating market vitality, and driving continuous economic upturn. On January 8, China’s National Development and Reform Commission and Ministry of Finance jointly issued the “Notification of Expanding the Implementation Scope of Policies for Large-scale Equipment Replacement and Con...
Automotive Sales Data Updated at: 2025/07/02
China - Flash report, Automotive sales volume, 2022
ting an increase of 120% y/y.New vehicle sales by type (Factory shipments) Dec. 2022 Jan.-Dec. 2022 Units(10,000) Share(%) Y-o-Y(%) Units(10,000) Share(%) Y-o-Y(%) Sedan/Hatchback 106.1 41.5 -5.8 1,111.6 41.4 11.5 MPV 10.0 3.9 -11.5 93.7 3.5 -11.2 SUV 107.0 41.9 -6.2 1,118.7 41.6 10.8 Mini Van 3.4 1.3 -17.1 32.3 1.2 -17.4 Passenger Cars Total 226.5 88.6 -6.7 2,356.3 87.7 9.5 Commercial Vehicles Total 29.1 11.4 -20.2 330.0 ...
Automotive Sales Data Updated at: 2025/06/04
China - Flash report, Automotive sales volume, 2021
were 402,000 units, up by 70.7% y/y.New vehicle sales by type (Factory shipments) Dec. 2021 Jan.-Dec. 2021 Units(10,000) Share(%) Y-o-Y(%) Units(10,000) Share(%) Y-o-Y(%) Sedan/Hatchback 112.6 40.4 7.5 993.4 37.8 7.1 MPV 11.3 4.1 -20.8 105.5 4.0 0.1 SUV 114.1 41.0 0.3 1,010.1 38.4 6.8 Mini Van 4.1 1.5 -11.8 39.1 1.5 0.8 Passenger Cars Total 242.2 86.9 2.0 2,148.2 81.8 6.5 Commercial Vehicles Total 36.4 13.1 -20.1 479.3 18....
Automotive Sales Data Updated at: 2025/06/04
China - Flash report, Sales volume, 2020
d 995,000 units, down by 2.9% y/y. New vehicle sales by type (Factory shipments) Dec. 2020 Jan.-Dec. 2020 Units(10,000) Share(%) Y-o-Y(%) Units(10,000) Share(%) Y-o-Y(%) Sedan/Hatchback 104.7 37.0 2.3 927.5 36.6 -9.9 MPV 14.3 5.0 -3.2 105.4 4.2 -23.8 SUV 113.8 40.2 14.2 946.1 37.4 0.7 Mini Van 4.7 1.7 -1.8 38.8 1.5 -2.9 Passenger Cars Total 237.5 83.9 7.2 2,017.8 79.7 -6.0 Commercial Vehicles Total 45.6 16.1 2.4 513.3 20....
Automotive Sales Data Updated at: 2025/06/04
China - Flash report, Sales volume, 2019
, reflecting a 5.7% y/y increase.New vehicle sales by type (Factory shipments) Dec. 2019 Jan.-Dec. 2019 Units(10,000) Share(%) Y-oY(%) Units(10,000) Share(%) Y-oY(%) Sedan/Hatchback 102.6 38.6 -0.4 1,030.8 40.0 -10.7 MPV 14.8 5.6 -16.1 138.4 5.4 -20.2 SUV 99.1 37.3 1.2 935.3 36.3 -6.3 Mini Van 4.8 1.8 1.7 40.0 1.6 -11.7 Passenger Cars Total 221.3 83.3 -0.9 2,144.4 83.2 -9.6 Commercial Vehicles Total 44.5 16.7 3.9 432.4 16.8 -1....
Automotive Sales Data Updated at: 2020/05/12
China - Flash report, Sales volume, 2018
00,000 units.New vehicle sales by type (Factory shipments) Dec. 2018 Jan.-Dec. 2018 Units(10,000) Share(%) Y-oY(%) Units(10,000) Share(%) Y-oY(%) Sedan/Hatchback 102.85 38.64 -14.30 1,152.78 41.05 -2.70 MPV 17.62 6.62 -22.85 173.46 6.18 -16.22 SUV 98.16 36.88 -16.32 999.47 35.59 -2.52 Mini Van 4.68 1.76 -9.65 45.26 1.61 -17.26 Passenger Cars Total 223.31 83.90 -15.84 2,370.98 84.43 -4.08 Commercial Vehicles Total 42.84 16.10 5....
Automotive Sales Data Updated at: 2019/01/31
China - Flash report, Sales volume, 2017
modified. New vehicle sales by type (Factory shipments) Dec. 2017 Jan.-Dec. 2017 Units(10,000) Share(%) Y-oY(%) Units(10,000) Share(%) Y-oY(%) * Sedan/Hatchback 120.00 39.21 -4.35 1,184.80 41.03 -2.48 MPV 22.83 7.46 -15.98 207.07 7.17 -17.05 SUV 117.30 38.33 8.40 1,025.27 35.50 13.32 Mini Van 5.18 1.69 -18.72 54.70 1.89 -19.97 Passenger Cars Total 265.33 86.70 -0.71 2,471.83 85.59 1.40 Commercial Vehicles Total 40.70 13.30 5.7...
Automotive Sales Data Updated at: 2018/07/24


 Japan
Japan USA
USA Mexico
 Germany
 China (Shanghai)
 Thailand
 India
India