


Search Results by Category
All information related to {{ key_word }}.
AI Navigator will guide you. Click here for information about {{ key_word }}.
Images
 3
3
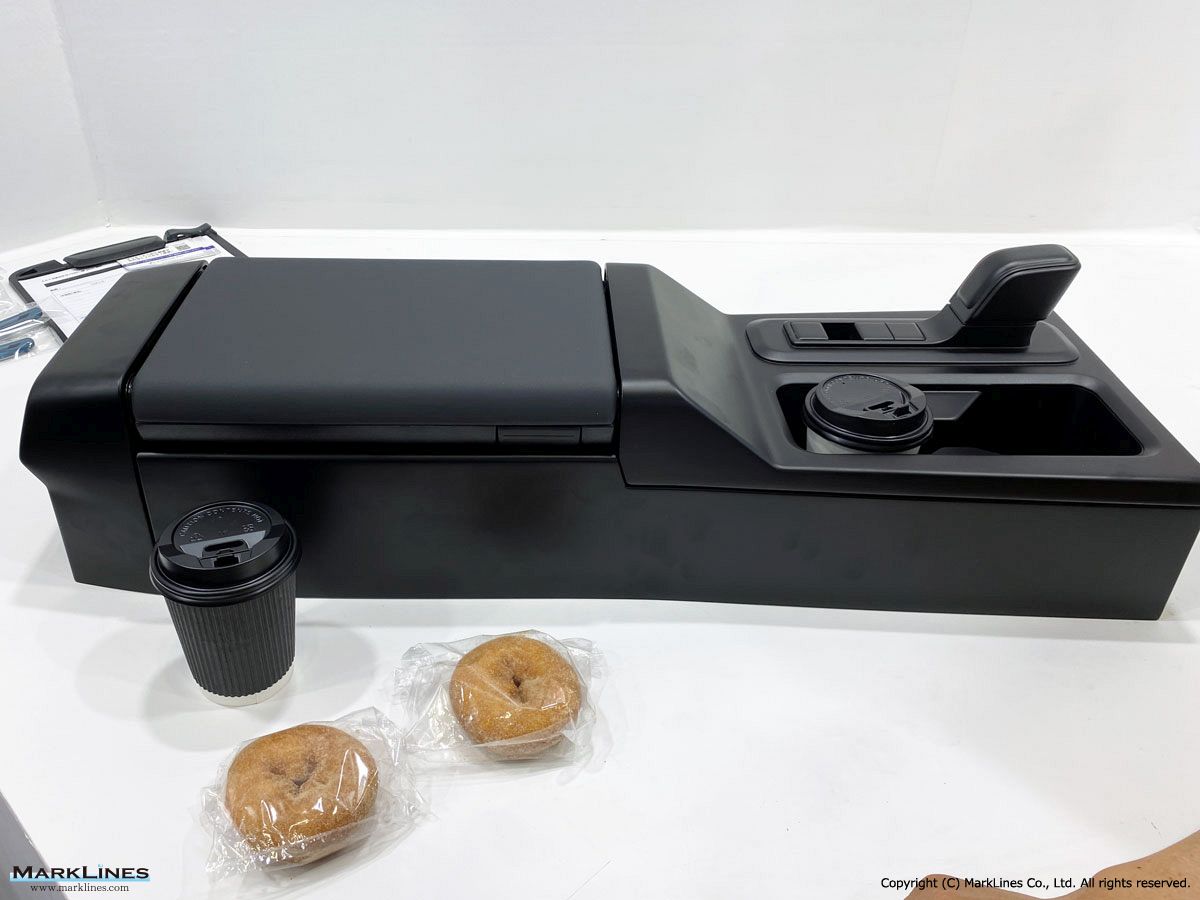
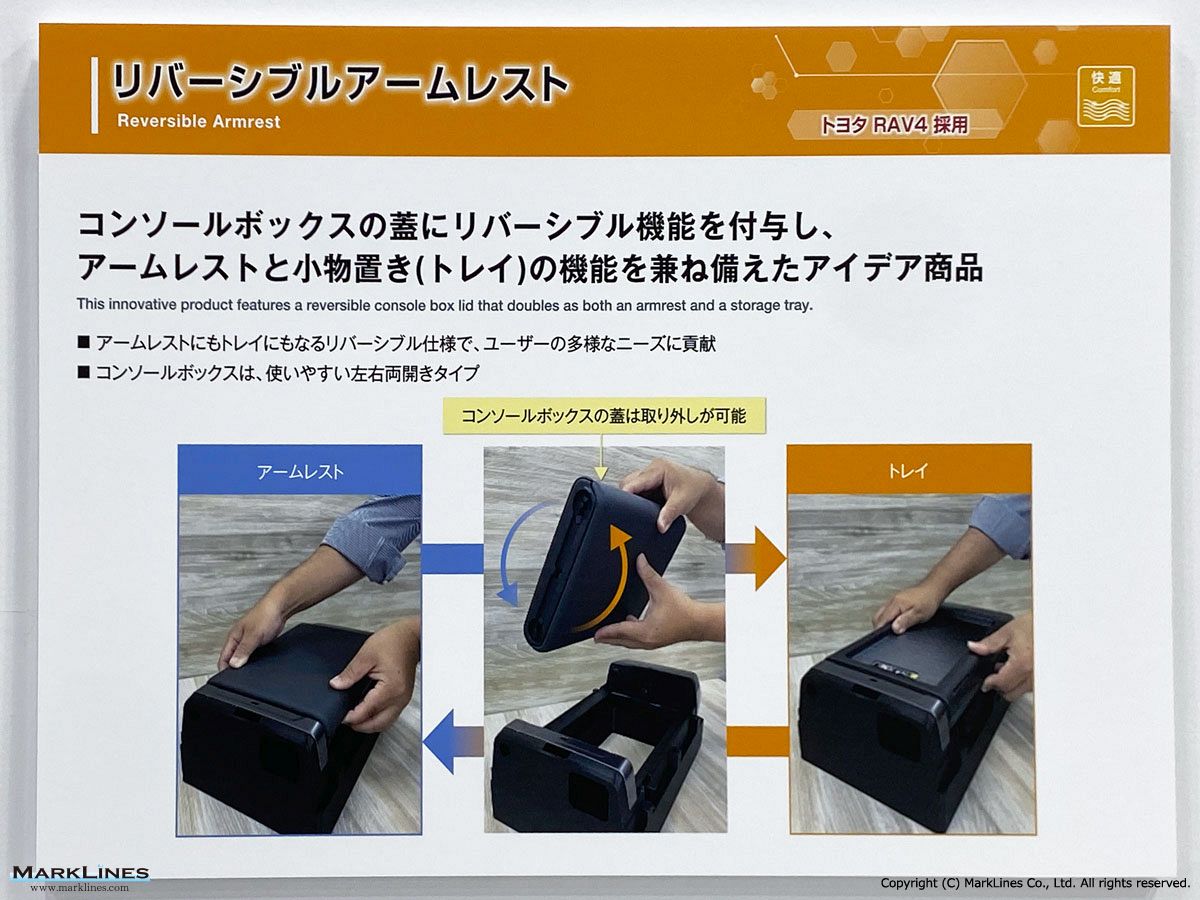
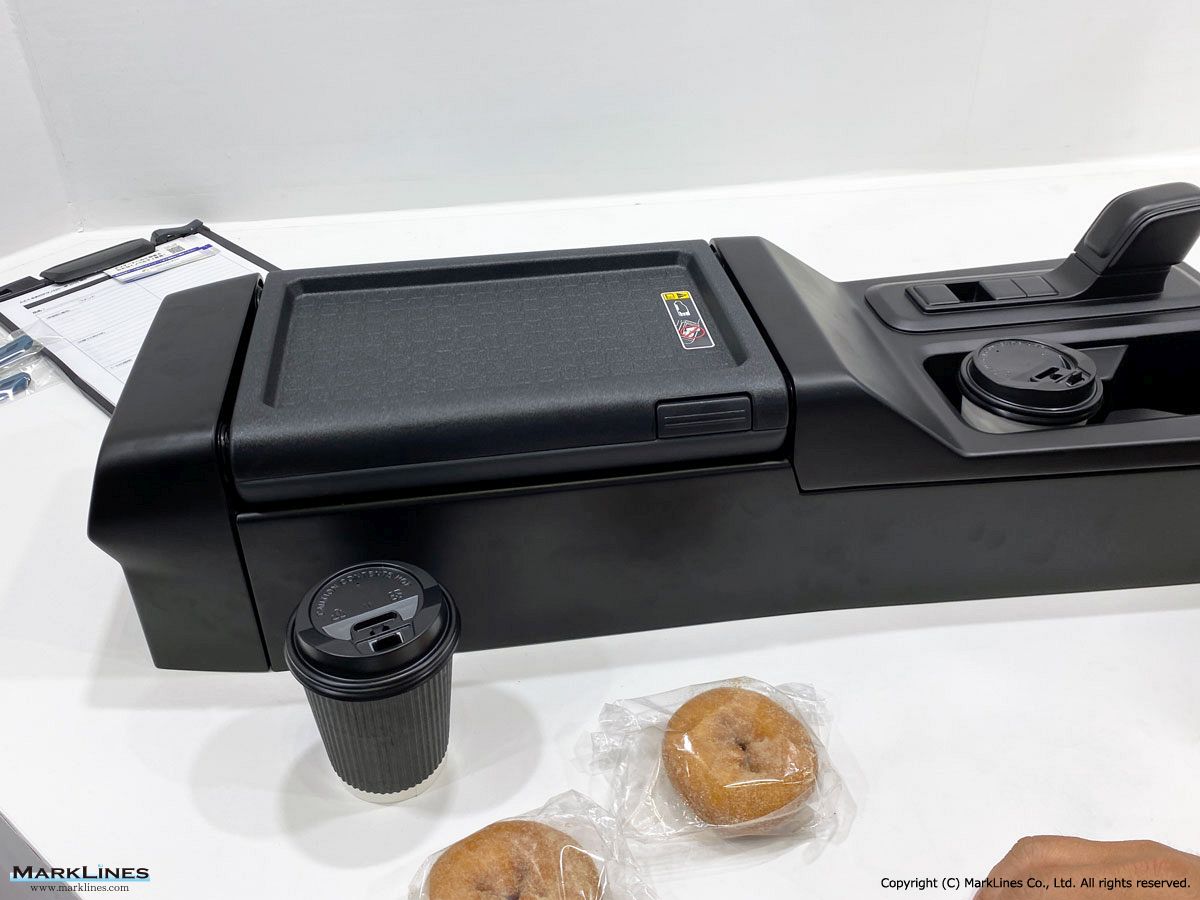
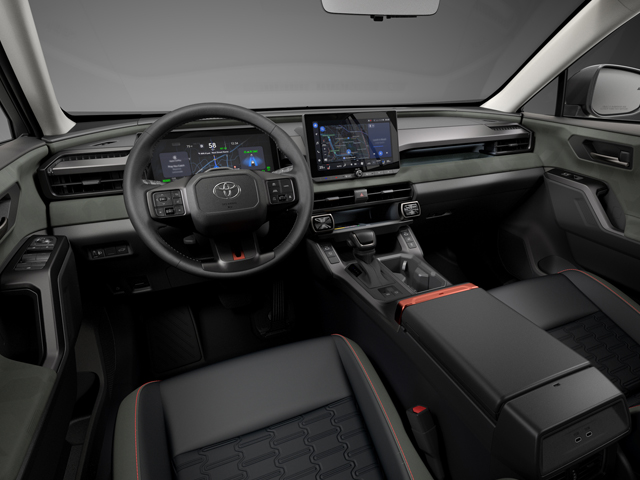
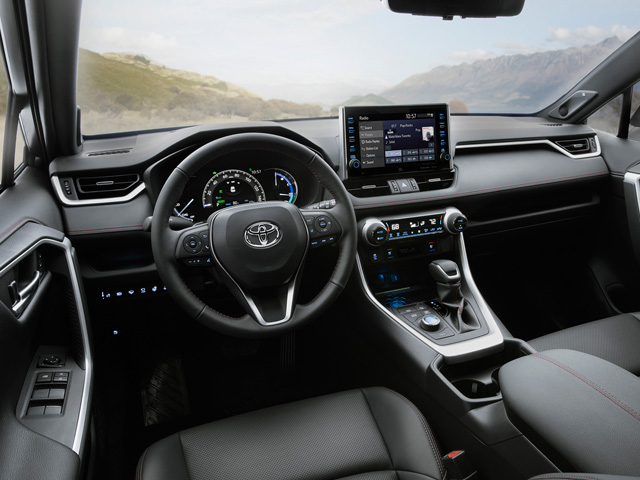
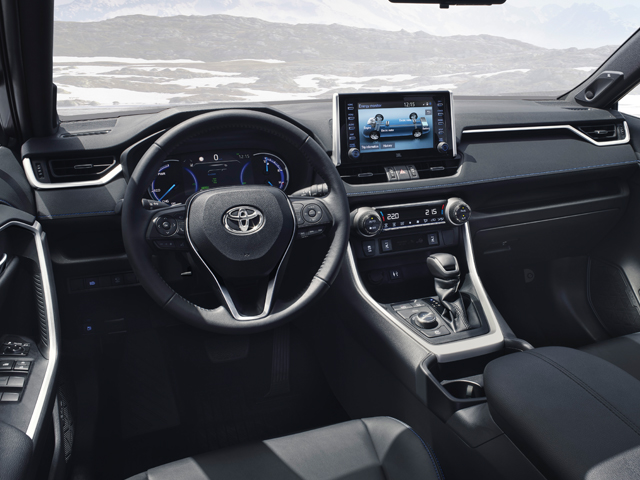
Reversible armrest
 6
6
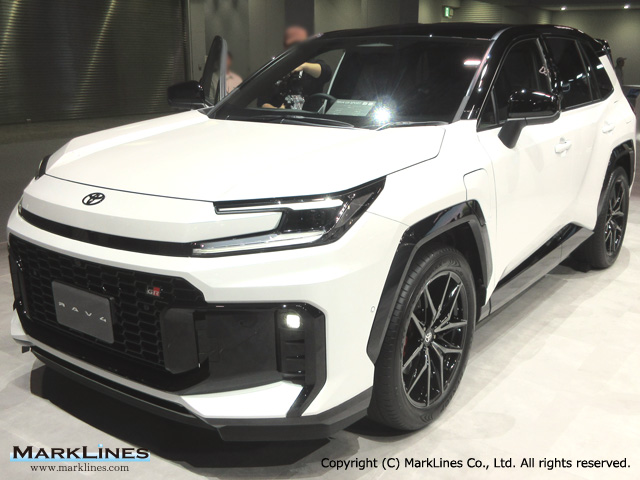
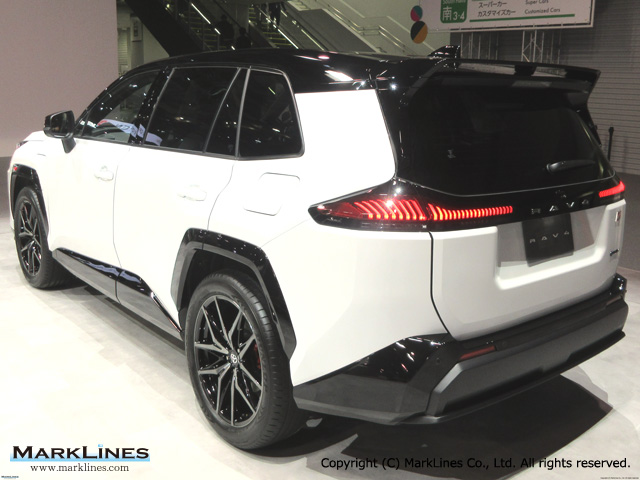
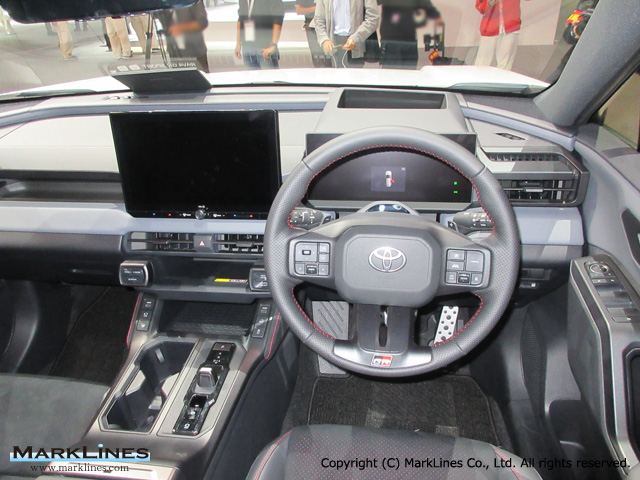
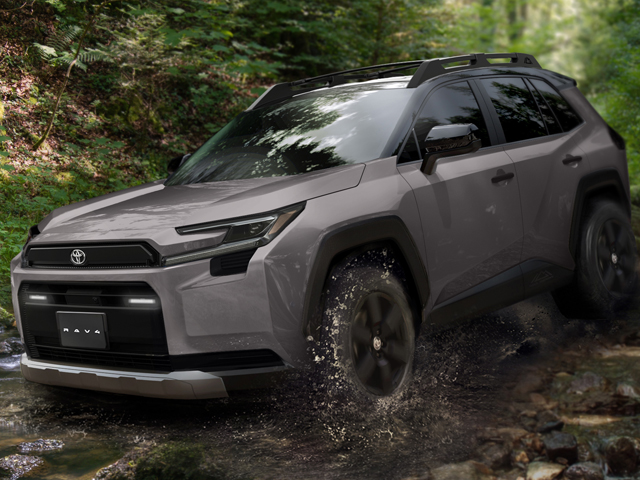
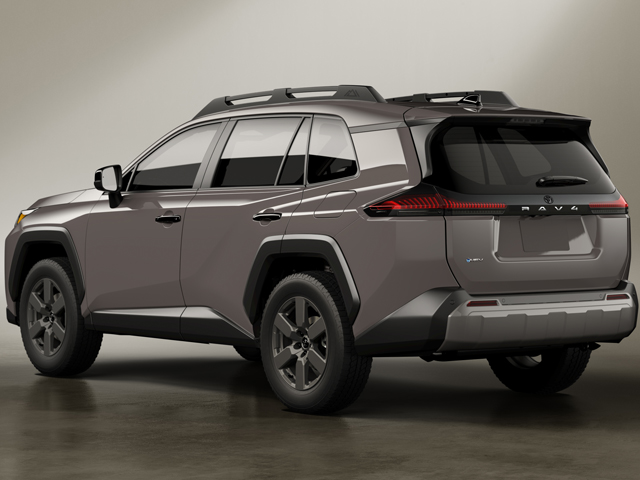
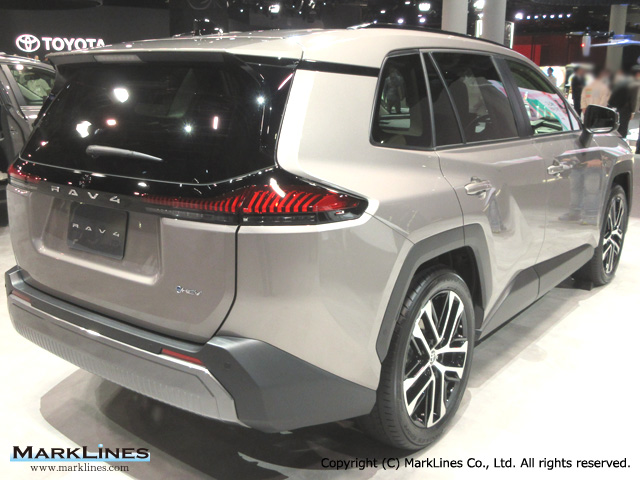
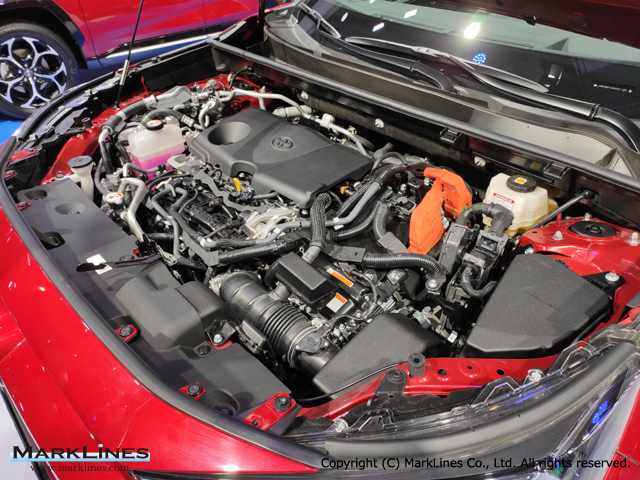
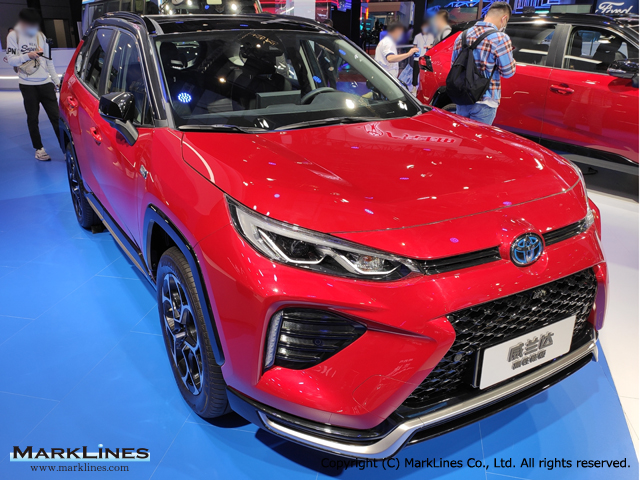
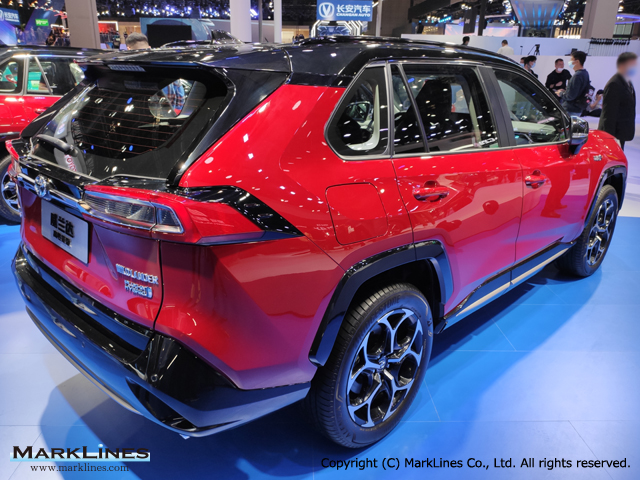
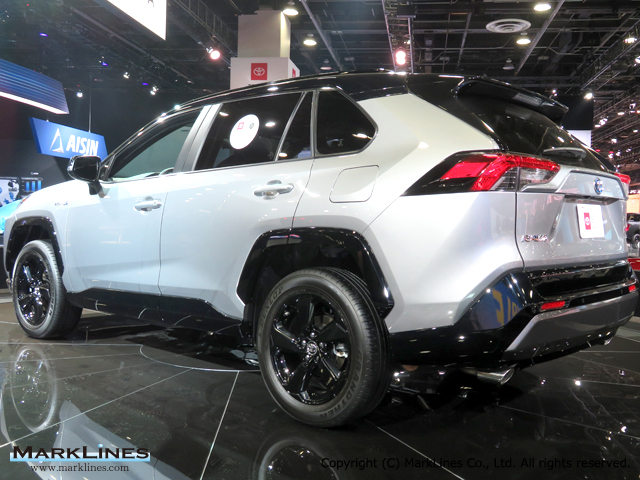
RAV4 PHEV
 3
3
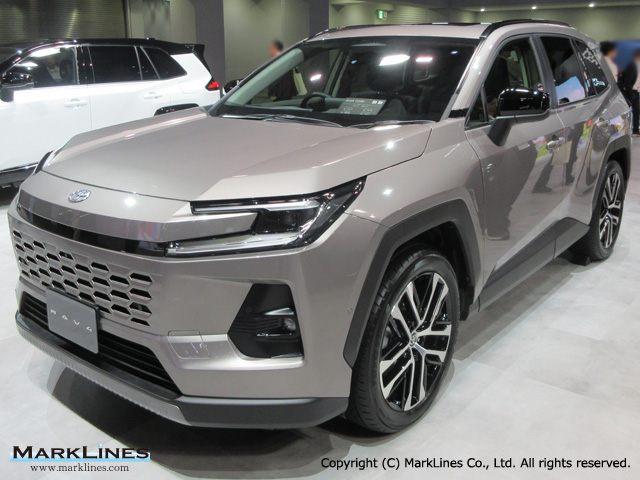
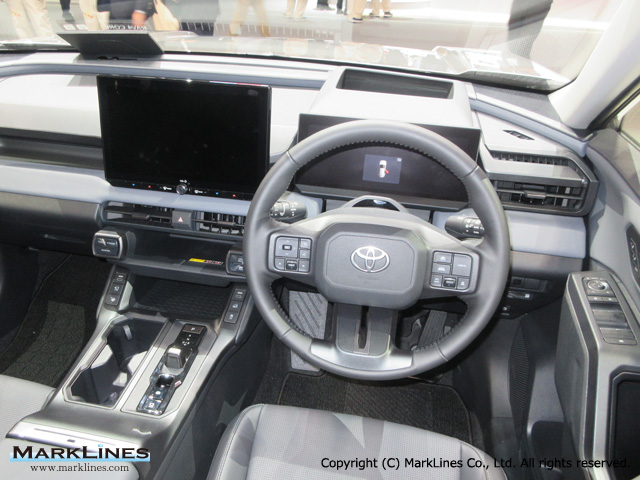
RAV4/Wildlander HEV
 6
6
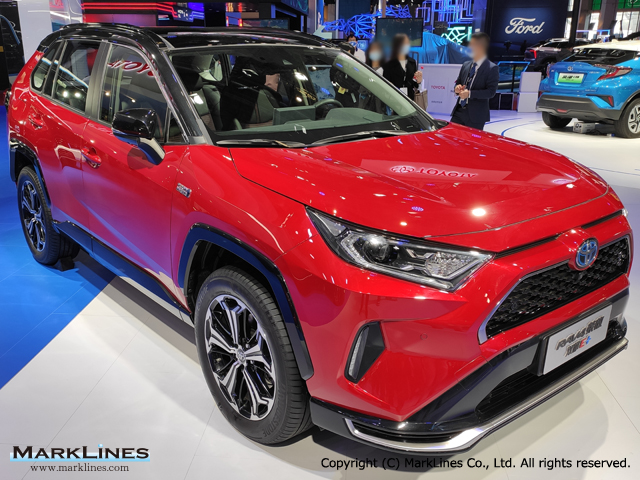
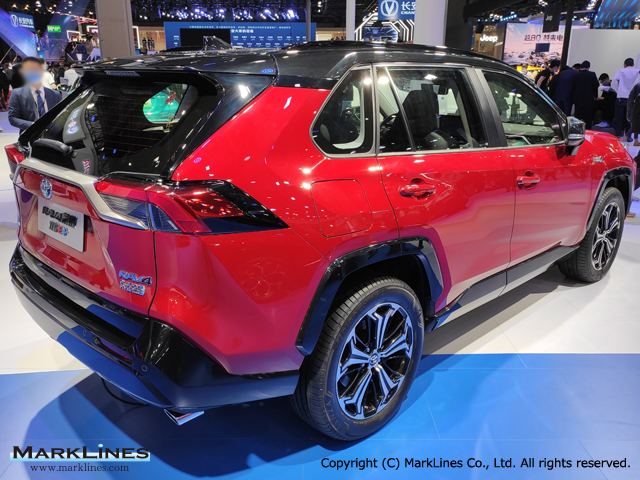
RAV4/Wildlander PHEV (Previous Model)
 3
3
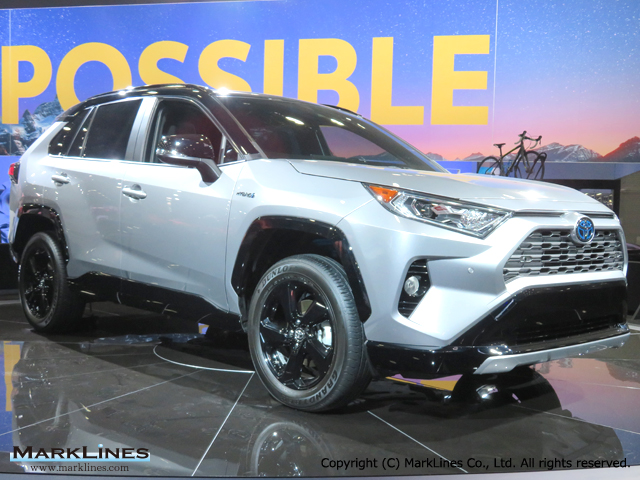
RAV4/Wildlander HEV (Previous Model)
 2
2
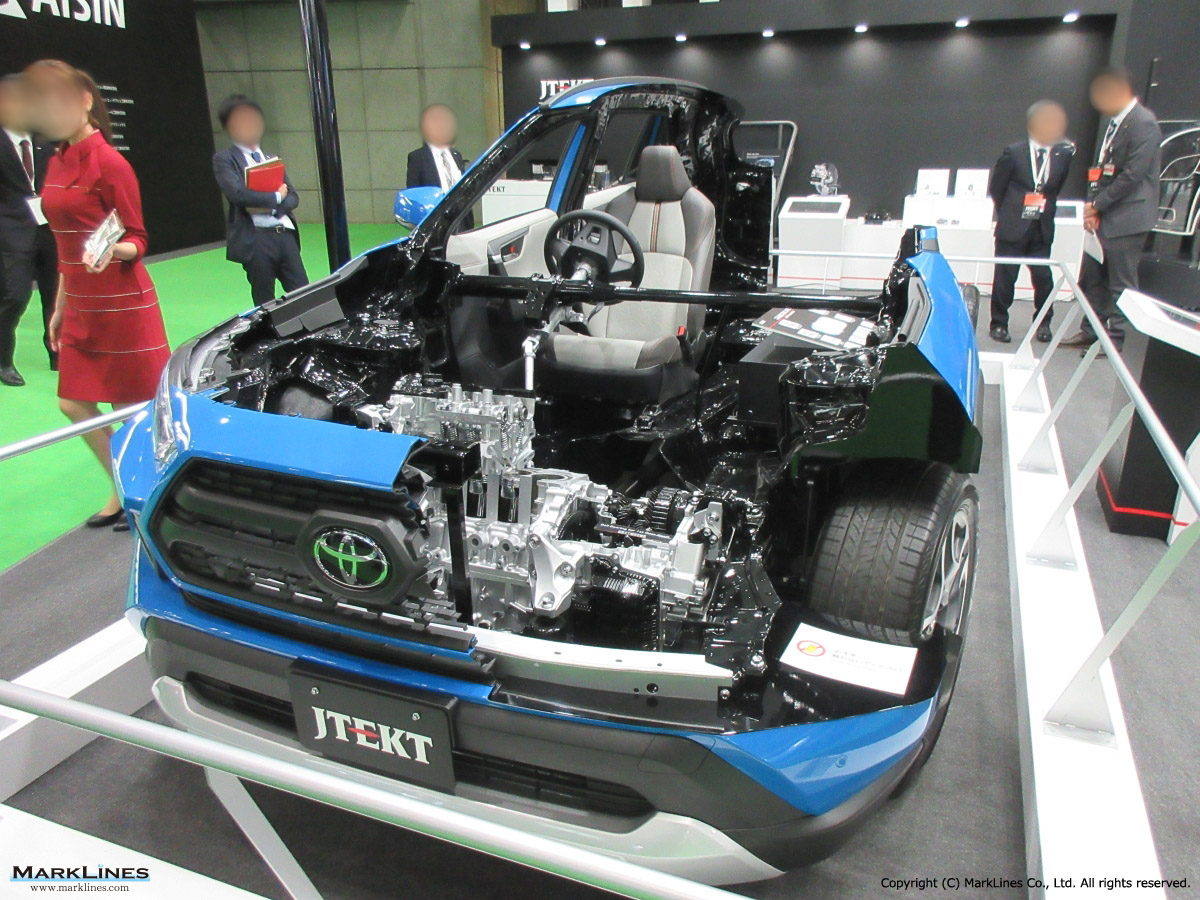
Toyota RAV4 cutaway model
 1
1
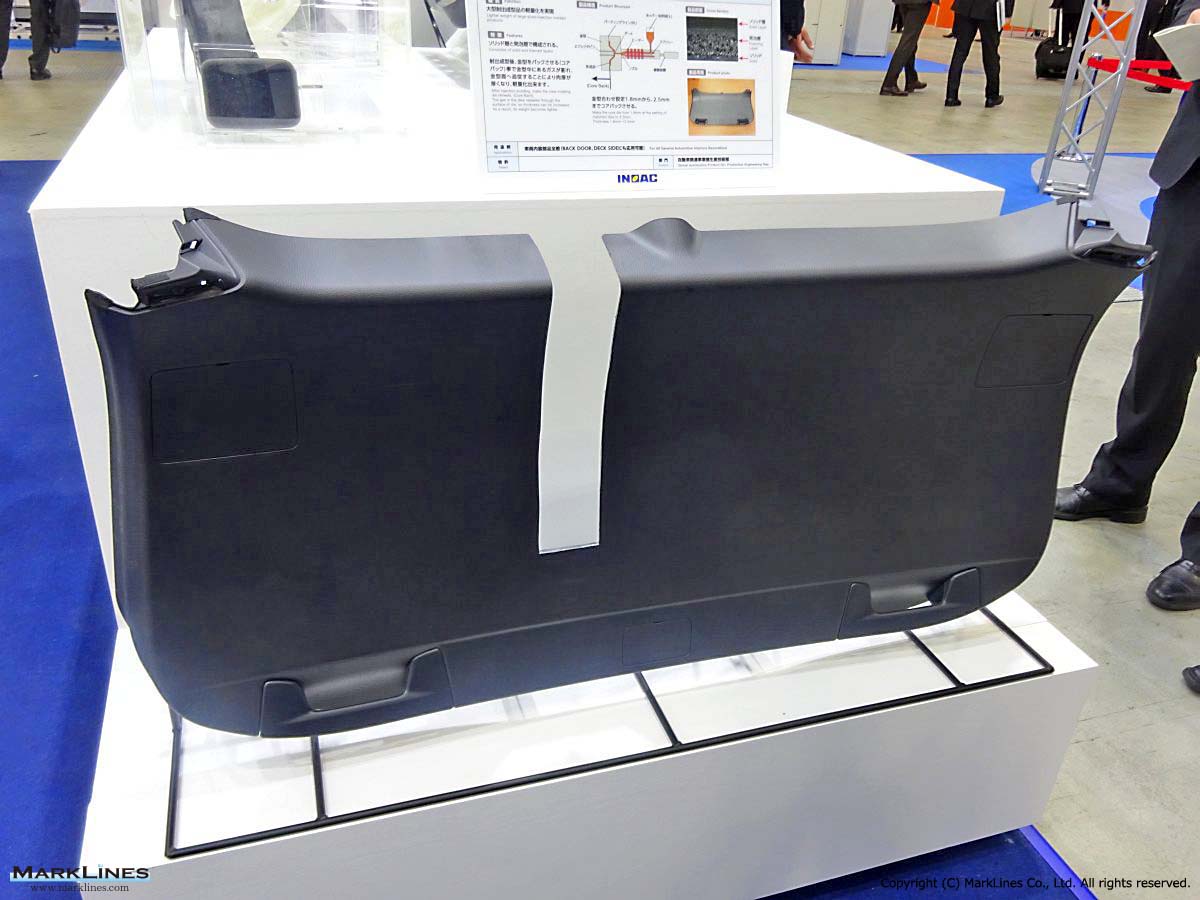
Back door decoration
 1
1
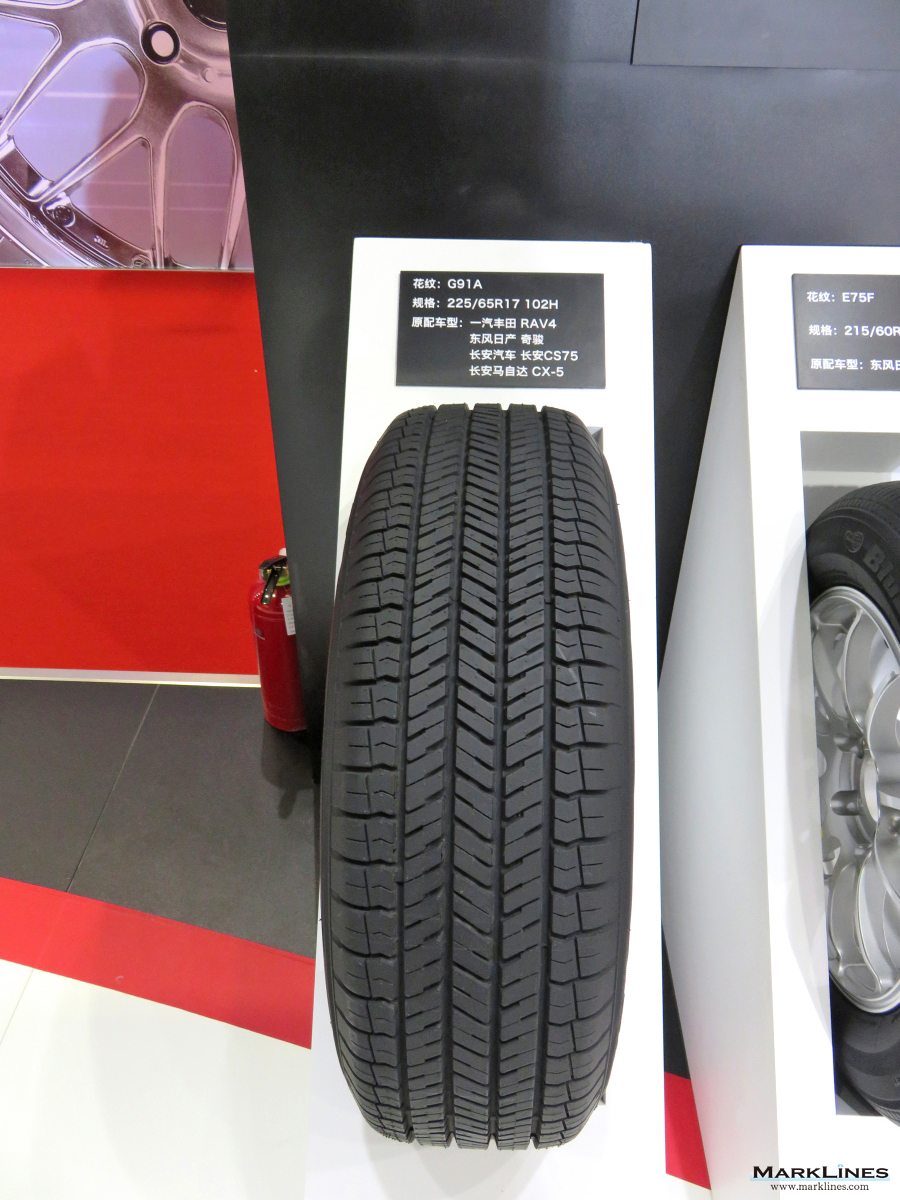
Tire
 1
1
Head Restraint
 1
1
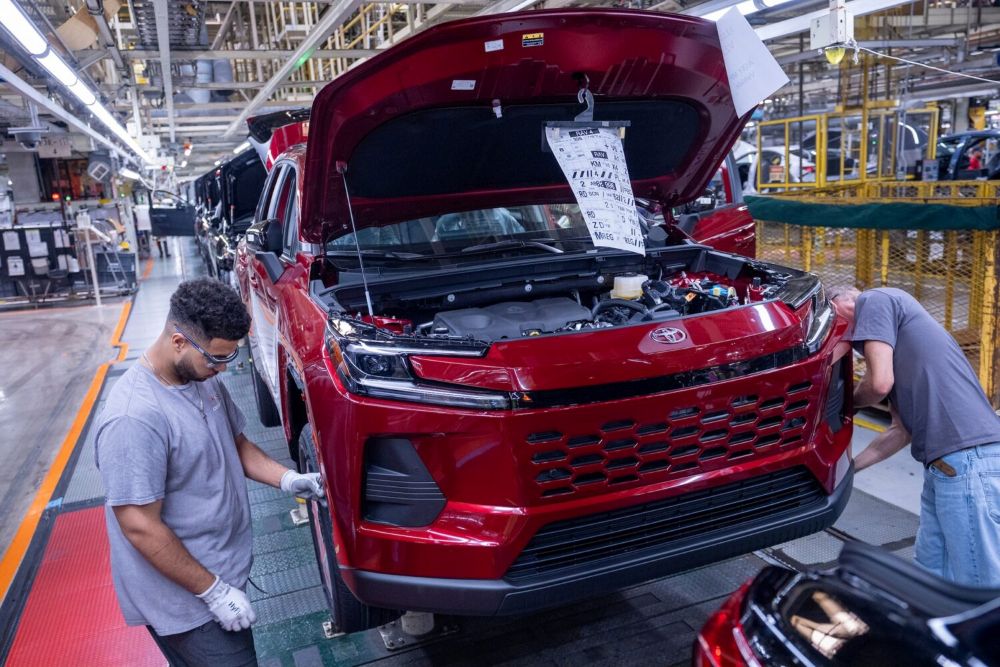
Toyota Georgetown plant starts production of new RAV4 Hybrid, prepares new paint facility
Sort by :
1 - 20 of 29 results
USA - New car sales in 2026 by OEM, model, vehicle type
nds such as Dodge (93 days), Ram (90 days), Jeep (88 days). Among Japanese brands, Acura was at 76 days, while Volkswagen (VW) led among European brands at 78 days.Lower inventory levels were observed for Cadillac (33 days) among U.S. brands. Among Japanese brands, Honda (33 days), Lexus (25 days), Toyota (20 days) and Mitsubishi (11 days) had relatively tight supply.Other brands recorded the following: Buick and Ford (63 days), GMC (61 days), Li...
Automotive Sales Data Updated at: 2026/07/10
Australia - New car sales in 2026 by OEM, vehicle type
re are cases where recently released data and detailed information in the database do not match up for reasons including different information sources, and discrepancies between preliminary reports and confirmed data. Australian new vehicle sales increase 7.0% in June; BYD surges 130%, closes in on ToyotaOn July 3, the Federal Chamber of Automotive Industries announced that new vehicle registrations of 131,134 units in June 2026 represented a 7.0...
Automotive Sales Data Updated at: 2026/07/06
Data changes for Sales Statistics
s been updated to the number by OEM. February 5, 2026 Japan This reflects Tesla's estimated sales going back to 2021. Monthly sales totals remain unchanged. February 3, 2026 Hungary The data for Hungary in the period July - December 2025 has been revised. January 30, 2026 USA Sales figures of Toyota, Porsche, Stellantis in 2025 have been updated. December 28, 2026 China Data for certain Bestune/Besturn models have been retrospectively rev...
Automotive Sales Data Updated at: 2026/06/29
Representative models for each segment
10, Kia Morning BYD Seagull, Wuling Hongguang MINIEV, Changan Lumin Honda N-BOX, Suzuki Spacia, Daihatsu Tanto Suzuki Wagon R, Perodua Axia, Fiat Mobi B (Small) Chevrolet Aveo, Kia Soul, Nissan March (Micra) Renault Clio, Dacia Sandero, Peugeot 208 Geely Xingyuan, BYD Dolphin, Wuling Bingo/Binguo Toyota ROOMY, Suzuki Solio/Wagon R+, Nissan Note Suzuki Swift, VW Polo, Fiat Argo C (Lower Medium) Toyota Corolla, Honda Civic, Nissan Sentra VW Gol...
Automotive Sales Data Updated at: 2026/03/10
Australia - New car sales in 2025 by OEM, vehicle type
of 2025, passenger car sales of 157,484 units represented a 22.6% decrease from the last year, SUV sales of 733,831 units represented a 5.5% increase, LCV sales of 273,229 units represented a 1.0% increase and MHCV sales of 45,264 units represented a 11.6% decrease.Among the companies, in December, Toyota sales decreased 0.6% to 18,541 units, Ford sales increased 2.8% to 8,541 units, Mazda sales increased 4.2% to 7,562 units, Kia sales decreased ...
Automotive Sales Data Updated at: 2026/02/04
USA - New car sales in 2025 by OEM, model, vehicle type
r inventory were Lincoln (101 days), Jeep (86 days), Ram (82 days), Ford (79 days), and GMC (67 days). Among Japanese brands, Acura (68 days) and Nissan (66 days). Among European brands, VW (79 days). Among US brands with lower inventory were Dodge (37 days). Among Japanese brands, Lexus (32 days), Toyota (30 days), and Mitsubishi (26 days). Among European brands, Mercedes-Benz (36 days), Volvo (30 days), and BMW (29 days). Among Korean brands, K...
Automotive Sales Data Updated at: 2026/02/04
Volume data search results
HV/PHV/FCV models (A+B) are only available for several countries (USA, Sweden etc.) Please refer to the chart below for the data availability for each country. A models EV/HV/PHV/FCV models that does NOT share a model name with a standard petrol or diesel car. Ex: Tesla Model Y, Hyundai IONIQ5, Toyota MIRAI. B models EV/HV/PHV/FCV models that share a model name with a standard petrol or diesel car. Ex: Toyota RAV4 PHV, VW Tiguan PHV, BMW 2...
Automotive Sales Data Updated at: 2025/12/09
USA - New car sales in 2024 by OEM, model, vehicle type
to the U.S. media on January 3, total inventory at the end of November was 3.15 million units (89 days of inventory), while Fiat, Lincoln, Buick, and Jeep were overstocked by brand with 123, 118, 100, and 99 days of inventory, respectively, at the end of November. Meanwhile, among Japanese brands, Toyota had 27 days, Lexus 24 days, Honda 55 days, Acura 71 days, Nissan 66 days, Infiniti 68 days, Subaru 37 days, Mazda 51 days, and Mitsubishi 39 da...
Automotive Sales Data Updated at: 2025/07/03
Australia - New car sales in 2024 by OEM, vehicle type
rall consumer preferences remain clear with SUVs and Light Commercial vehicles continuing to dominate the market. This will prove to be a significant challenge in meeting the extremely ambitious targets of the New Vehicle Efficiency Standard (NVES) which began on 1 January 2025.Among the companies, Toyota sales increased 12.1% YoY to 241,296 units, Ford sales increased 14.1% to 100,170 units, Mazda sales decreased 4.0% to 95,987 units, Kia sales ...
Automotive Sales Data Updated at: 2025/07/02
Australia - Flash report, Automotive sales volume, 2023
19,545 31.2% 274,185 256,382 6.9% Heavy Commercial Vehicles 4,385 4,339 1.1% 51,772 47,359 9.3% Total 98,544 87,920 12.1% 1,216,780 1,081,429 12.5% Top 10 best selling Makers/Brands - Maker/Brand 2023 2022 Y-o-Y 2023 2022 Y-o-Y Dec. Share Dec. Share Jan.-Dec. Share Jan.-Dec. Share 1 Toyota 19,281 19.6% 16,274 18.5% 18.5% 215,240 17.7% 231,050 21.4% -6.8% 2 Mazda 6,765 6.9% 8,500 9.7% -20.4% 100,008 8.2% 95,718 8.9% 4.5% 3 Ford...
Automotive Sales Data Updated at: 2025/06/04
USA - Flash report, Automotive sales volume, 2023
ales were up 7.5%, and Stellantis sales were up 10.7% compared to December 2022.For all of 2023, GM sales were up 14.1%, Ford sales were up 7.0%, and Stellantis sales were down 1.2% compared to 2022.Tesla sales were up 25.7% in December to 56,481 units, and up 25.4% for all of 2023 to 654,888 units.Toyota sales were up 24.2%, Nissan sales were up 12.9%, Honda sales were up 31.5%, Mazda sales were up 44.8%, and Subaru sales were up 1.8% compared t...
Automotive Sales Data Updated at: 2025/06/04
Australia - Flash report, Automotive sales volume, 2022
an 9.3% increase.FCAI Chief Executive Tony Weber said the pathway through COVID recovery, microprocessor shortages and bottlenecks due to global shipping issues had created great challenges for car makers and their dealer networks in 2022.The best-selling cars in 2022, in order of popularity, were Toyota Hi-Lux, Ford Ranger and Toyota RAV4. New vehicle sales by type Type Dec. 2022 Dec. 2021 Y-o-Y Jan.-Dec. 2022 Jan.-Dec. 2021 Y-o-Y Passenge...
Automotive Sales Data Updated at: 2025/06/04
USA - Flash report, Automotive sales volume, 2022
were up 3.3%, and Stellantis sales were down 19.5% compared to December 2021.For all of 2022, GM sales were up 2.5%, Ford sales were down 2.2%, and Stellantis sales were down 13.0% compared to 2021.Tesla sales were down 4.9% in December to 44,923 units, and up 48.2% for all of 2022 to 552,444 units.Toyota sales were up 4.1%, Nissan sales were down 16.5%, Honda sales were down 10.7%, and Subaru sales were up 11.0% compared to last December.For all...
Automotive Sales Data Updated at: 2025/06/04
USA - Flash report, Automotive sales volume, 2021
wn 17.2%, and Stellantis sales were down 23.1% compared to December 2020.For all of 2021, GM sales were down 13.1% and Ford sales were down 7.0%, and Stellantis sales were down 2.2% compared to 2020.Tesla sales were up 75.3% in December to 47,253 units, and up 71.4% for all of 2021 to 352,471 units.Toyota sales were down 30.8%, Nissan sales were down 21.0%, Honda sales were down 23.0%, and Subaru sales were down 19.5% compared to last December.Fo...
Automotive Sales Data Updated at: 2025/06/04
China - Flash report, Automotive sales volume, 2021
ling models - Maker/Brand Model Dec. 2021 Dec. 2020 Y-o-Y Jan.- Dec. 2021 Jan.- Dec. 2020 Y-o-Y 1 Wuling Wuling Hongguang MINIEV 55,742 32,097 73.7% 426,482 126,603 236.9% 2 VW Lavida 35,905 36,369 -1.3% 391,362 417,324 -6.2% 3 Haval Haval H6 42,787 55,632 -23.1% 370,438 376,864 -1.7% 4 Toyota Corolla/New Corolla 31,200 32,826 -5.0% 323,242 350,310 -7.7% 5 Changan/Chana CS75 15,163 24,011 -36.8% 281,862 266,824 5.6% 6 Tesla Model ...
Automotive Sales Data Updated at: 2025/06/04
USA - Flash report, Sales volume, 2020
car sales were down 27.0% to 3,519,034 units for 2020.GM estimated sales in December were up 6.4%, Ford sales were down 3.9%, and FCA sales were up 5.9% compared to December 2019.For all of 2020, GM sales were down 11.9% and Ford sales were down 15.4%, and FCA sales were down 17.4% compared to 2019.Toyota sales were up 21.2%, Nissan sales were down 5.9%, Honda sales were down 0.1%, and Subaru sales were up 1.9% compared to last December.For all o...
Automotive Sales Data Updated at: 2025/06/04
USA - Flash report, Sales volume, 2019
units, compared to 17.44 million units one year ago.GM estimated sales in December were down 6.4%, Ford sales were down 1.5%, and FCA sales were down 2.8% compared to December 2018.For all of 2019, GM sales were down 2.5% and Ford sales were down 3.2%, and FCA sales were down 1.4% compared to 2018.Toyota sales were down 6.1%, Nissan sales were down 29.5%, Honda sales were down 12.0%, and Subaru sales were down 3.4% compared to last December.For ...
Automotive Sales Data Updated at: 2020/01/21
China - Flash report, Sales volume, 2018
Dec. 2018 Jan.- Dec. 2017 Y-o-Y 1 Nissan Bluebird Sylphy/Sylphy 56,339 44,141 27.6% 481,216 405,854 18.6% 2 Wuling Wuling Hongguang 59,673 63,590 -6.2% 476,537 533,950 -10.8% 3 VW Lavida 40,320 44,703 -9.8% 468,792 457,114 2.6% 4 Haval Haval H6 50,303 55,126 -8.7% 452,552 506,362 -10.6% 5 Toyota Corolla/New Corolla 27,755 19,406 43.0% 376,077 336,018 11.9% 6 Baojun Baojun 510 28,523 54,050 -47.2% 361,403 363,949 -0.7% 7 VW Jetta 36,...
Automotive Sales Data Updated at: 2019/01/31
USA - Flash report, Sales volume, 2018
ck and SUV sales for the full year were up 8.0% to 11,786,069 units, while passenger car sales were down 13.1% to 5,488,181 units for 2018.General Motors sales in December were down 3.7% and Ford sales were down 8.8%, while FCA sales were up 14.3% compared to December 2017.Among Japanese companies, Toyota sales were down 0.9%, Nissan sales were up 7.6%, Honda sales were up 3.9%, and Subaru sales were up 1.9% compared to last December.Kia sales in...
Automotive Sales Data Updated at: 2019/01/28
Russia - Flash report, Sales volume, 2017
n.-Dec. Share Lada 32,580 19.6% 27,630 19.0% 17.9% 311,588 19.5% 266,296 18.7% 17.0% Kia 13,211 8.0% 13,193 9.1% 0.1% 181,947 11.4% 149,567 10.5% 21.6% Hyundai 14,977 9.0% 14,047 9.6% 6.6% 157,858 9.9% 145,254 10.2% 8.7% Renault 14,555 8.8% 13,762 9.4% 5.8% 136,682 8.6% 117,225 8.2% 16.6% Toyota 10,885 6.6% 10,417 7.2% 4.5% 94,238 5.9% 94,568 6.6% -0.3% VW 10,366 6.2% 7,589 5.2% 36.6% 89,469 5.6% 74,221 5.2% 20.5% Nissan 8,499 5.1% ...
Automotive Sales Data Updated at: 2018/07/24


 Japan
Japan USA
USA Mexico
 Germany
 China (Shanghai)
 Thailand
 India
India