


Search Results by Category
All information related to {{ key_word }}.
AI Navigator will guide you. Click here for information about {{ key_word }}.
Images
 1
1
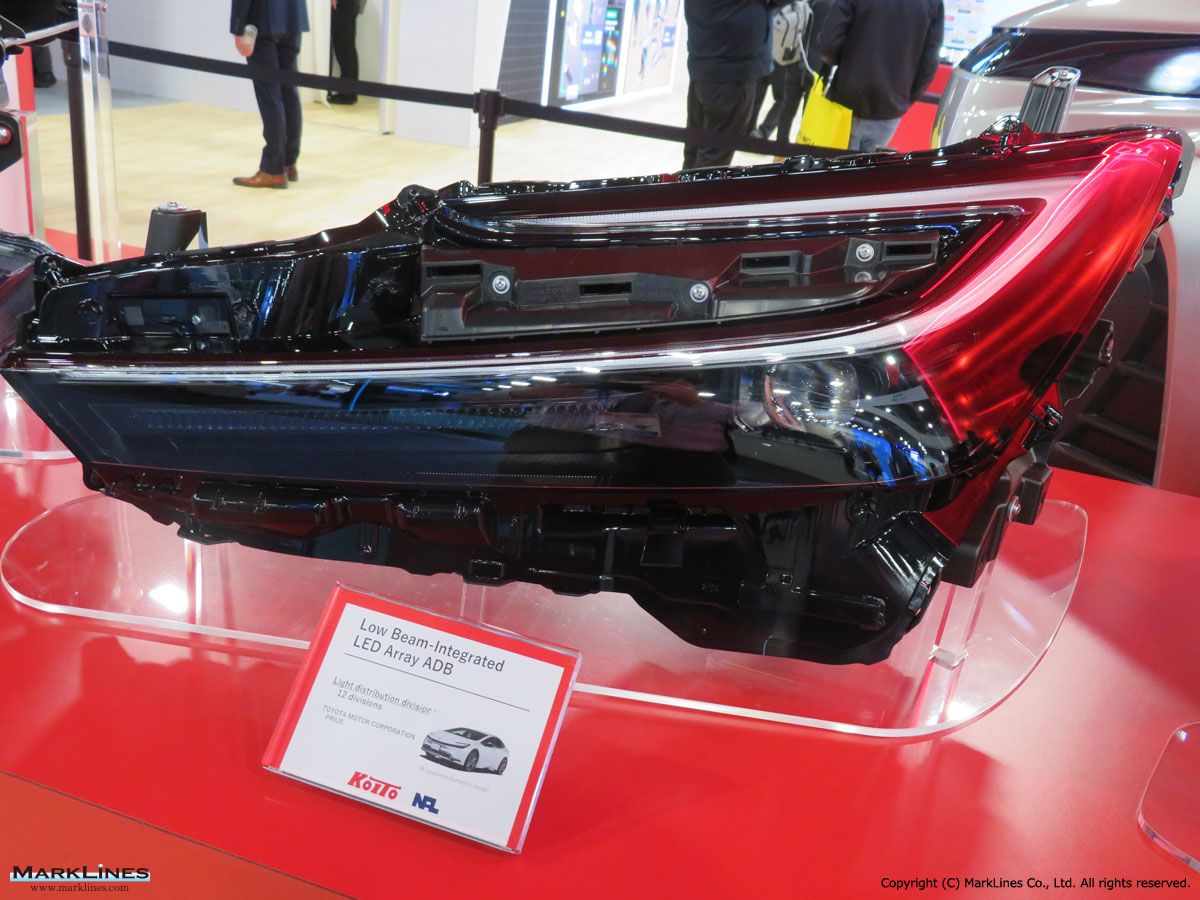
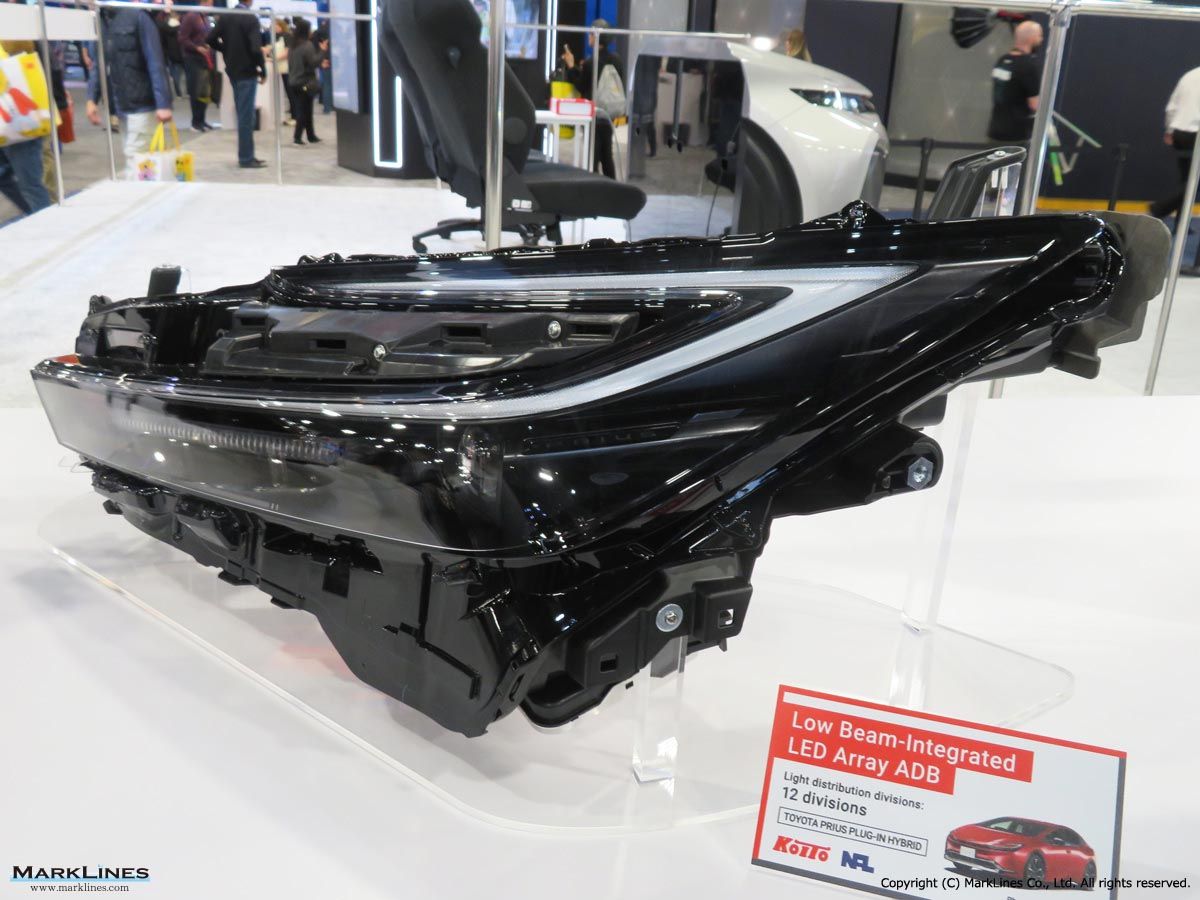
Low beam-integrated LED array ADB
 1
1
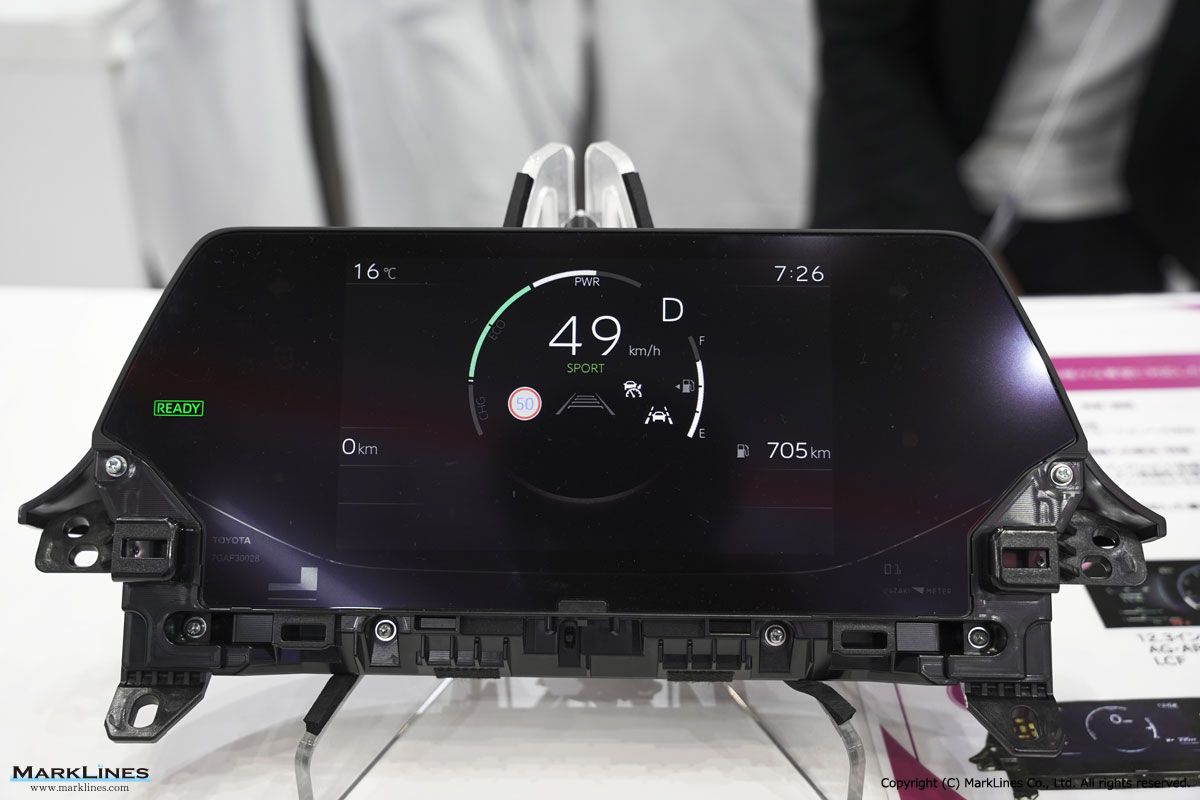
Meter (Toyota Prius)
 2
2
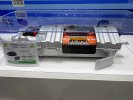
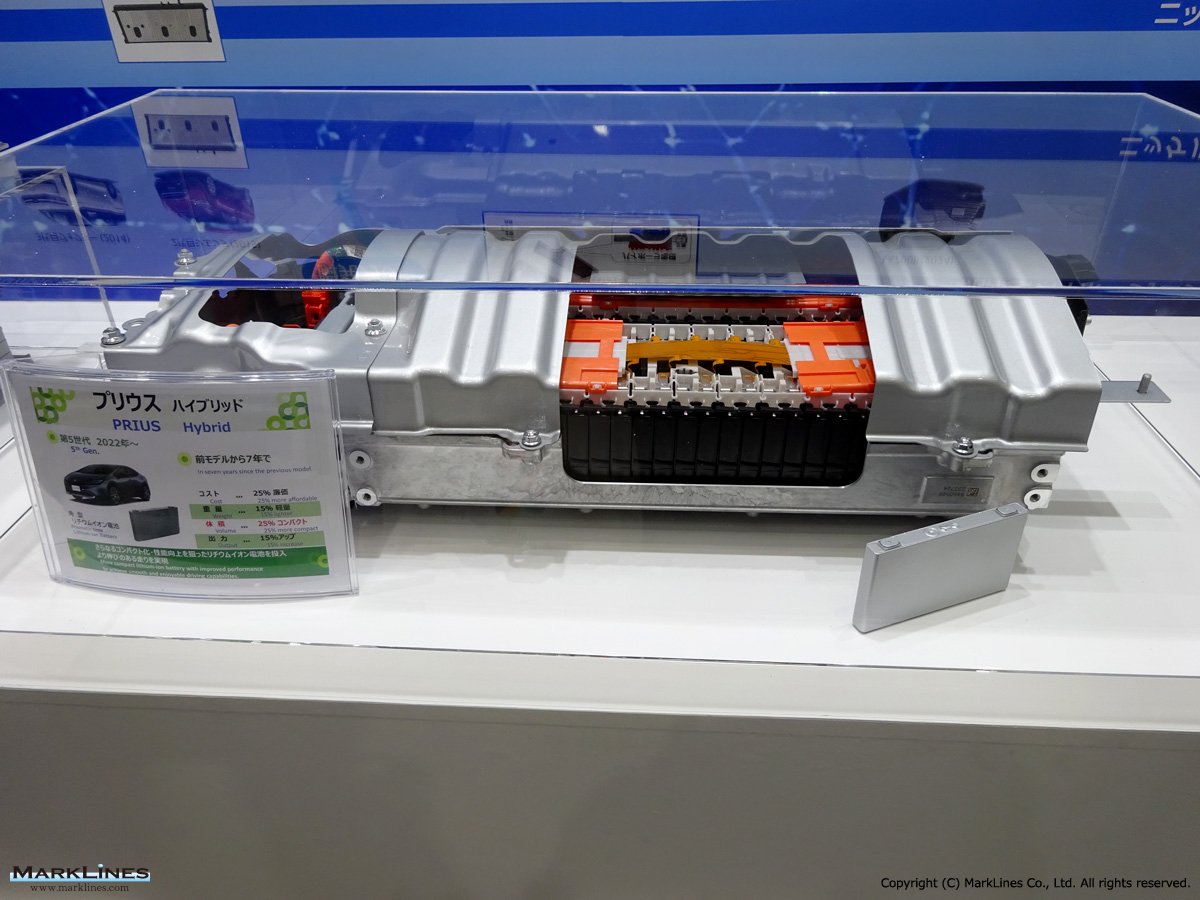
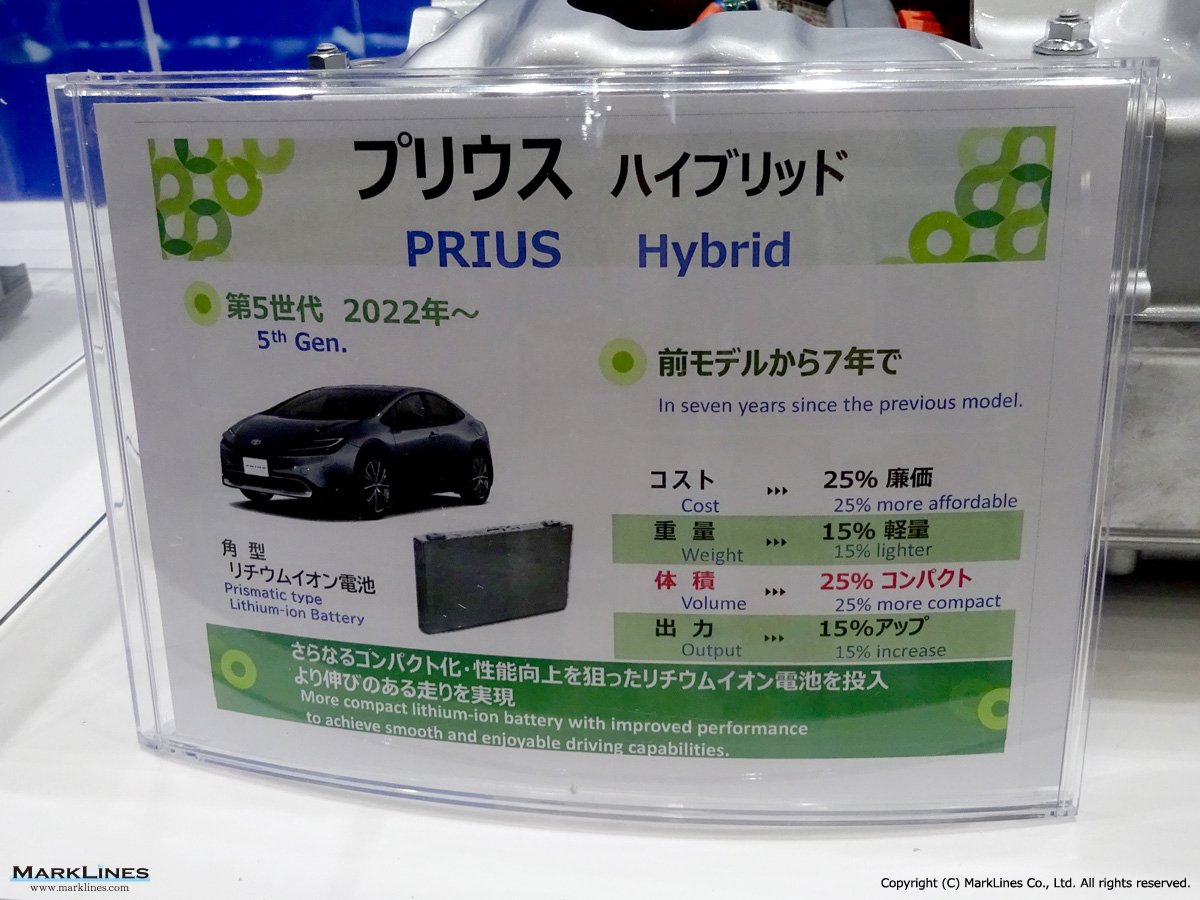
Current Toyota Prius hybrid battery module
 1
1
Low beam-integrated LED array ADB
 2
2
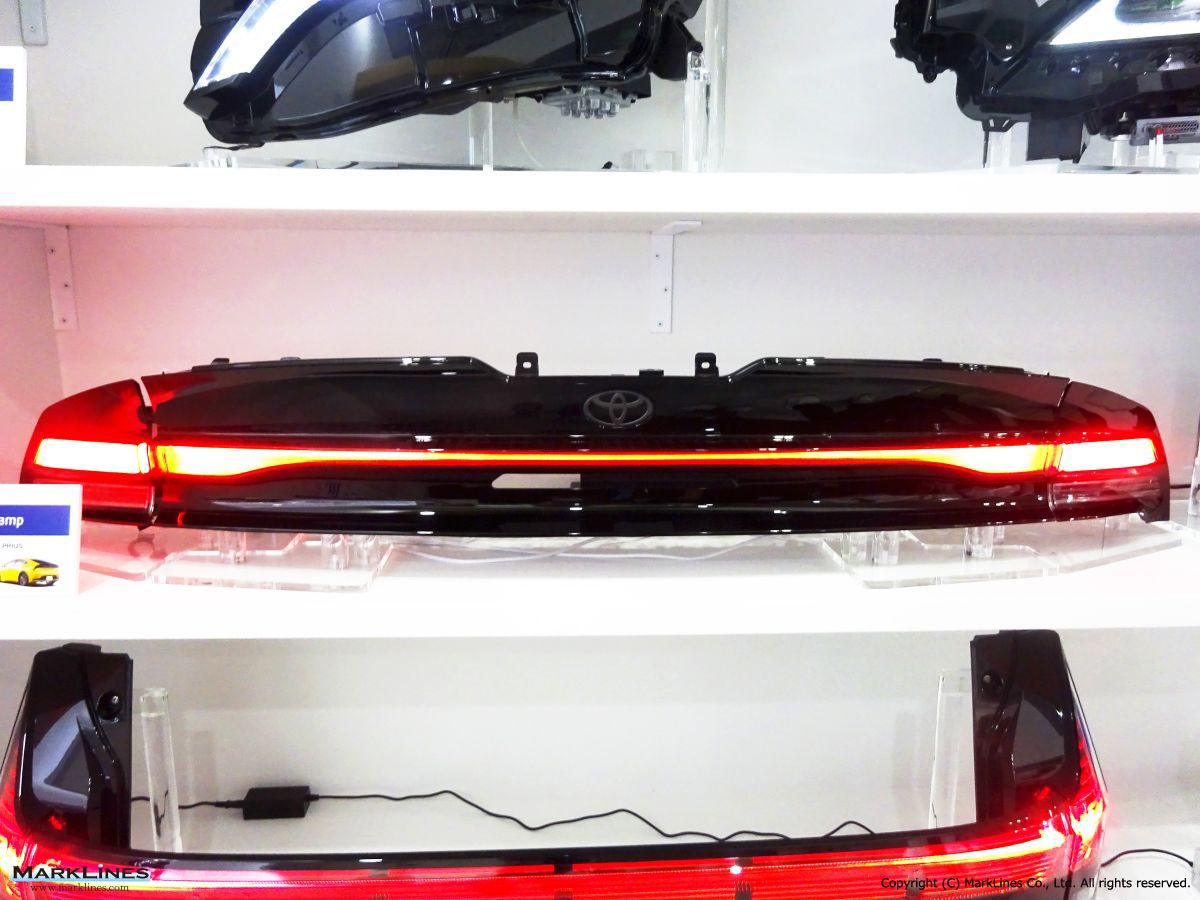
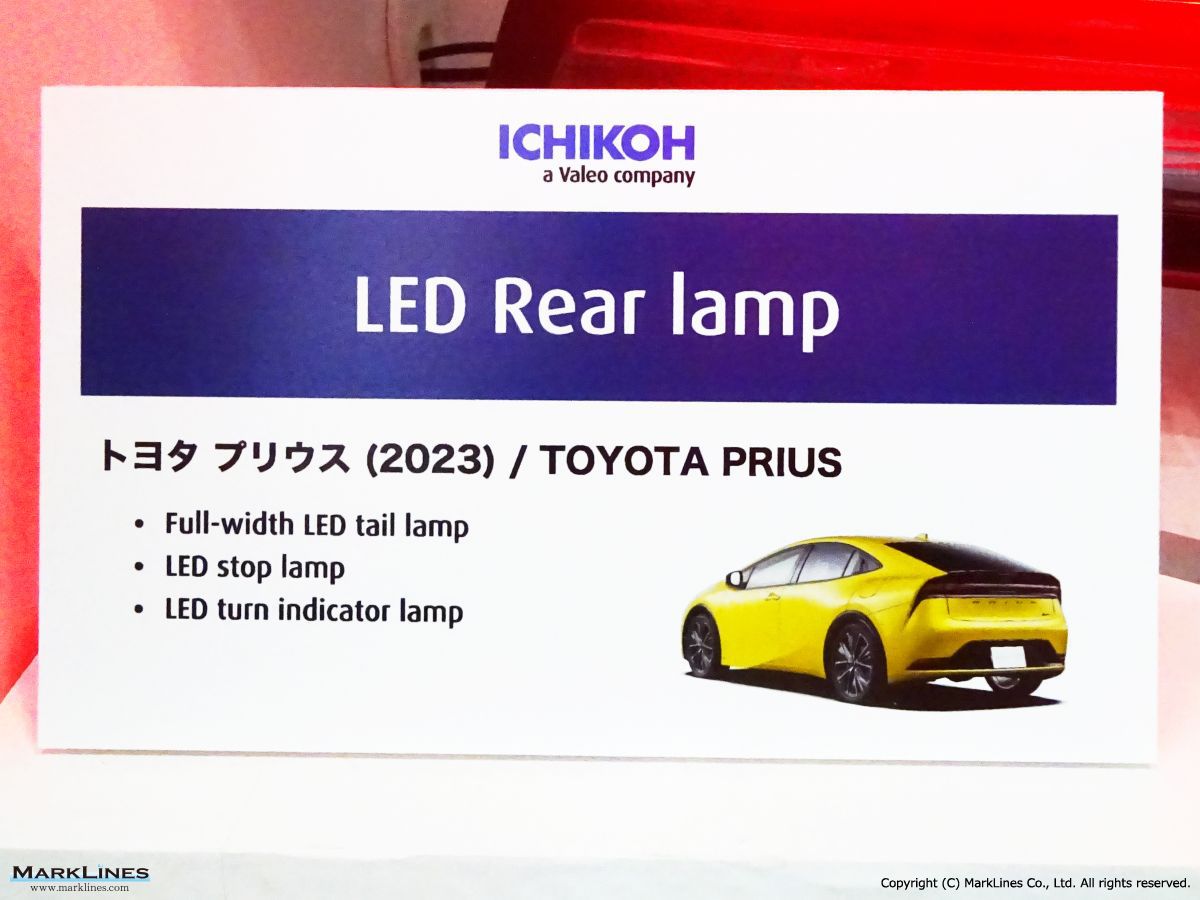
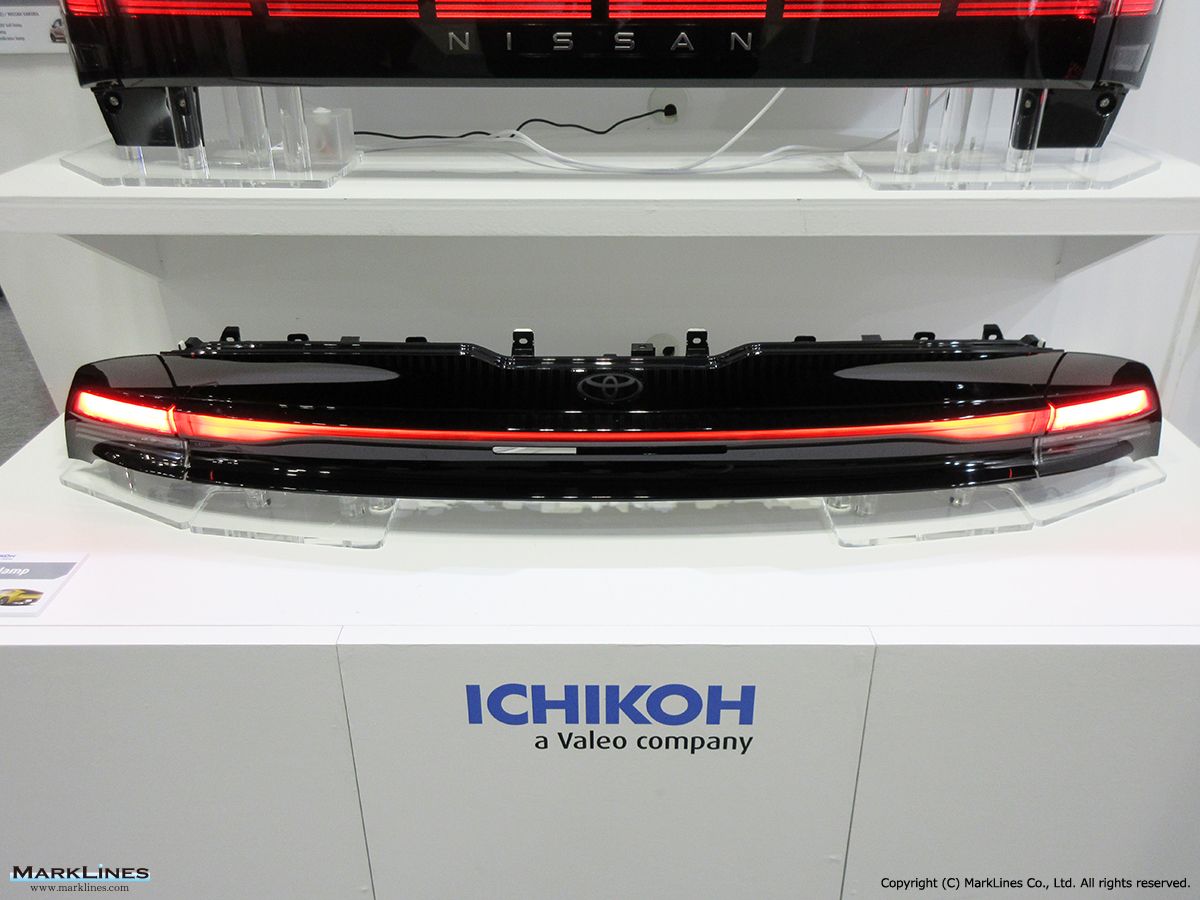
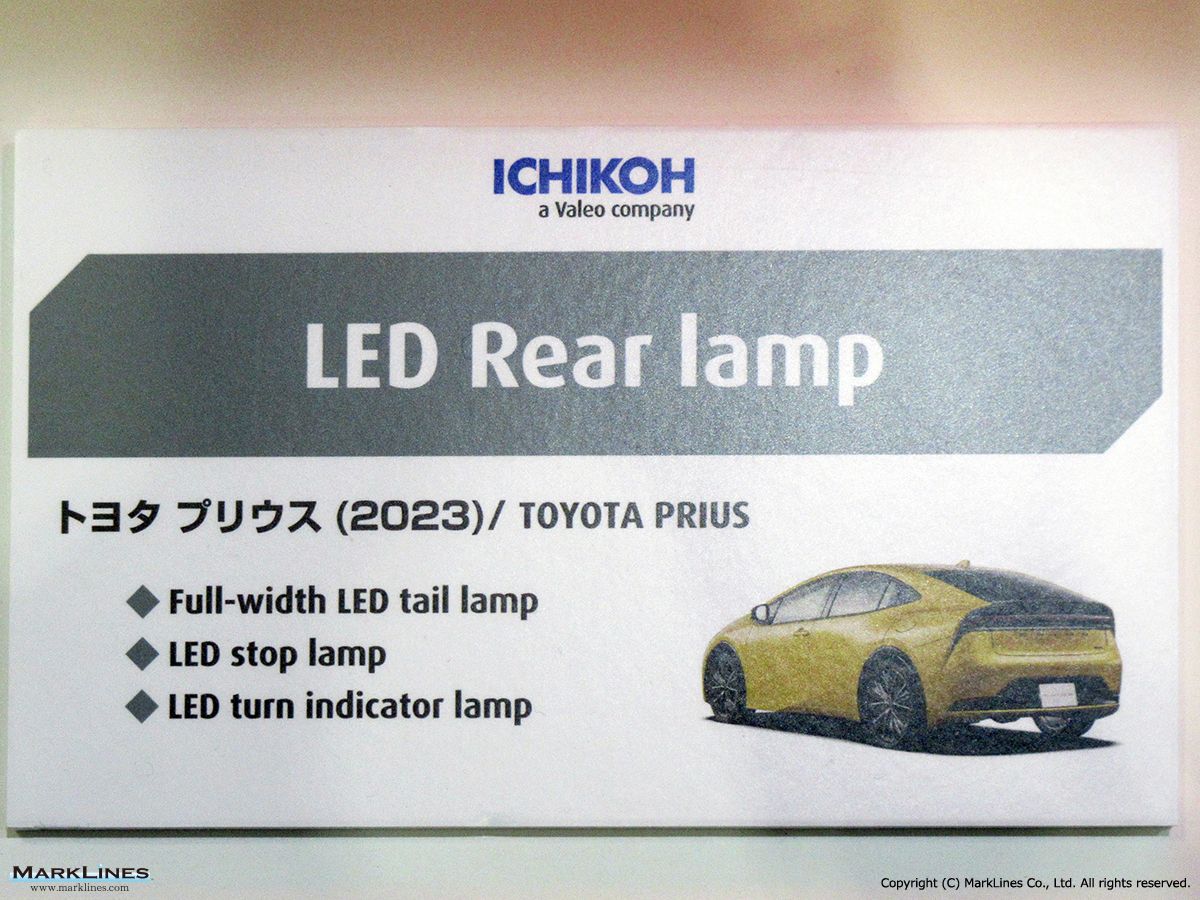
LED rear lamp
 4
4
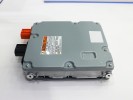
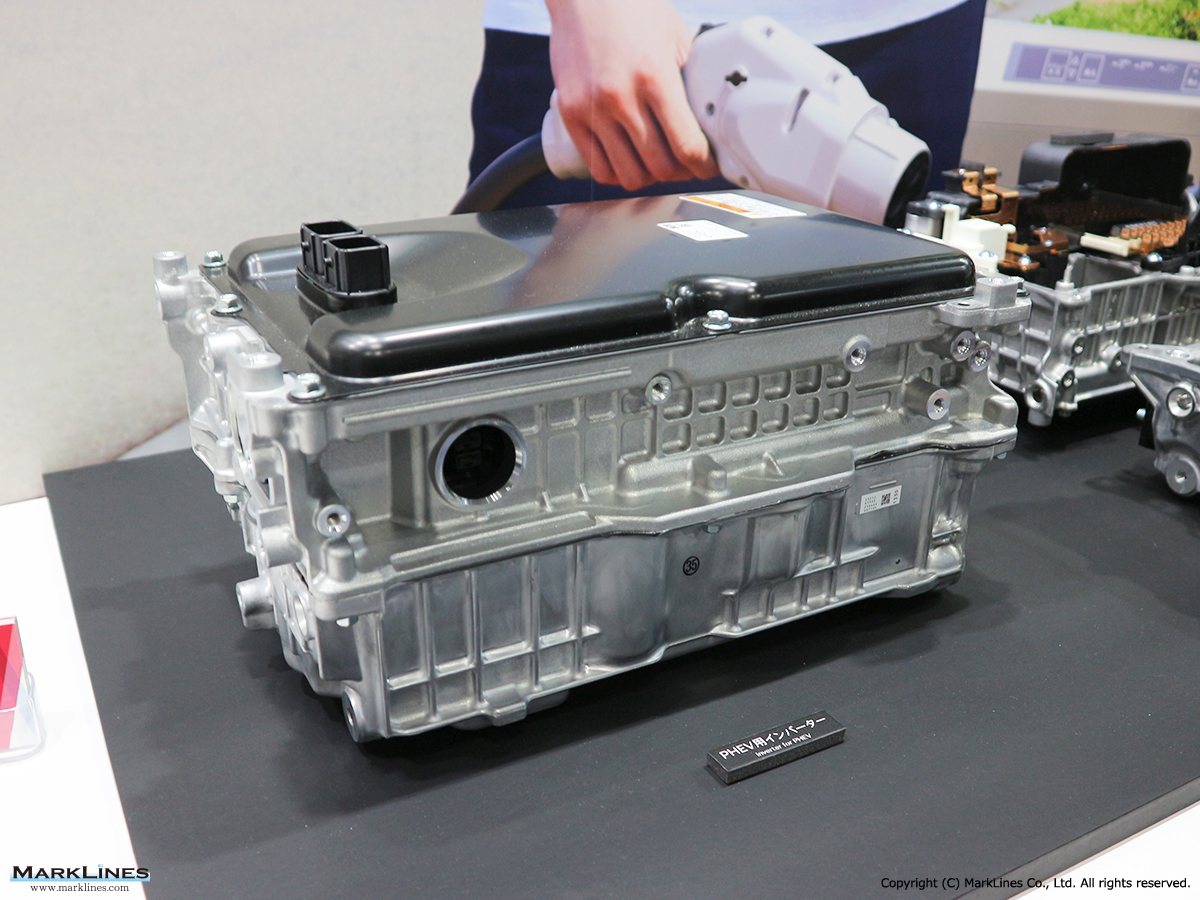
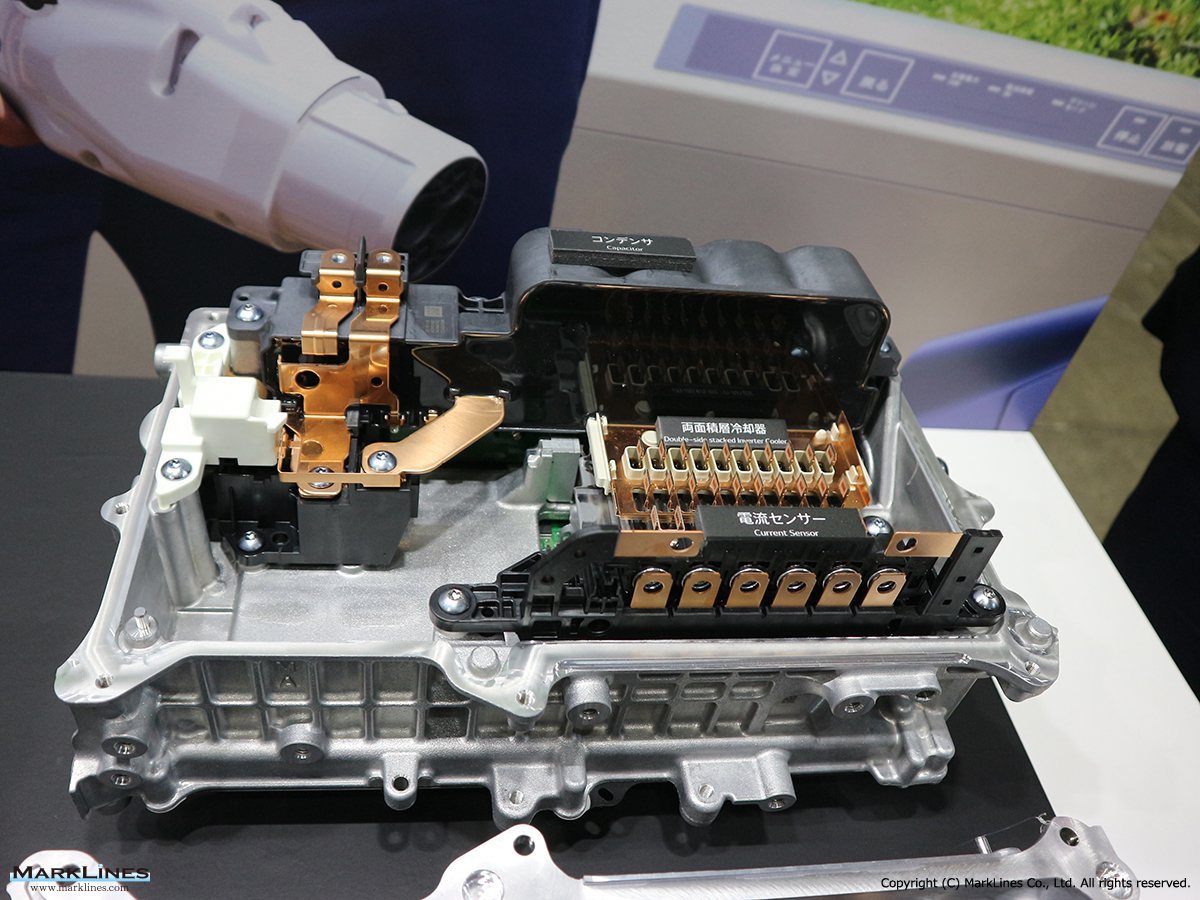
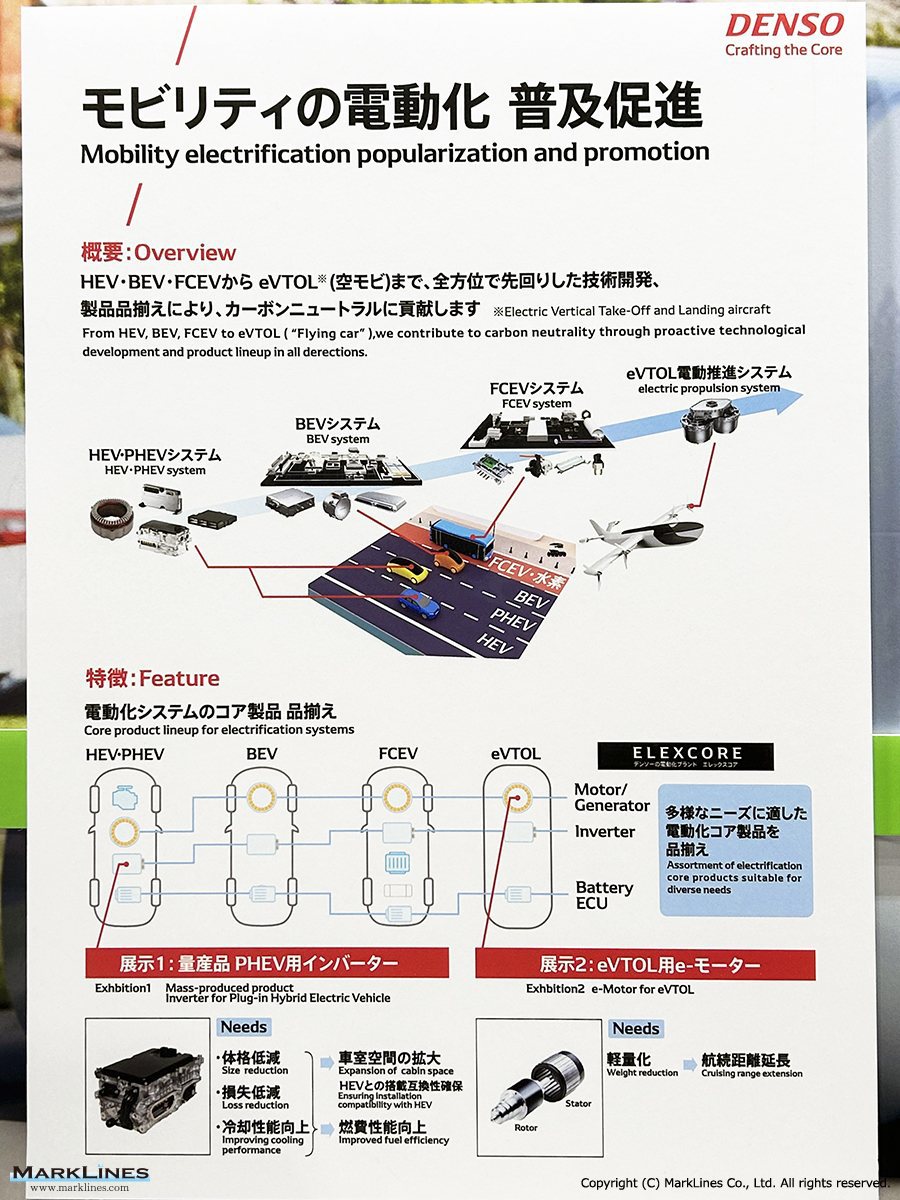
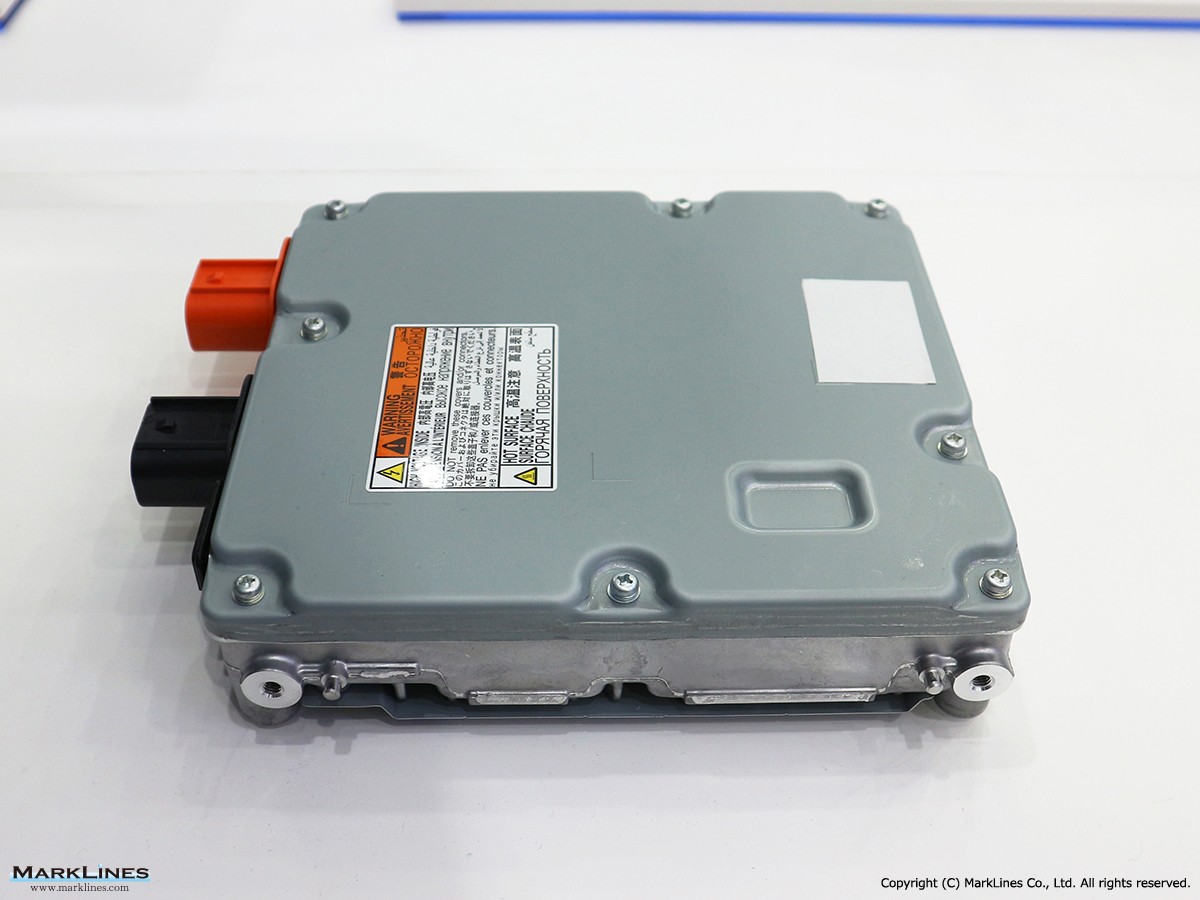
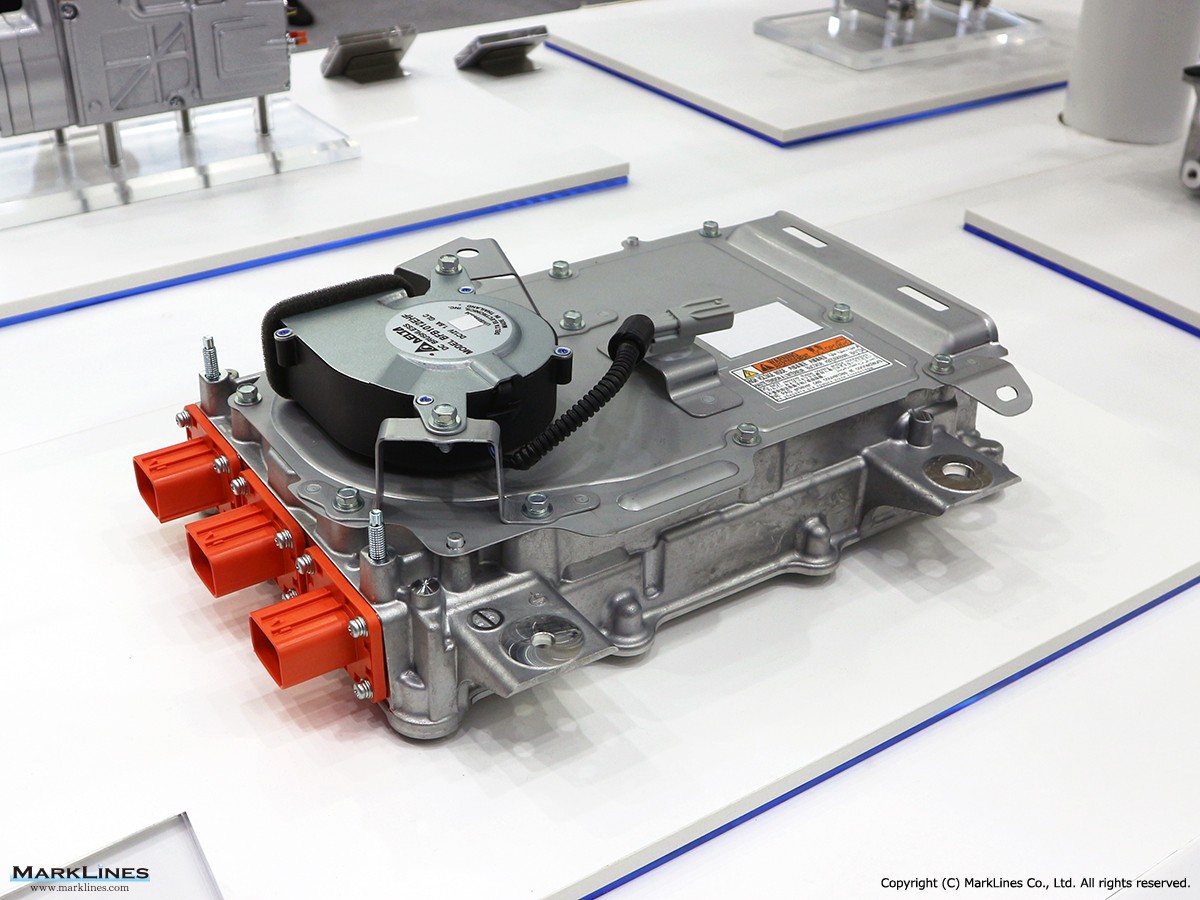
Inverter for PHV
 2
2
LED rear lamp
 2
2
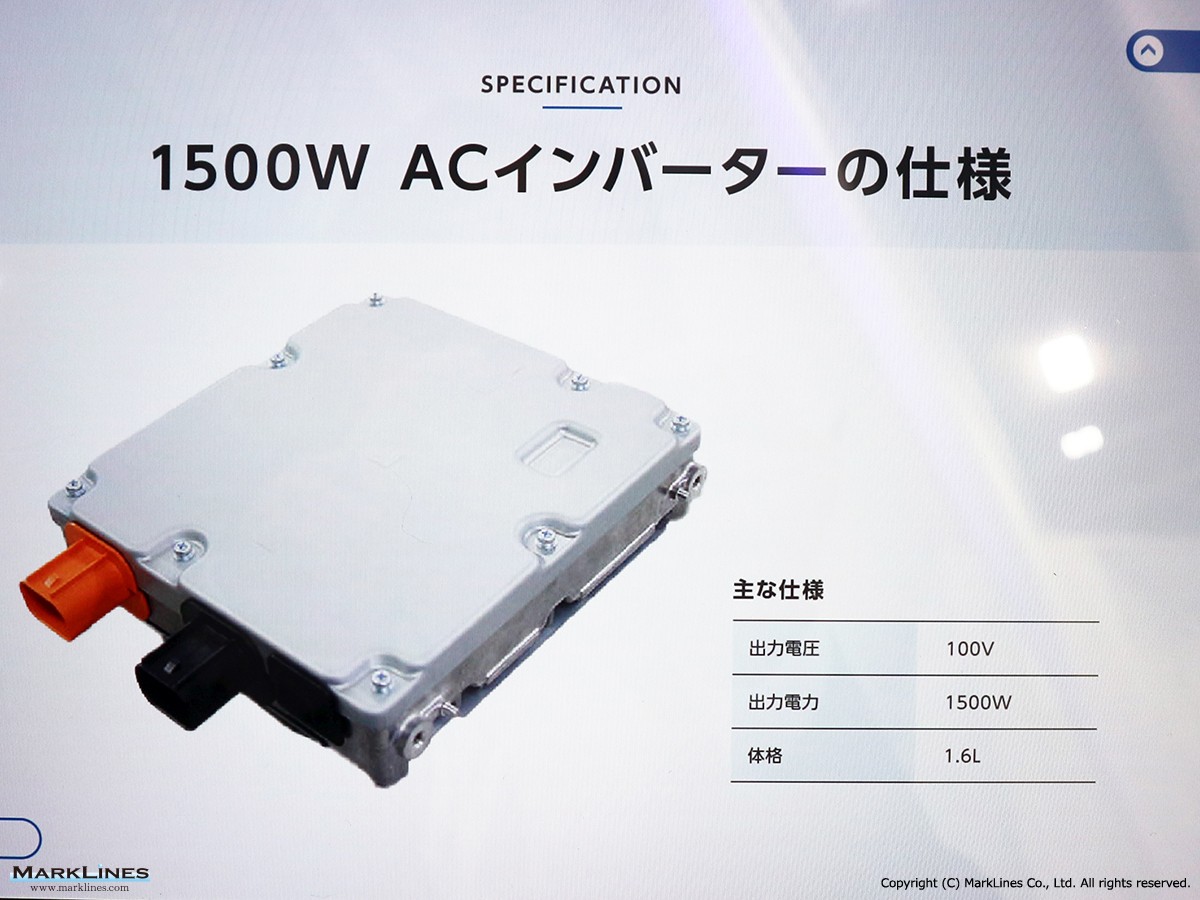
1500W AC inverter
 4
4
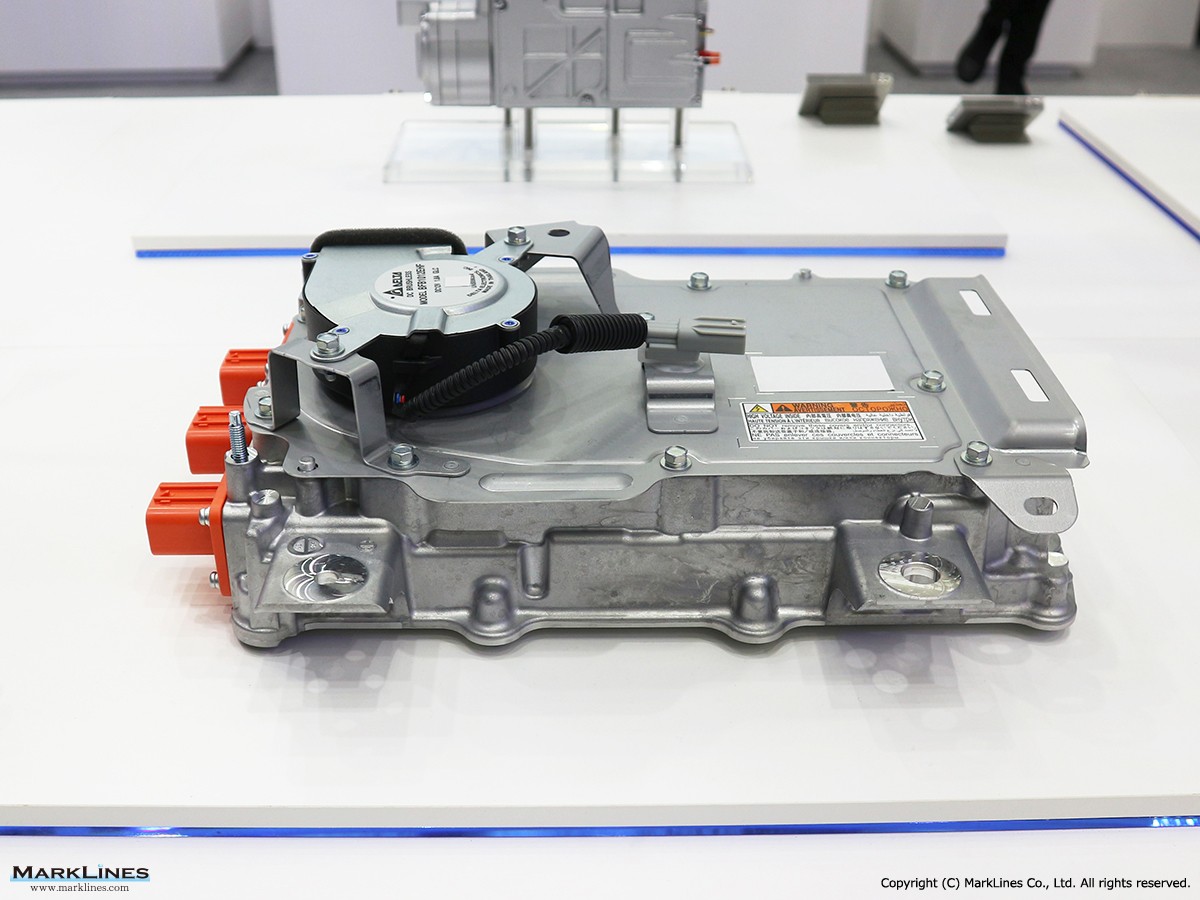
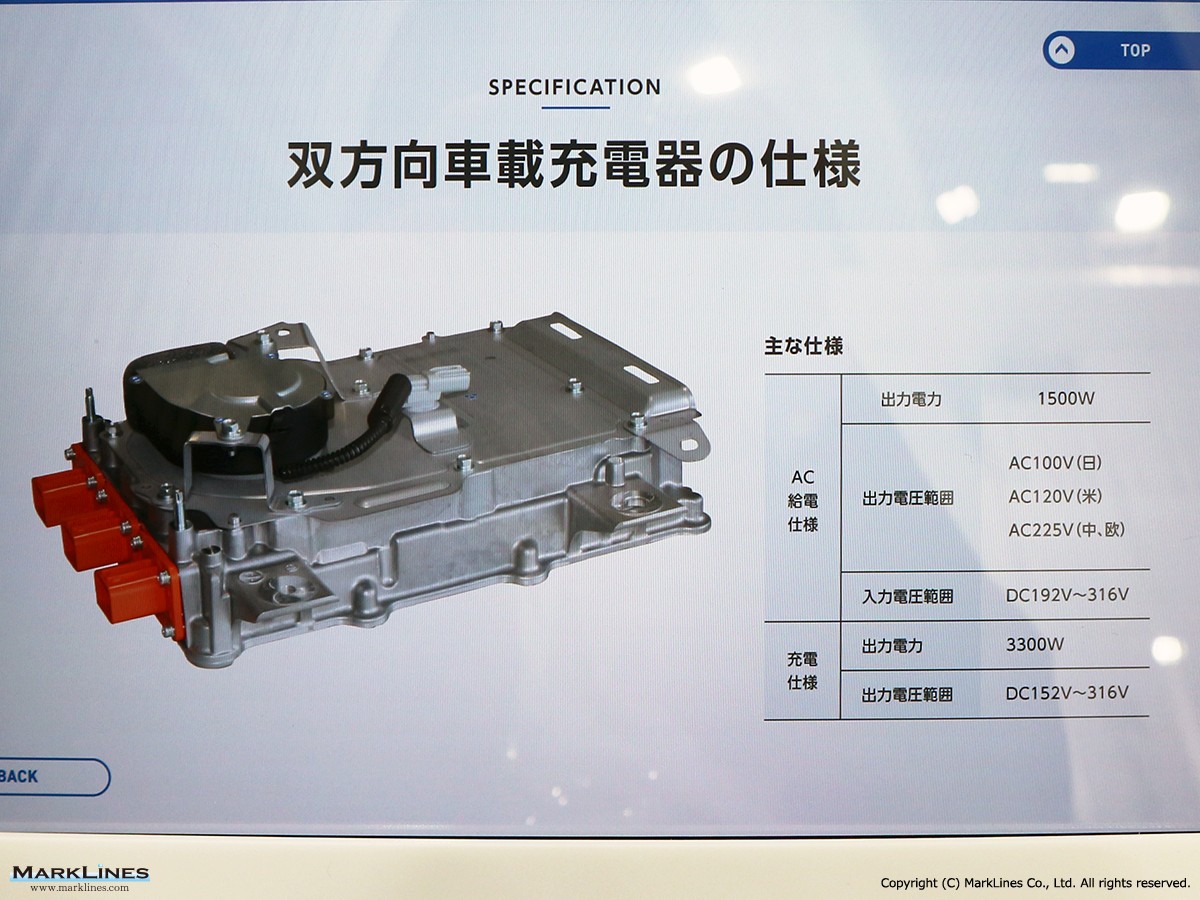
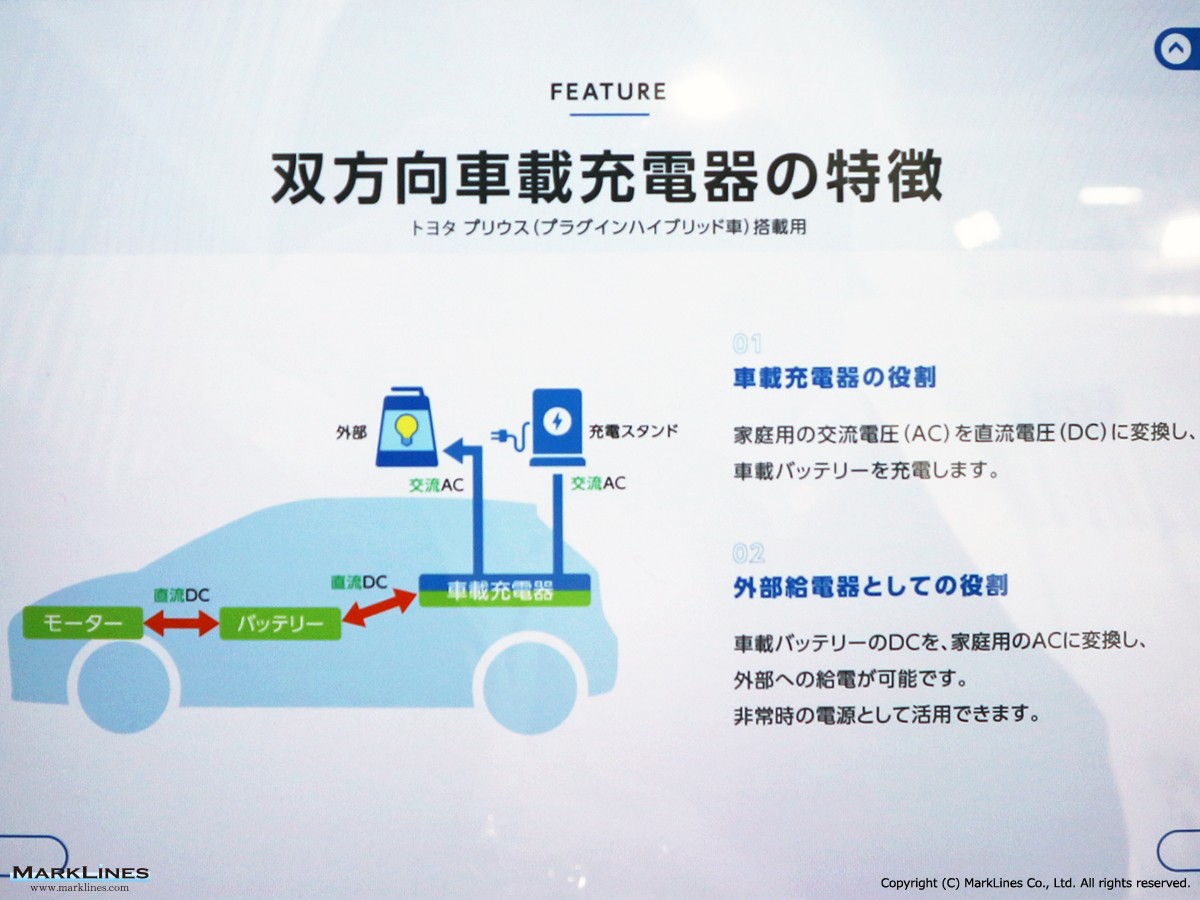
Bi-directional in-vehicle charger
 3
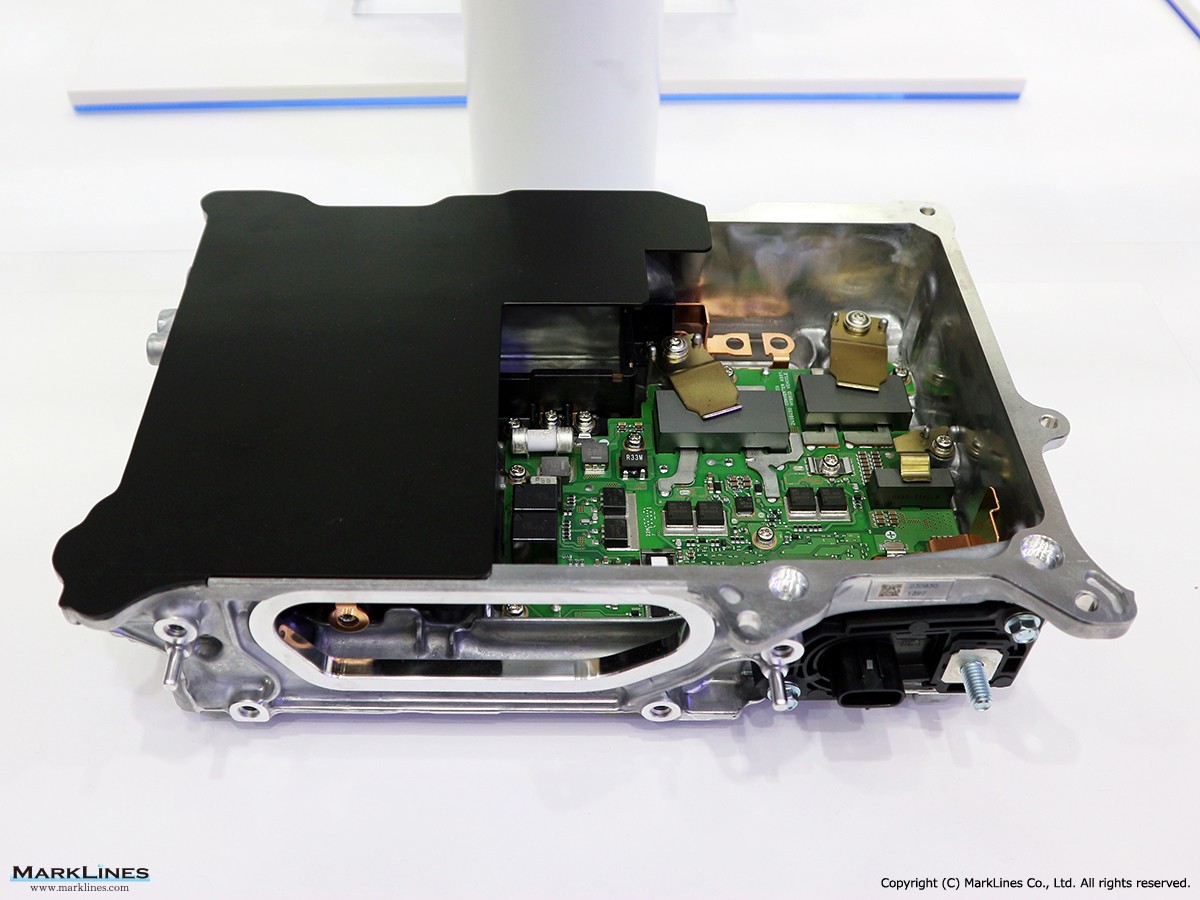
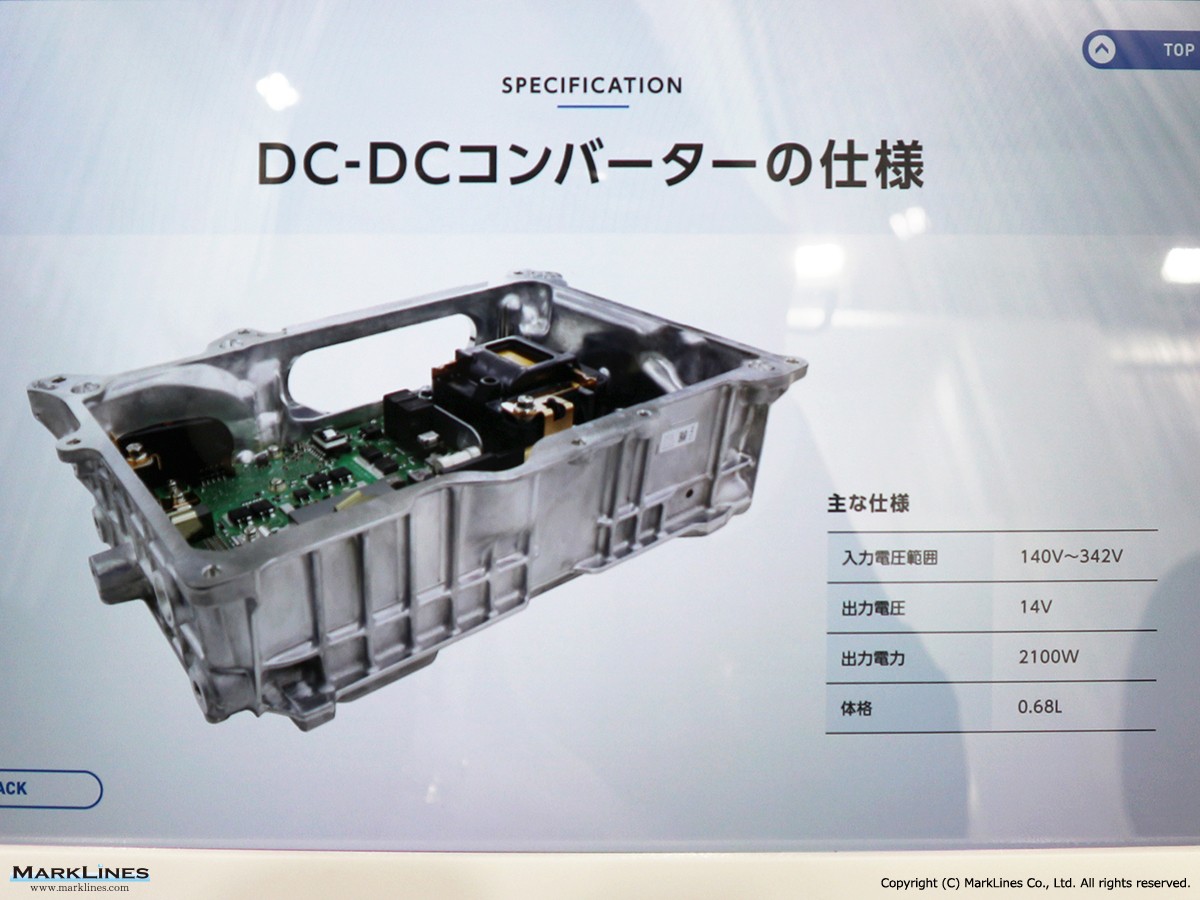
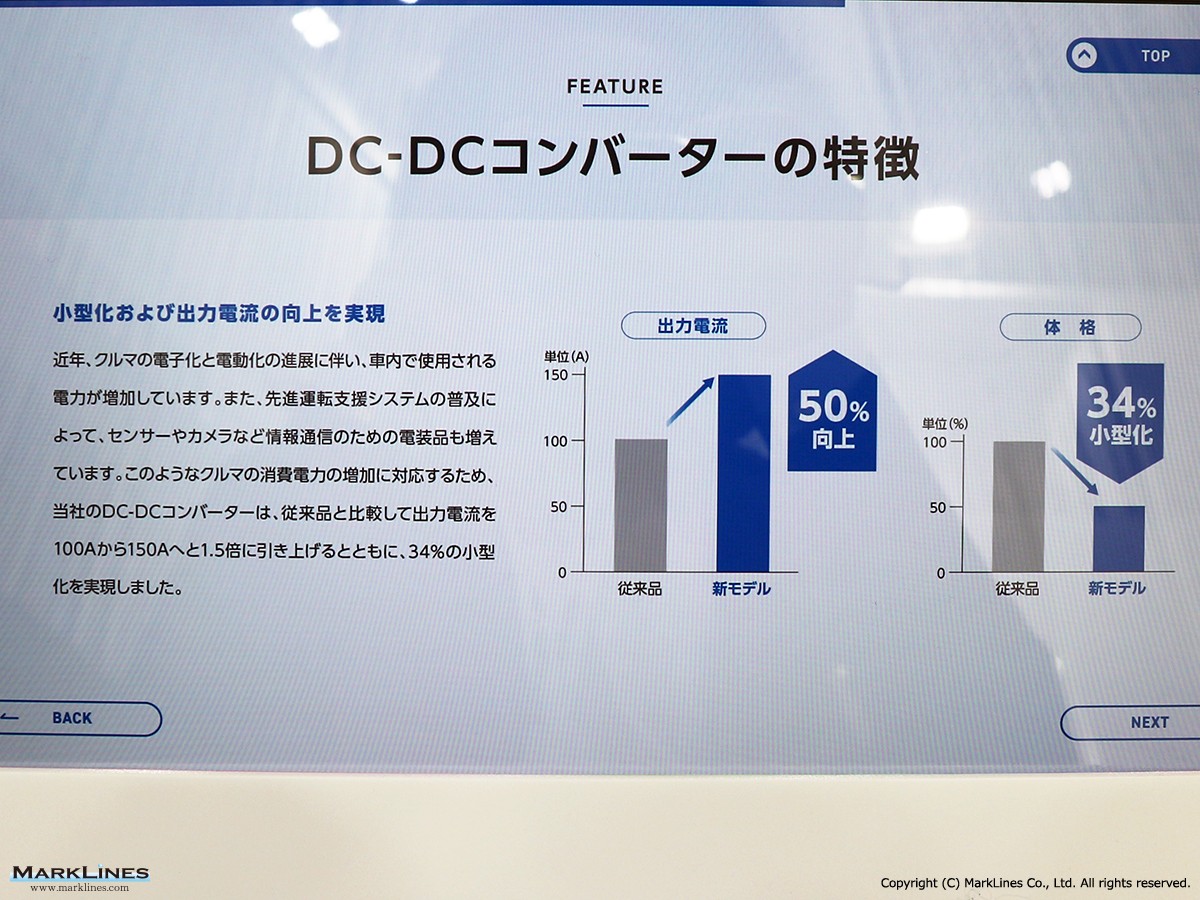
3
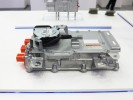
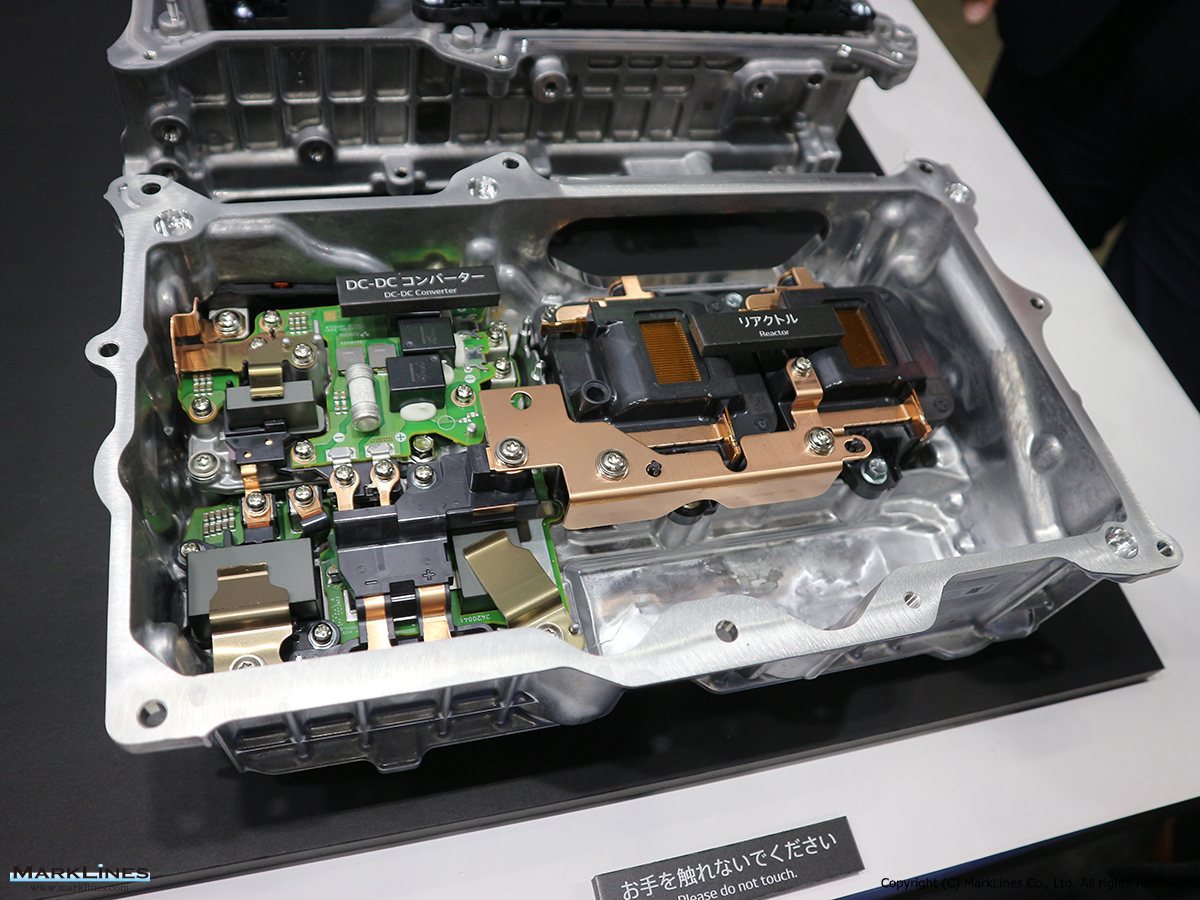
DC/DC converter
Sort by :
1 - 10 of 10 results
Japan - New car sales in 2025 by OEM, model, vehicle type
9 329,786 1.7% 4,565,777 4,421,494 3.3% Source: Japan Automobile Dealers Association, Japan Light Motor Vehicle and Motorcycle Association Non-mini vehicles Total (Breakdown by vehicle type) Brands 2025 2024 Y-o-Y 2025 2024 Y-o-Y Dec. Share Dec. Share Jan.-Dec. Share Jan.-Dec. Share Toyota 97,885 46.2% 95,072 45.1% 3.0% 1,390,358 48.0% 1,339,108 46.8% 3.8% Honda 23,545 11.1% 25,034 11.9% -5.9% 340,419 11.7% 380,099 13.3% -10.4% ...
Automotive Sales Data Updated at: 2026/02/02
Japan - New car sales in 2024 by OEM, model, vehicle type
9,786 362,839 -9.1% 4,421,494 4,779,086 -7.5% Source: Japan Automobile Dealers Association, Japan Light Motor Vehicle and Motorcycle AssociationNon-mini vehicles Total (Breakdown by vehicle type) Brands 2024 2023 Y-o-Y 2024 2023 Y-o-Y Dec. Share Dec. Share Jan.-Dec. Share Jan.-Dec. Share Toyota 95,072 45.1% 107,892 46.4% -11.9% 1,339,108 46.8% 1,548,594 51.0% -13.5% Honda 25,034 11.9% 27,778 12.0% -9.9% 380,099 13.3% 275,722 9.1% 37....
Automotive Sales Data Updated at: 2025/07/02
Japan - Flash report, Automotive sales volume, 2023
,839 344,364 5.4% 4,779,086 4,201,320 13.8% Source: Japan Automobile Dealers Association, Japan Light Motor Vehicle and Motorcycle Association Non-mini vehicles Total (Breakdown by vehicle type) Brands 2023 2022 Y-o-Y 2023 2022 Y-o-Y Dec. Share Dec. Share Jan.-Dec. Share Jan.-Dec. Share Toyota 107,892 46.4% 93,874 44.9% 14.9% 1,548,594 51.0% 1,217,128 47.5% 27.2% Nissan 19,703 8.5% 20,167 9.6% -2.3% 291,046 9.6% 272,020 10.6% 7.0% ...
Automotive Sales Data Updated at: 2025/06/04
Japan - Flash report, Automotive sales volume, 2022
344,365 336,442 2.4% 4,201,321 4,448,340 -5.6% Source: Japan Automobile Dealers Association, Japan Light Motor Vehicle and Motorcycle AssociationNon-mini vehicles Total (Breakdown by vehicle type) Brands 2022 2021 Y-o-Y 2022 2021 Y-o-Y Dec. Share Dec. Share Jan.-Dec. Share Jan.-Dec. Share Toyota 93,874 44.9% 107,091 48.9% -12.3% 1,217,128 47.5% 1,388,960 49.7% -12.4% Nissan 20,167 9.6% 18,338 8.4% 10.0% 272,020 10.6% 274,291 9.8% -0.8...
Automotive Sales Data Updated at: 2025/06/04
Japan - Flash report, Automotive sales volume, 2021
6,442 379,896 -11.4% 4,448,340 4,598,615 -3.3% Source: Japan Automobile Dealers Association, Japan Light Motor Vehicle and Motorcycle AssociationNon-mini vehicles Total (Breakdown by vehicle type) Brands 2021 2020 Y-o-Y 2021 2020 Y-o-Y Dec. Share Dec. Share Jan.-Dec. Share Jan.-Dec. Share Toyota 107,091 48.9% 116,630 47.8% -8.2% 1,388,960 49.7% 1,423,151 49.4% -2.4% Honda 22,039 10.1% 20,989 8.6% 5.0% 274,374 9.8% 293,800 10.2% -6.6% ...
Automotive Sales Data Updated at: 2025/06/04
Japan - Flash report, Sales volume, 2019
75 387,525 -11.0% 5,195,216 5,272,067 -1.5% Source: Japan Automobile Dealers Association, Japan Light Motor Vehicle and Motorcycle Association Non-mini vehicles Total (Breakdown by vehicle type) Brands 2019 2018 Y-o-Y 2019 2018 Y-o-Y Dec. Share Dec. Share Jan.-Dec. Share Jan.-Dec. Share Toyota 105,667 46.6% 107,317 42.8% -1.5% 1,510,741 46.0% 1,471,079 43.9% 2.7% Nissan 19,349 8.5% 24,148 9.6% -19.9% 367,514 11.2% 426,323 12.7% -13....
Automotive Sales Data Updated at: 2020/01/23
Japan - Flash report, Sales volume, 2018
843,341 4.4% Total 387,525 394,253 -1.7% 5,272,067 5,234,165 0.7% Source: Japan Automobile Dealers Association, Japan Mini Vehicles AssociationNon-mini vehicles Total (Breakdown by vehicle type) Brands 2018 2017 Y-o-Y 2018 2017 Y-o-Y Dec. Share Dec. Share Jan.-Dec. Share Jan.-Dec. Share Toyota 107,317 42.8% 119,900 45.7% -10.5% 1,471,079 43.9% 1,556,301 45.9% -5.5% Nissan 24,148 9.6% 25,484 9.7% -5.2% 426,323 12.7% 408,560 12.0% 4.3...
Automotive Sales Data Updated at: 2019/04/03
Japan - Flash report, Sales volume, 2017
,460 6.8% Total 394,254 397,534 -0.8% 5,234,166 4,970,258 5.3% Source: Japan Automobile Dealers Association, Japan Mini Vehicles Association Non-mini vehicles Total (Breakdown by vehicle type) Brands 2017 2016 Y-o-Y 2017 2016 Y-o-Y Dec. Share Dec. Share Jan.-Dec. Share Jan.-Dec. Share Toyota 119,900 45.7% 122,217 46.1% -1.9% 1,556,301 45.9% 1,498,758 46.2% 3.8% Nissan 25,484 9.7% 33,024 12.5% -22.8% 408,560 12.0% 385,623 11.9% 5.9...
Automotive Sales Data Updated at: 2018/07/24
USA - Flash report, Sales volume, 2014
,157 17.0% 19.3% 2,935,008 17.8% 2,786,078 17.9% 5.3% Ford 220,671 14.7% 218,058 16.1% 1.2% 2,480,942 15.1% 2,493,918 16.0% -0.5% FCA 193,261 12.9% 161,007 11.9% 20.0% 2,090,639 12.7% 1,800,368 11.6% 16.1% Total 688,415 45.8% 609,222 44.9% 13.0% 7,506,589 45.6% 7,080,364 45.5% 6.0% Japanese Toyota 215,057 14.3% 190,843 14.1% 12.7% 2,373,771 14.4% 2,236,042 14.4% 6.2% Honda 137,281 9.1% 135,255 10.0% 1.5% 1,540,872 9.4% 1,525,312 9.8% 1....
Automotive Sales Data Updated at: 2015/01/06
USA - Flash report, Sales volume, 2013
3 18.2% -6.3% 2,786,078 18.0% 2,595,717 18.0% 7.3% Ford 218,058 16.2% 214,222 15.9% 1.8% 2,493,918 16.1% 2,250,165 15.6% 10.8% Chrysler 161,007 11.9% 152,367 11.3% 5.7% 1,800,368 11.6% 1,651,787 11.5% 9.0% Total 609,222 45.2% 612,322 45.4% -0.5% 7,080,364 45.7% 6,497,669 45.1% 9.0% Japanese Toyota 190,843 14.2% 194,143 14.4% -1.7% 2,236,042 14.4% 2,082,504 14.4% 7.4% Honda 135,255 10.0% 132,774 9.8% 1.9% 1,525,312 9.8% 1,422,785 9.9% 7....
Automotive Sales Data Updated at: 2014/01/06


 Japan
Japan USA
USA Mexico
 Germany
 China (Shanghai)
 Thailand
 India
India