
 AI Navigator


Search Results by Category
 AI Navigator
All information related to {{ key_word }}.
AI Navigation will guide you. Click here for information about {{ key_word }}.
Images
 2
2
Rear system
 5
5
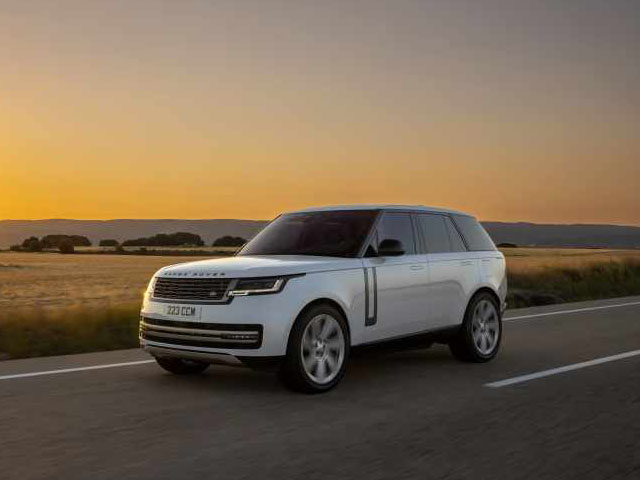
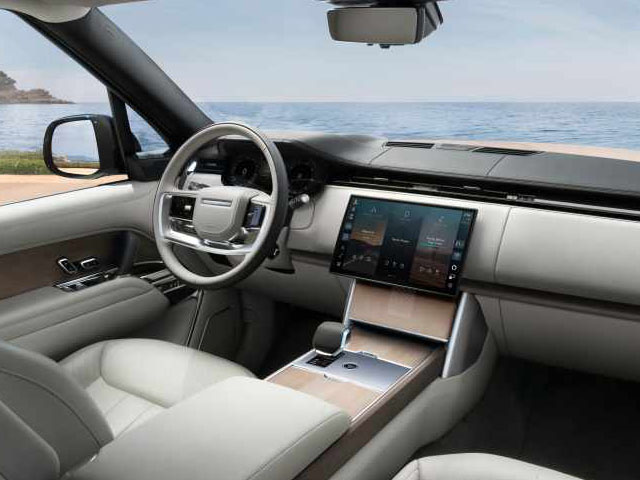
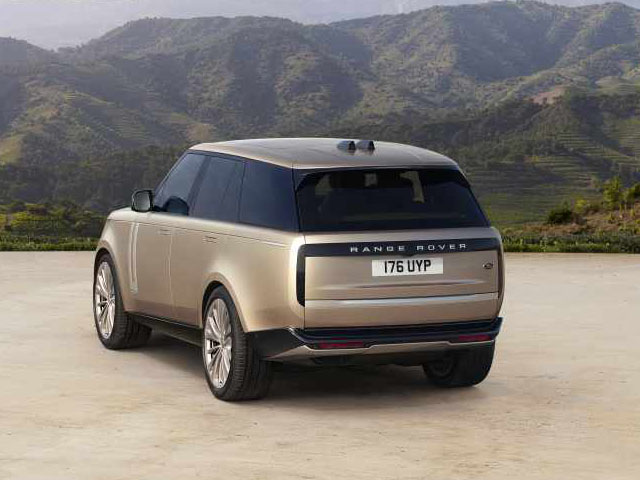
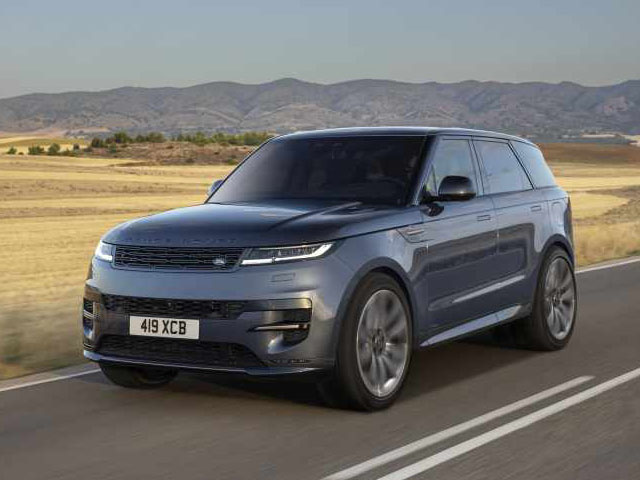
Range Rover/Range Rover Sport P460e/P550e
 4
4
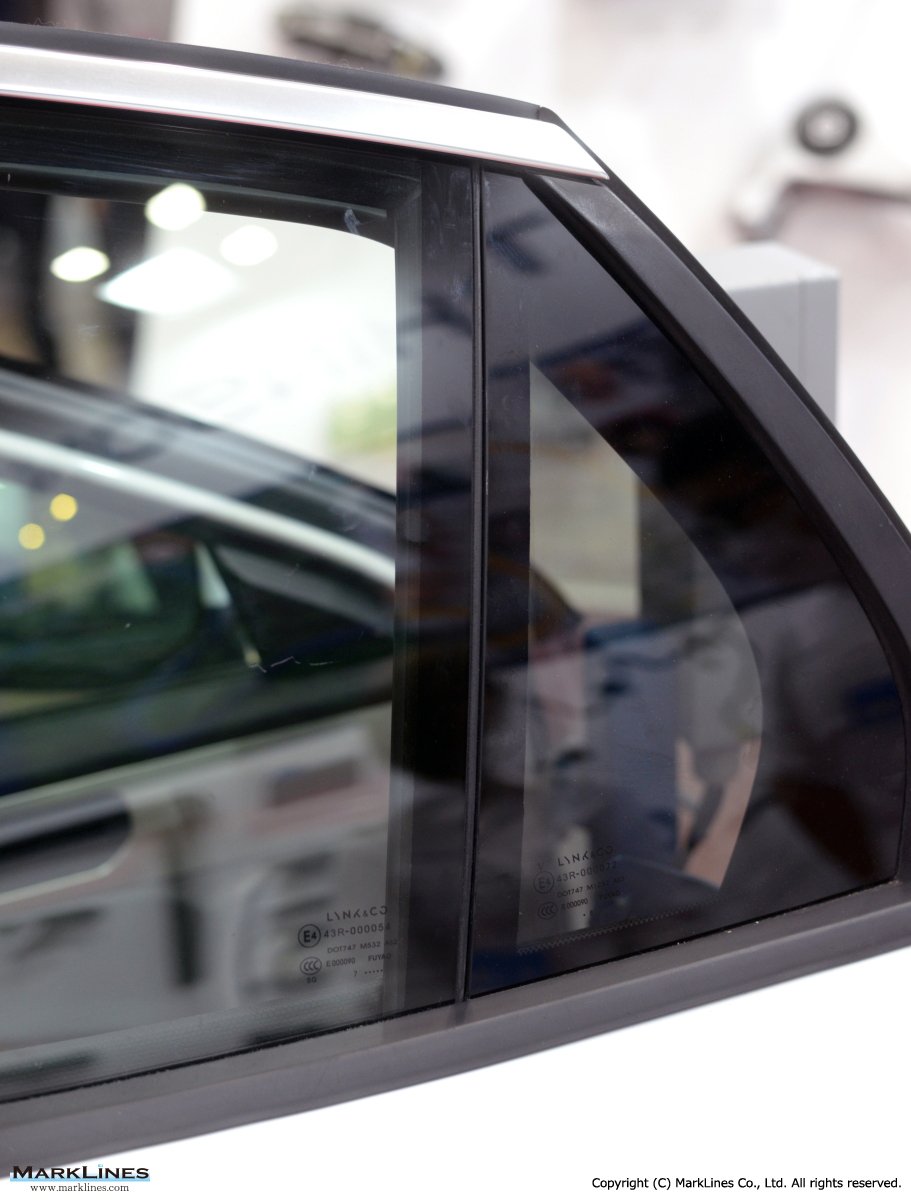
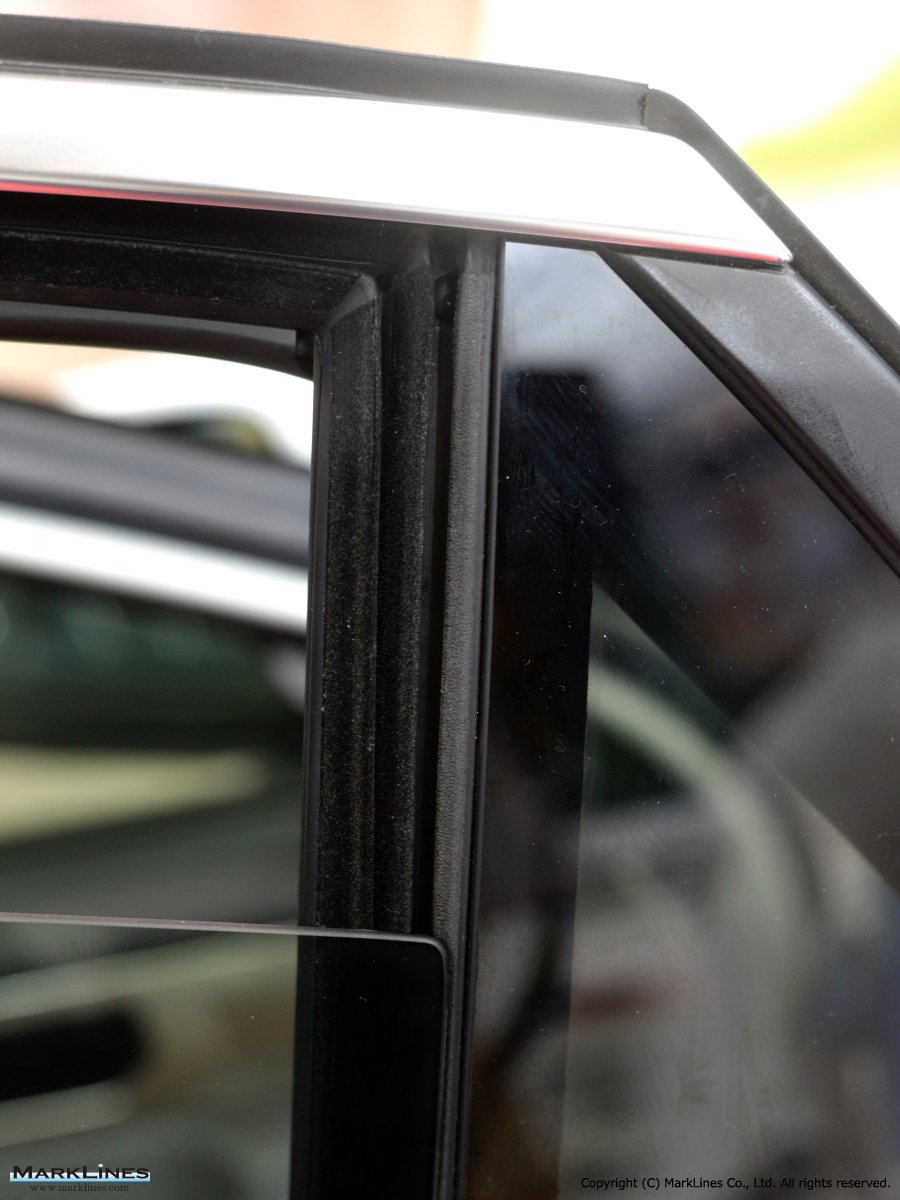
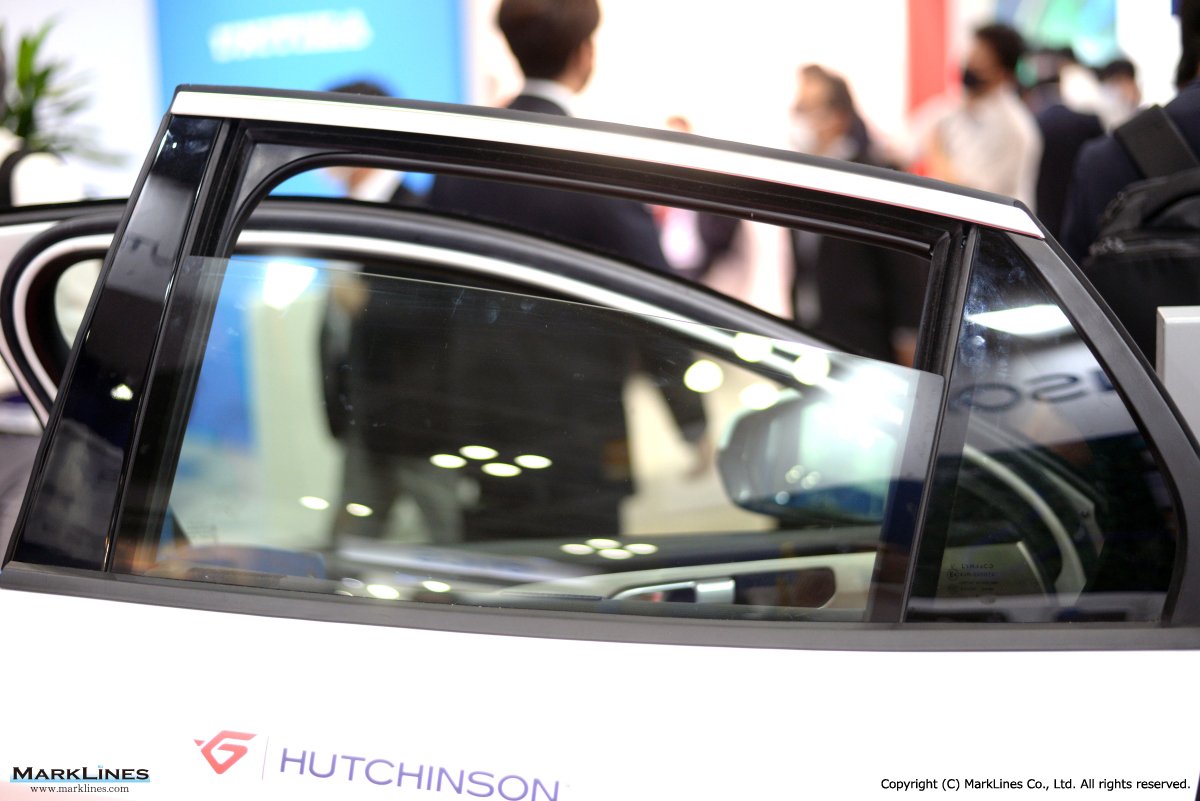
Flush glazing prototype door
 4
4
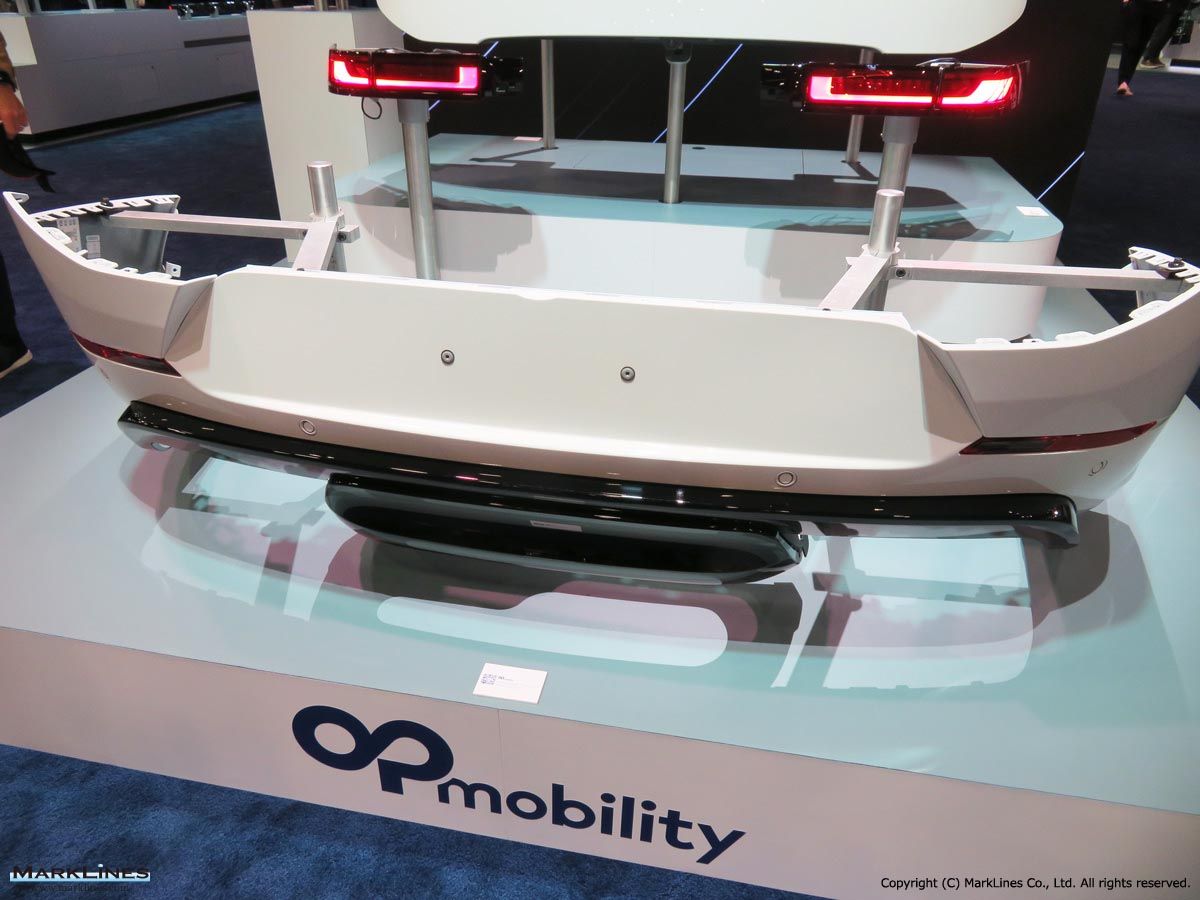
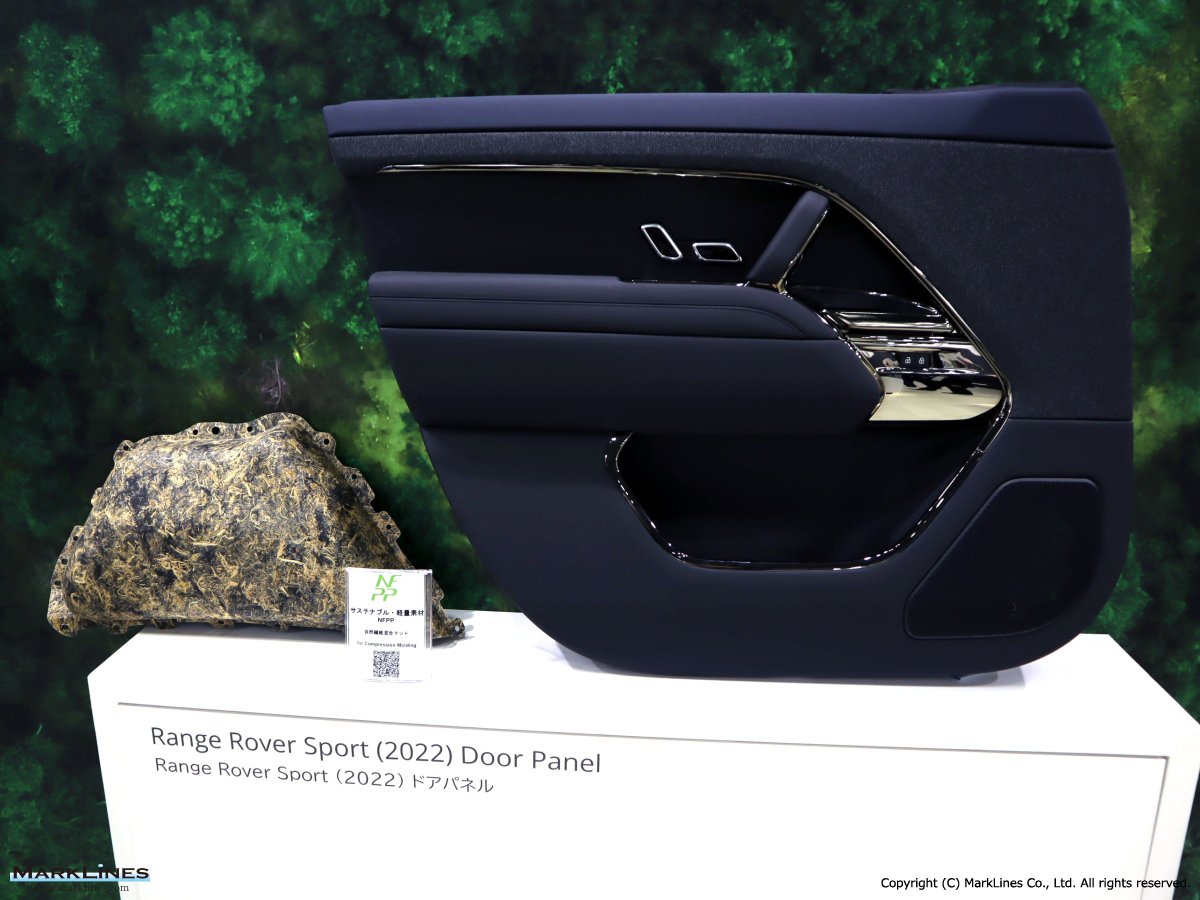
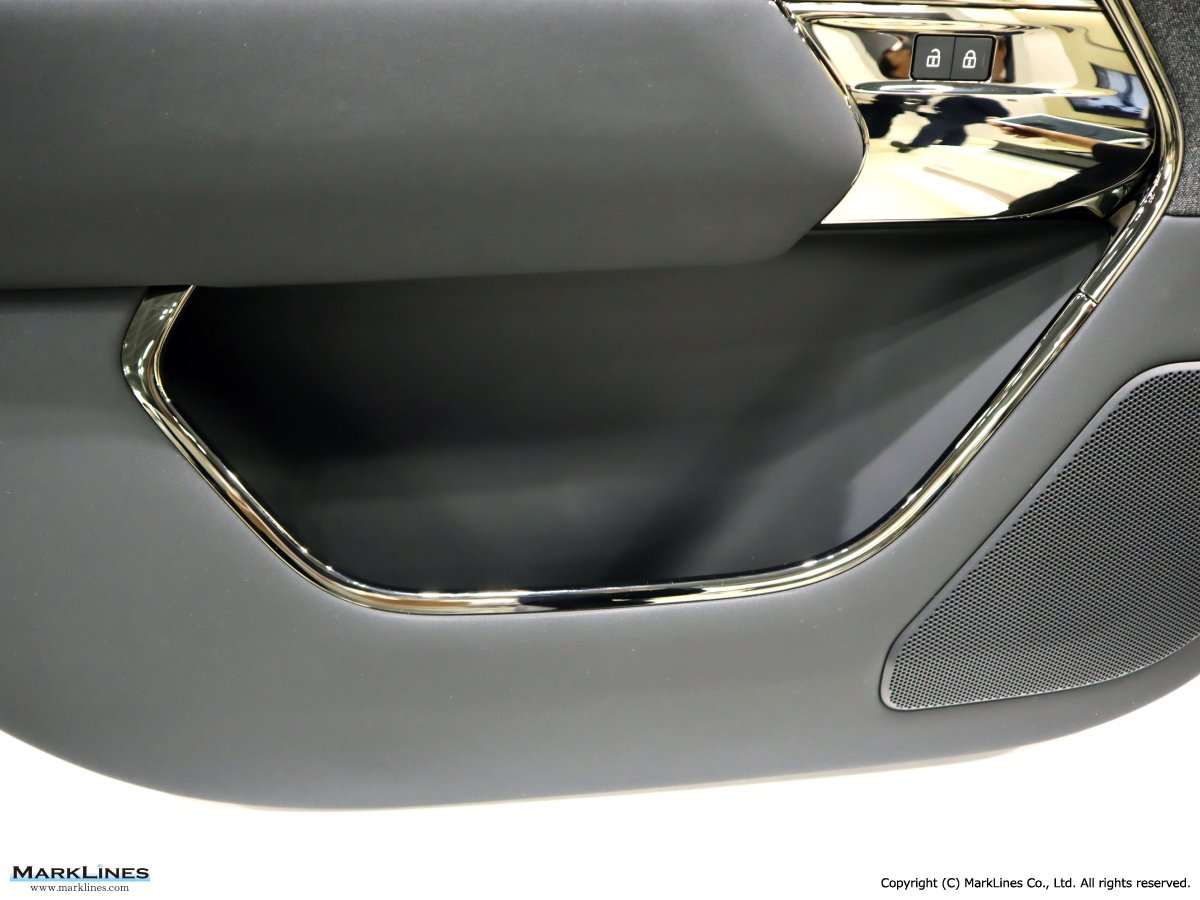
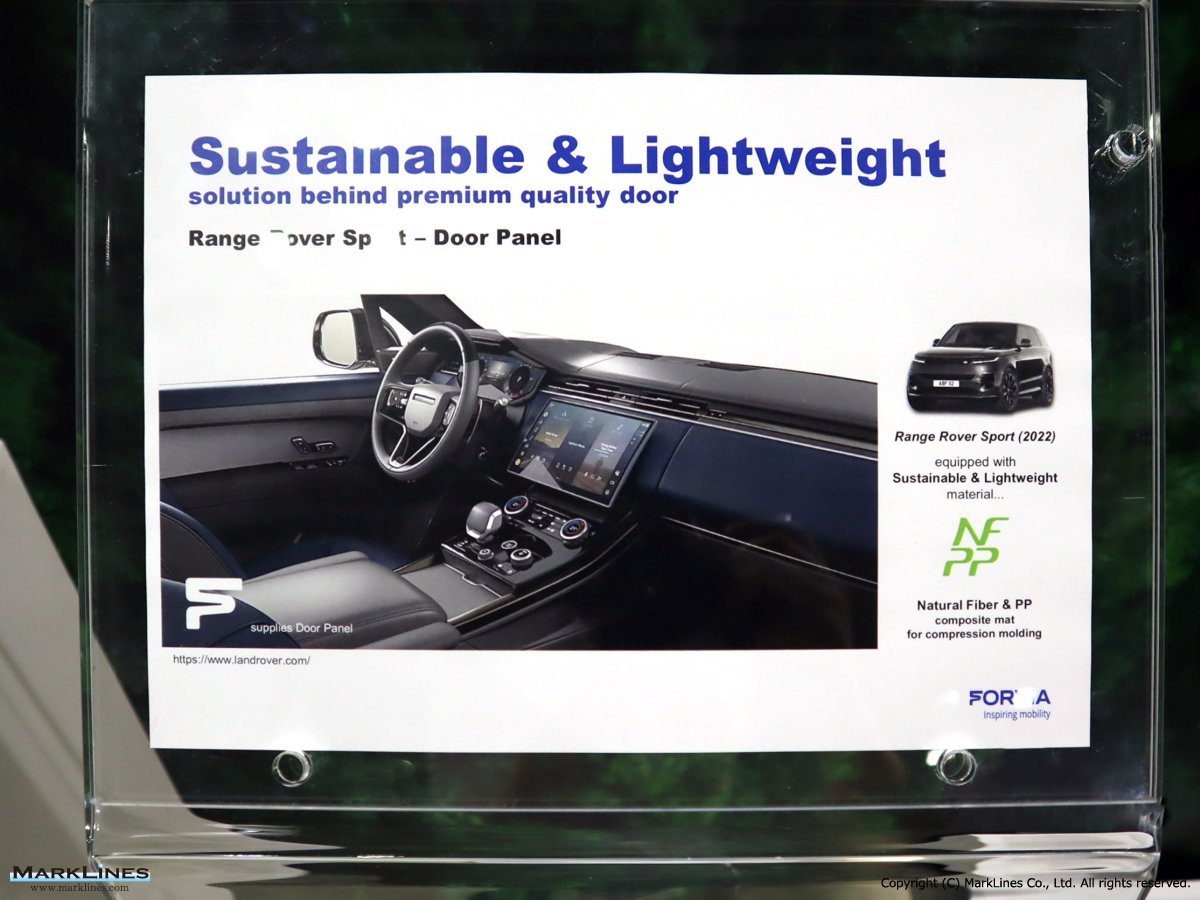
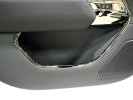
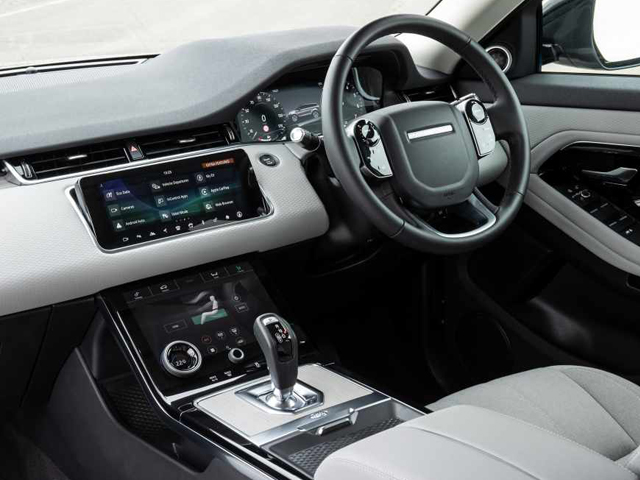
Door panels
 2
2
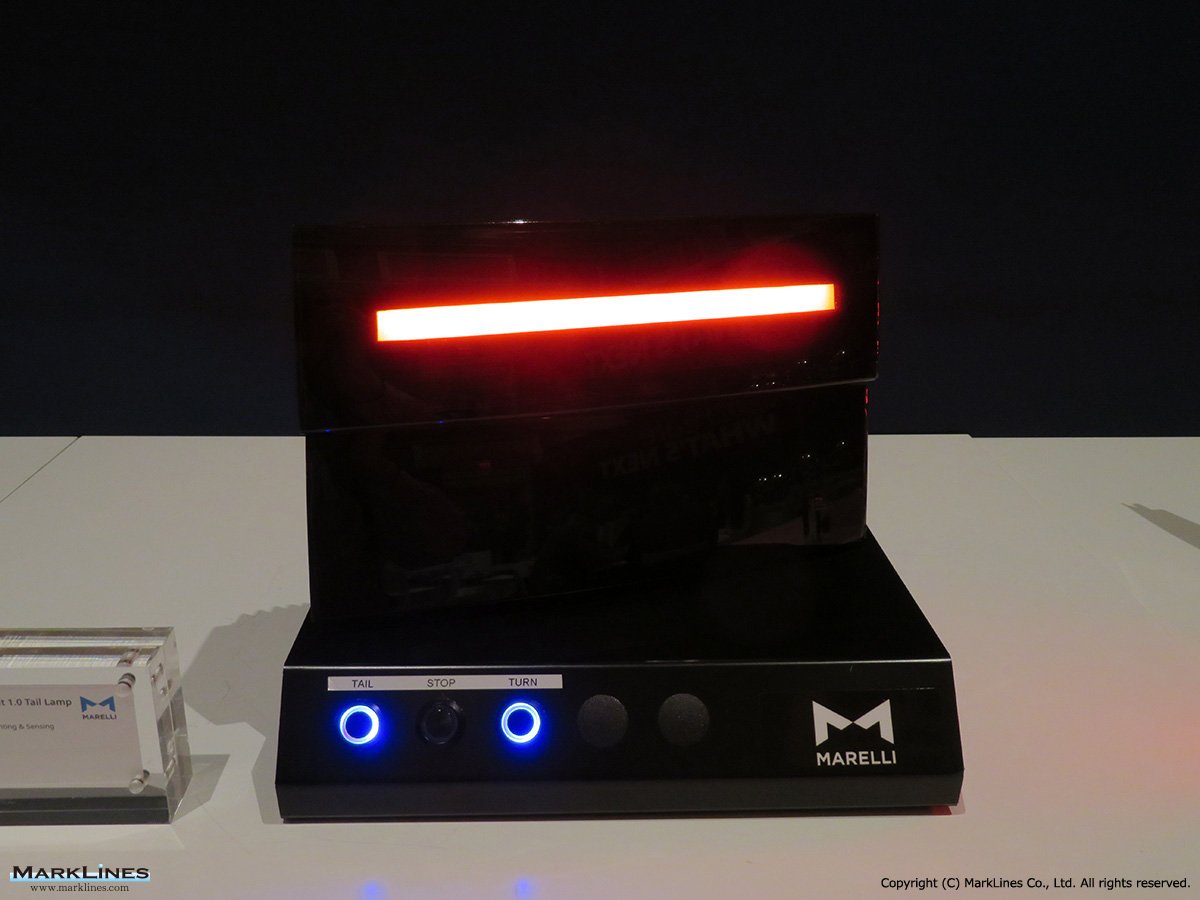
Hidden Til Lit tail lamp
 5
5
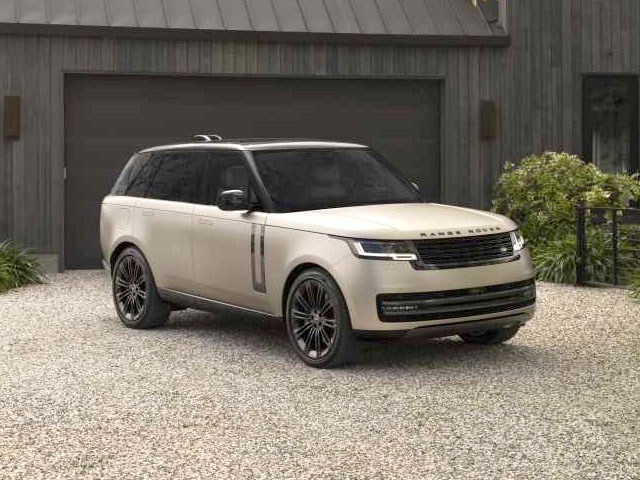
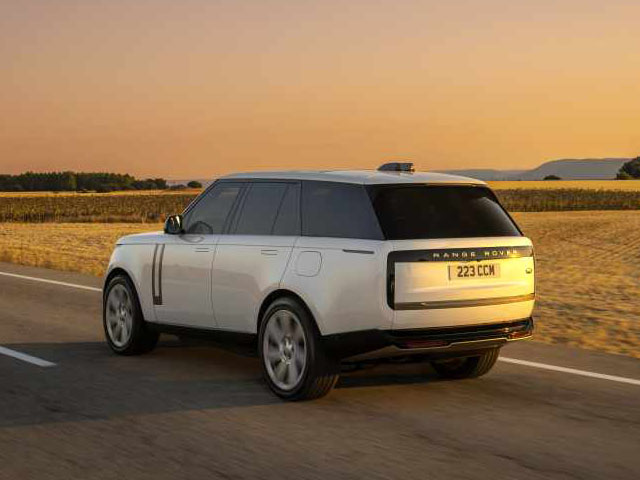
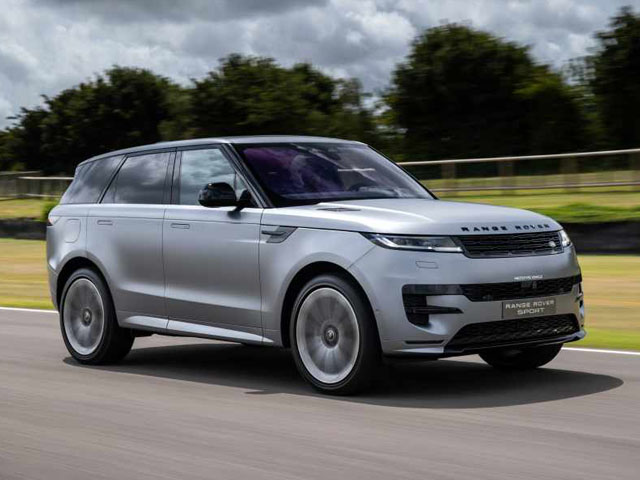
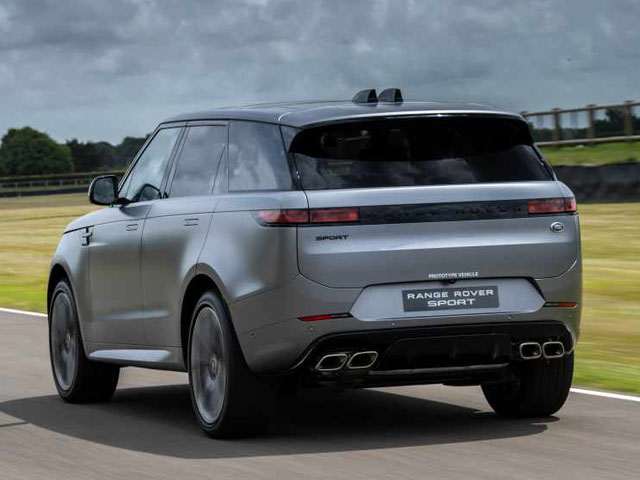
Range Rover/Range Rover Sport
 4
4
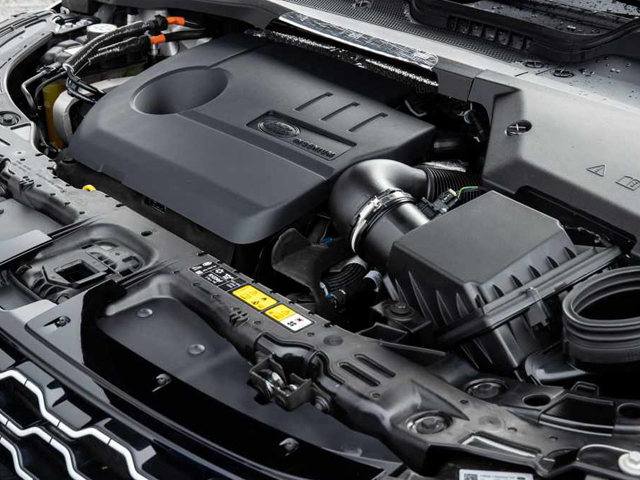
Range Rover Evoque P270e
 4
4
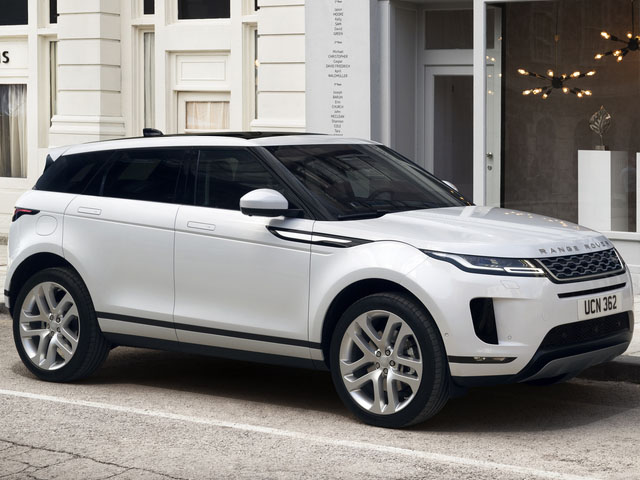
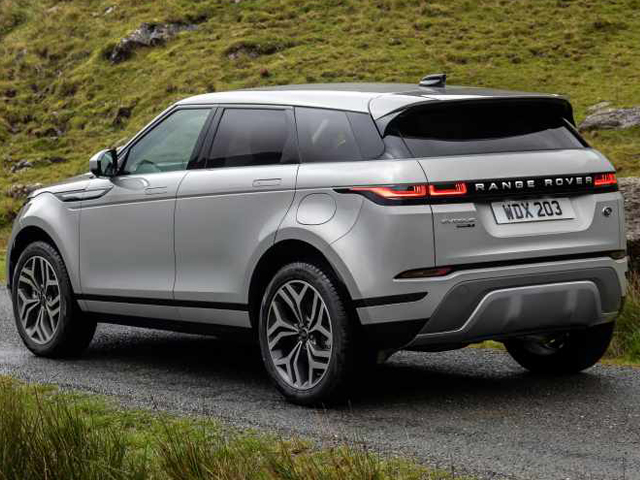
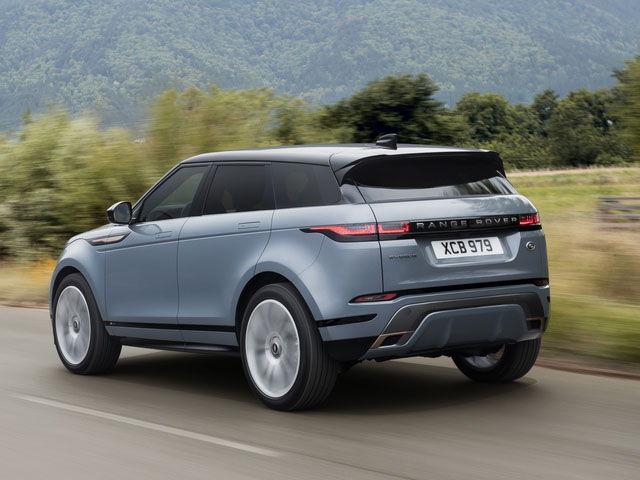
Range Rover Evoque
 3
3
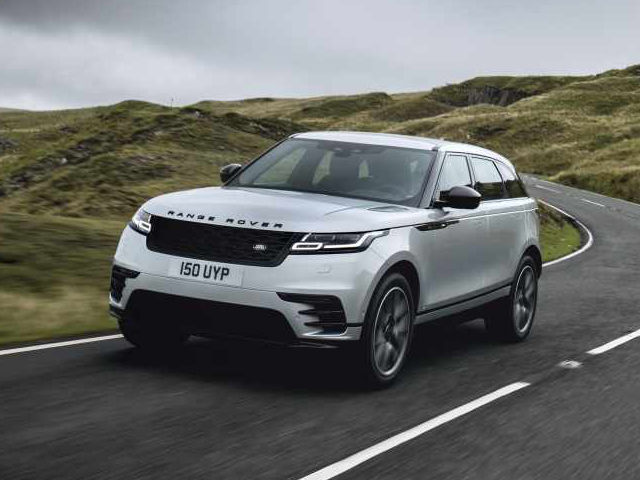
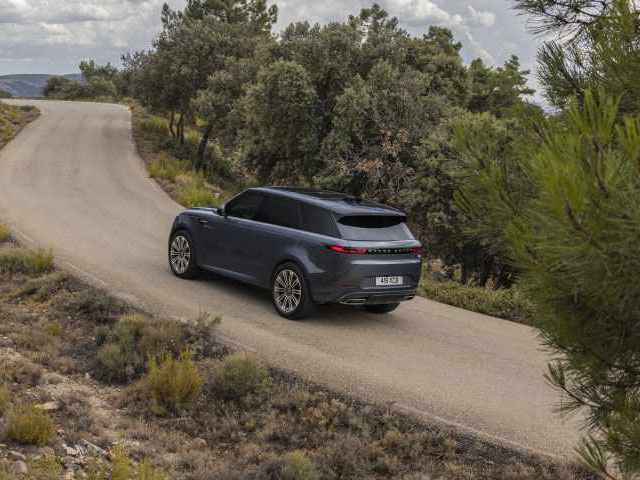
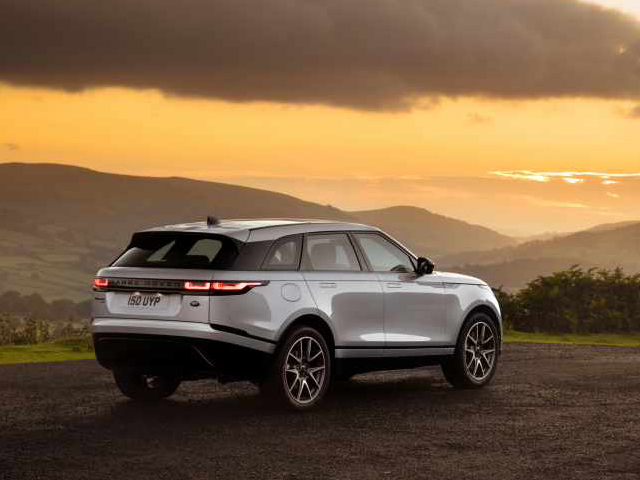
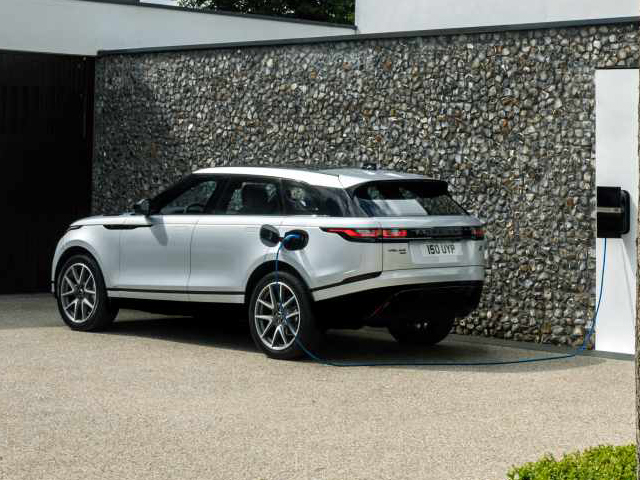
Range Rover Velar
 3
3
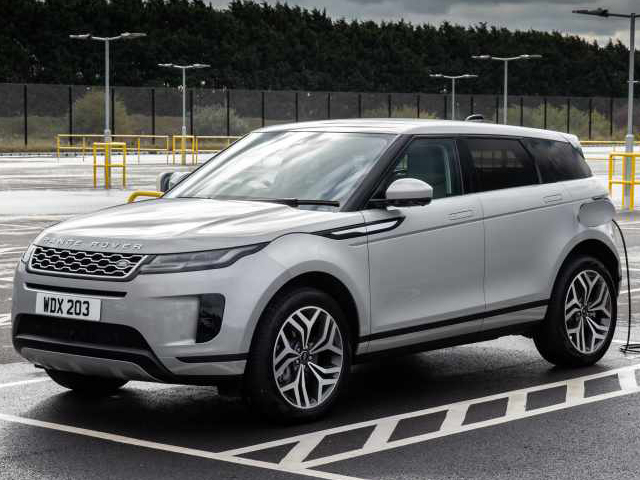
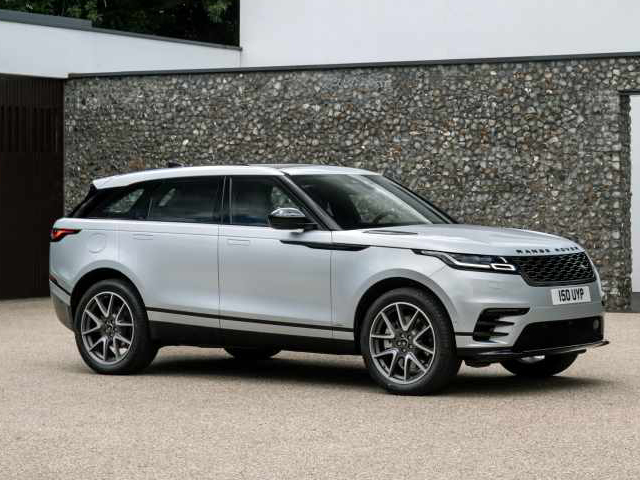
Range Rover Velar P400e
Sort by :
1 - 12 of 12 results
USA - New car sales in 2025 by OEM, model, vehicle type
26,988 31,729 -14.9% 306,833 339,417 -9.6% Share 2.1% 2.3% -0.2 pt 2.1% 2.3% -0.3 pt Audi *2 Total 10,960 18,411 -40.5% 153,579 176,449 -13.0% Share 0.9% 1.3% -0.5 pt 1.0% 1.2% -0.2 pt Volvo *2 Total 9,004 12,259 -26.6% 107,414 111,166 -3.4% Share 0.7% 0.9% -0.2 pt 0.7% 0.8% 0.0 pt Land Rover *2 Total 6,638 8,723 -23.9% 87,721 83,292 5.3% Share 0.5% 0.6% -0.1 pt 0.6% 0.6% 0.0 pt Mitsubishi Total 6,297 8,613 -26.9% 85,289 101,026 -...
Automotive Sales Data Updated at: 2025/12/09
Germany - New car sales in 2025 by OEM, model, vehicle type
its with a share of 0.4% and diesel cars fell 19.3% to 29,471 units with a share of 11.8%. No new registrations were recorded for natural gas-powered vehicles.On November 28, German Chancellor Friedrich Merz stated that even after 2035, not only purely electric vehicles but also plug-in hybrids and range extenders should continue to be permitted. The federal government also announced that it will introduce a new funding program so that more priva...
Automotive Sales Data Updated at: 2025/12/04
Spain - New car sales in 2025 by OEM
November also grows at double digits and even levels in the same month of 2019. Since September we have been at levels higher than the year before the pandemic. In the year-to-date we have already exceeded the data for 2024 and if December does not suffer any stops, the final market would be in the range of 1.14 or 1.15 million passenger cars sold. A strong domestic market is key to strengthening the competitiveness of industry. On Wednesday, the...
Automotive Sales Data Updated at: 2025/12/02
UK - New car sales in 2024 by OEM, vehicle type
units (38.2% share), fleet sales increased 11.8% to 1,163,855 units (59.6% share), and businesses sales fell 3.1% to 42,647 units (2.2% share).“A record year for EV registrations underscores vehicle manufacturers’ unswerving commitment to a decarbonised new car market, with more choice, better range and increased affordability than ever before. This has come at huge cost, however, with the billions invested in new models being supplemented b...
Automotive Sales Data Updated at: 2025/07/03
UK - Flash report, Automotive sales volume, 2021
units in 2021.Sales of taxis increased 32.6% in 2021 to 1,339 units.Mike Hawes, CEO of SMMT said “It’s been another desperately disappointing year for the car industry as Covid continues to cast a pall over any recovery. Manufacturers continue to battle myriad challenges, with tougher trading arrangements, accelerating technology shifts and, above all, the global semiconductor shortage which is decimating supply. Despite the challenges, the u...
Automotive Sales Data Updated at: 2025/06/04
UK - Flash report, Sales volume, 2019
92 4.6% 101,922 4.3% 3.2% Kia 4,980 3.3% 3,810 2.6% 30.7% 97,323 4.2% 95,764 4.0% 1.6% Nissan 5,309 3.6% 5,294 3.7% 0.3% 92,372 4.0% 102,637 4.3% -10.0% Hyundai 3,801 2.6% 4,009 2.8% -5.2% 83,284 3.6% 89,925 3.8% -7.4% Peugeot 5,719 3.8% 4,763 3.3% 20.1% 80,851 3.5% 81,043 3.4% -0.2% Land Rover 4,316 2.9% 4,321 3.0% -0.1% 76,546 3.3% 77,906 3.3% -1.7% Skoda 5,799 3.9% 5,328 3.7% 8.8% 75,053 3.2% 74,724 3.2% 0.4% SEAT 3,693 2.5% 2,80...
Automotive Sales Data Updated at: 2020/01/10
USA - Flash report, Sales volume, 2018
sales were up 1.9% compared to last December.Kia sales increased 10.2%, while Hyundai sales increased 3.3% from last December.Among German companies, BMW brand sales increased 0.3% and Volkswagen brand sales increased 5.8% from the same month last year.Volvo sales decreased 8.8%, while Jaguar Land Rover sales increased 23.6% from last December.(based on Marklines Data Center on January 4, 2019)Sales of new vehicles by type Type 2018 2017 Y...
Automotive Sales Data Updated at: 2019/01/28
UK - Flash report, Sales volume, 2017
6.9% 177,304 6.6% -1.3% Nissan 7,759 5.1% 10,628 6.0% -27.0% 151,156 5.9% 152,525 5.7% -0.9% Toyota 5,188 3.4% 4,642 2.6% 11.8% 101,985 4.0% 96,746 3.6% 5.4% Hyundai 5,026 3.3% 5,625 3.2% -10.6% 93,403 3.7% 92,419 3.4% 1.1% Kia 3,773 2.5% 3,788 2.1% -0.4% 93,222 3.7% 89,364 3.3% 4.3% Land Rover 4,186 2.7% 4,967 2.8% -15.7% 82,653 3.3% 79,534 3.0% 3.9% Peugeot 4,134 2.7% 5,753 3.2% -28.1% 82,226 3.2% 98,529 3.7% -16.5% Skoda 6,433 4....
Automotive Sales Data Updated at: 2018/07/24
New Zealand - Flash report, Sales volume, 2017
6,495 6.0% Ford 210 2.6% 6,479 6.0% Nissan 354 4.3% 4,796 4.4% Honda 363 4.5% 4,624 4.3% VW 178 2.2% 4,050 3.7% Subaru 179 2.2% 3,347 3.1% Mercedes-Benz 194 2.4% 2,541 2.3% Audi 146 1.8% 2,062 1.9% BMW 139 1.7% 1,957 1.8% Skoda 79 1.0% 1,281 1.2% Jeep 162 2.0% 1,254 1.2% Land Rover 76 0.9% 1,178 1.1% Ssangyong 50 0.6% 830 0.8% Peugeot 65 0.8% 781 0.7% Lexus 66 0.8% 712 0.7% MINI 35 0.4% 670 0.6% Volvo 46 0.6% 540 ...
Automotive Sales Data Updated at: 2018/07/24
New Zealand - Flash report, Sales volume, 2016
95 5.2% Suzuki 340 4.2% 5,290 5.2% Honda 211 2.6% 3,963 3.9% VW 247 3.1% 3,894 3.8% Subaru 175 2.2% 2,663 2.6% Mercedes-Benz 192 2.4% 2,482 2.4% BMW 124 1.5% 1,864 1.8% Audi 135 1.7% 1,830 1.8% Jeep 200 2.5% 1,558 1.5% Ssangyong 38 0.5% 1,462 1.4% Skoda 46 0.6% 1,209 1.2% Land Rover 46 0.6% 1,148 1.1% Peugeot 30 0.4% 751 0.7% Lexus 65 0.8% 720 0.7% Volvo 42 0.5% 608 0.6% MINI 31 0.4% 600 0.6% Dodge 49 0.6% 493 0.5%...
Automotive Sales Data Updated at: 2017/01/16
New Zealand - Flash report, Sales volume, 2015
4,377 4.6% VW 223 3.1% 3,780 4.0% Honda 149 2.1% 3,613 3.8% Kia 245 3.4% 3,260 3.4% Subaru 100 1.4% 2,268 2.4% Mercedes-Benz 223 3.1% 2,095 2.2% BMW 132 1.9% 1,954 2.1% Audi 66 0.9% 1,766 1.9% Ssangyong 67 0.9% 1,533 1.6% Jeep 102 1.4% 1,438 1.5% Skoda 39 0.5% 1,007 1.1% Land Rover 64 0.9% 919 1.0% Fiat 83 1.2% 800 0.8% Peugeot 33 0.5% 759 0.8% Lexus 61 0.9% 641 0.7% Dodge 40 0.6% 627 0.7% MINI 28 0.4% 615 0.6% ...
Automotive Sales Data Updated at: 2016/04/28
New Zealand - Flash report, Sales volume, 2014
% 3,900 4.3% Honda 190 2.8% 3,555 3.9% Kia 176 2.6% 2,826 3.1% BMW 119 1.8% 2,132 2.4% Audi 96 1.4% 2,075 2.3% Subaru 155 2.3% 1,823 2.0% Mercedes-Benz 94 1.4% 1,813 2.0% Jeep 122 1.8% 1,325 1.5% Peugeot 48 0.7% 1,059 1.2% Ssangyong 58 0.9% 988 1.1% Skoda 38 0.6% 854 0.9% Land Rover 23 0.3% 807 0.9% Fiat 184 2.7% 640 0.7% MINI 28 0.4% 569 0.6% Dodge 40 0.6% 568 0.6% Lexus 40 0.6% 557 0.6% Volvo 14 0.2% 421 0.5% C...
Automotive Sales Data Updated at: 2015/01/13


 Japan
Japan USA
USA Mexico
 Germany
 China (Shanghai)
 Thailand
 India
India