


Search Results by Category
All information related to {{ key_word }}.
AI Navigator will guide you. Click here for information about {{ key_word }}.
Images
 3
3
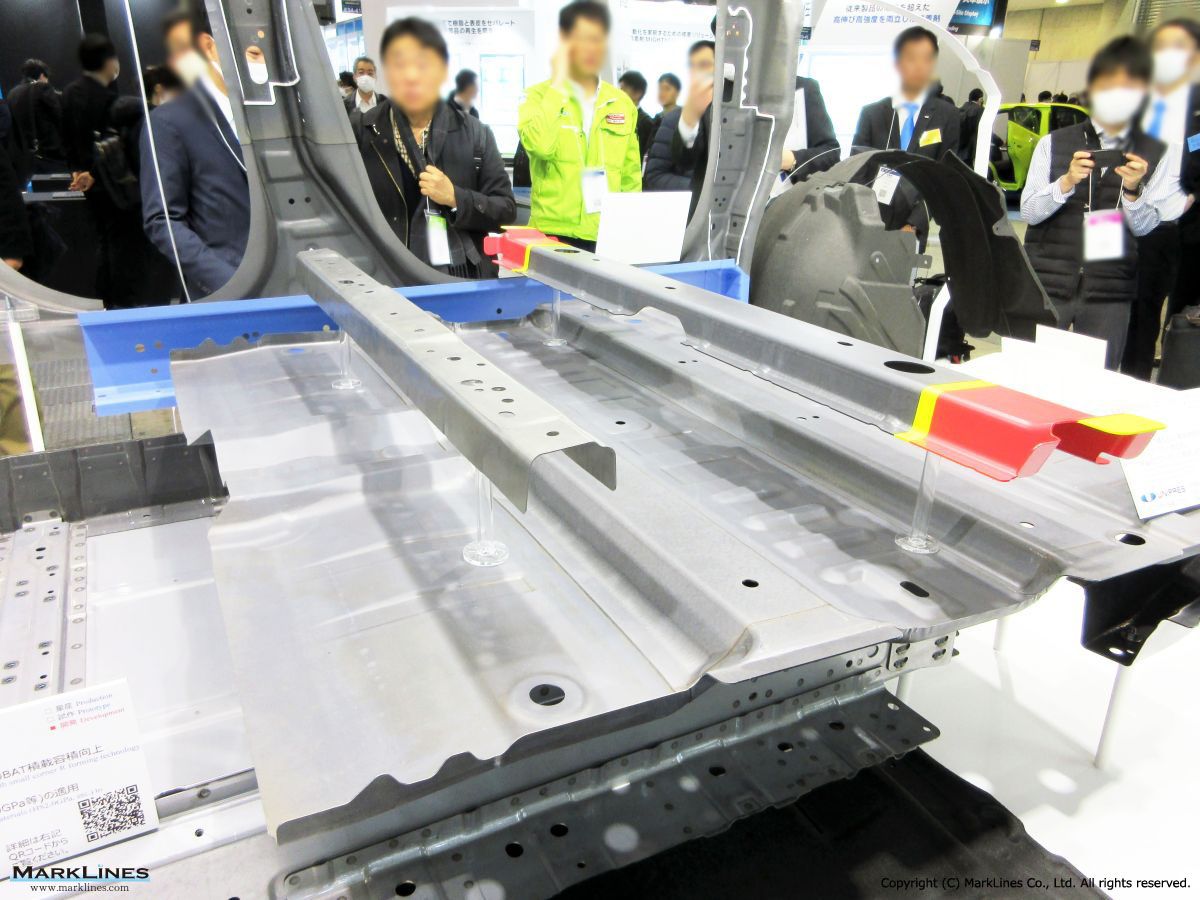
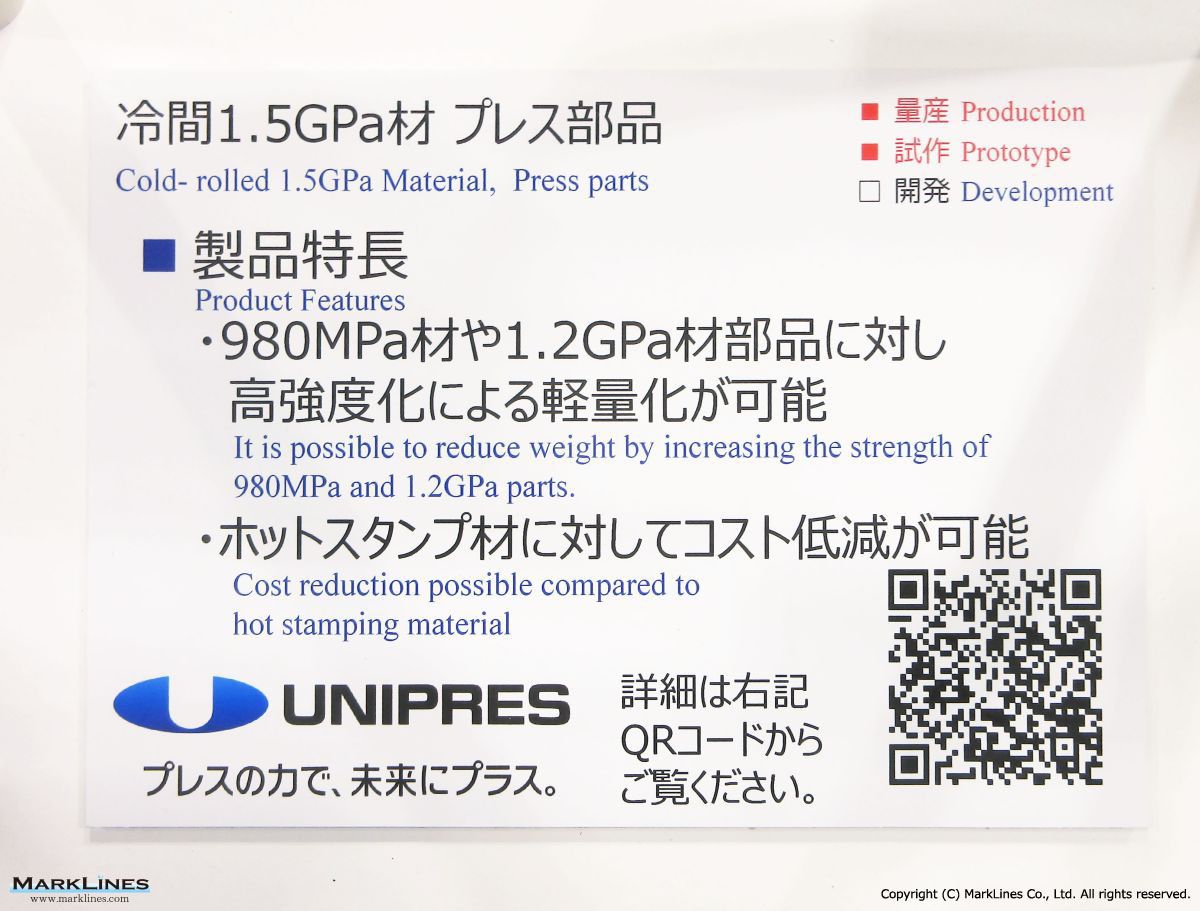
Cold-rolled 1.5GPa material, press parts
 2
2
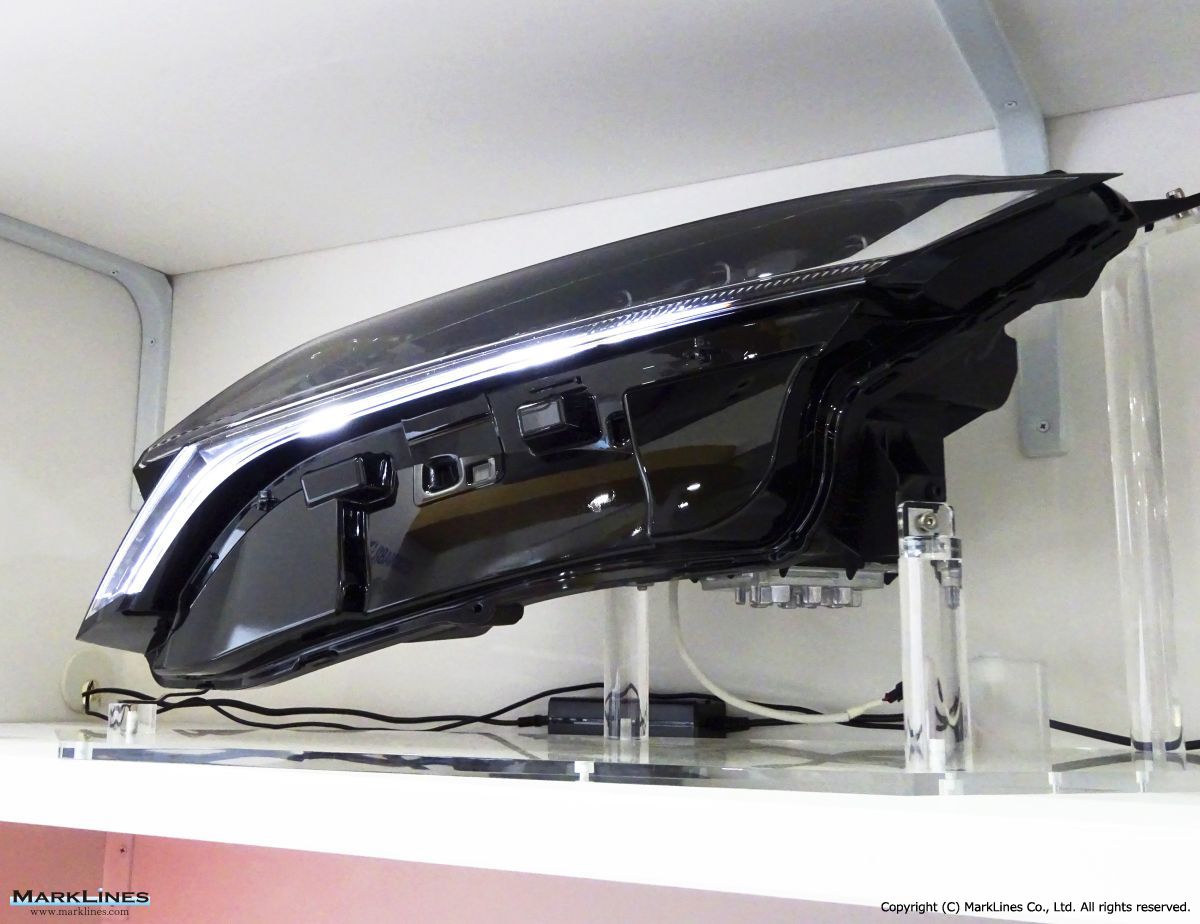
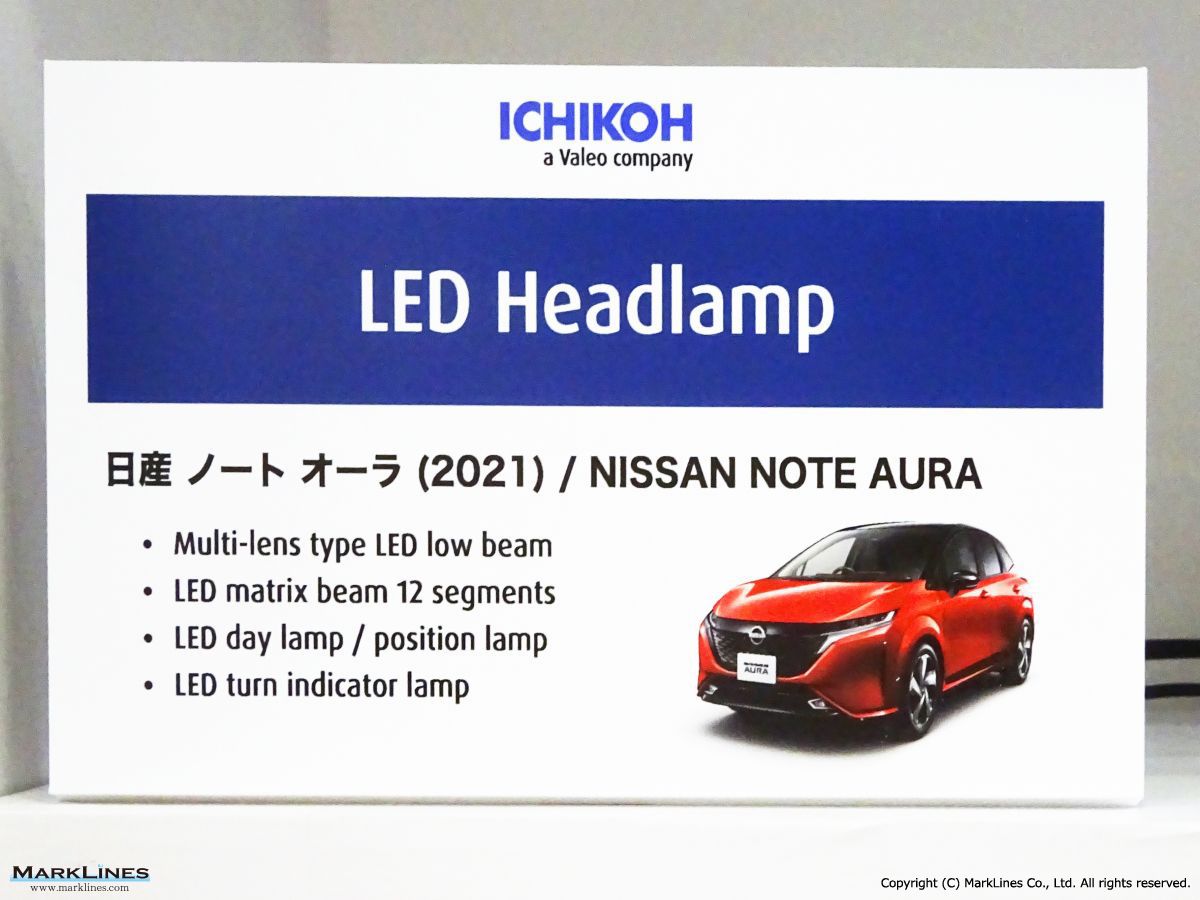
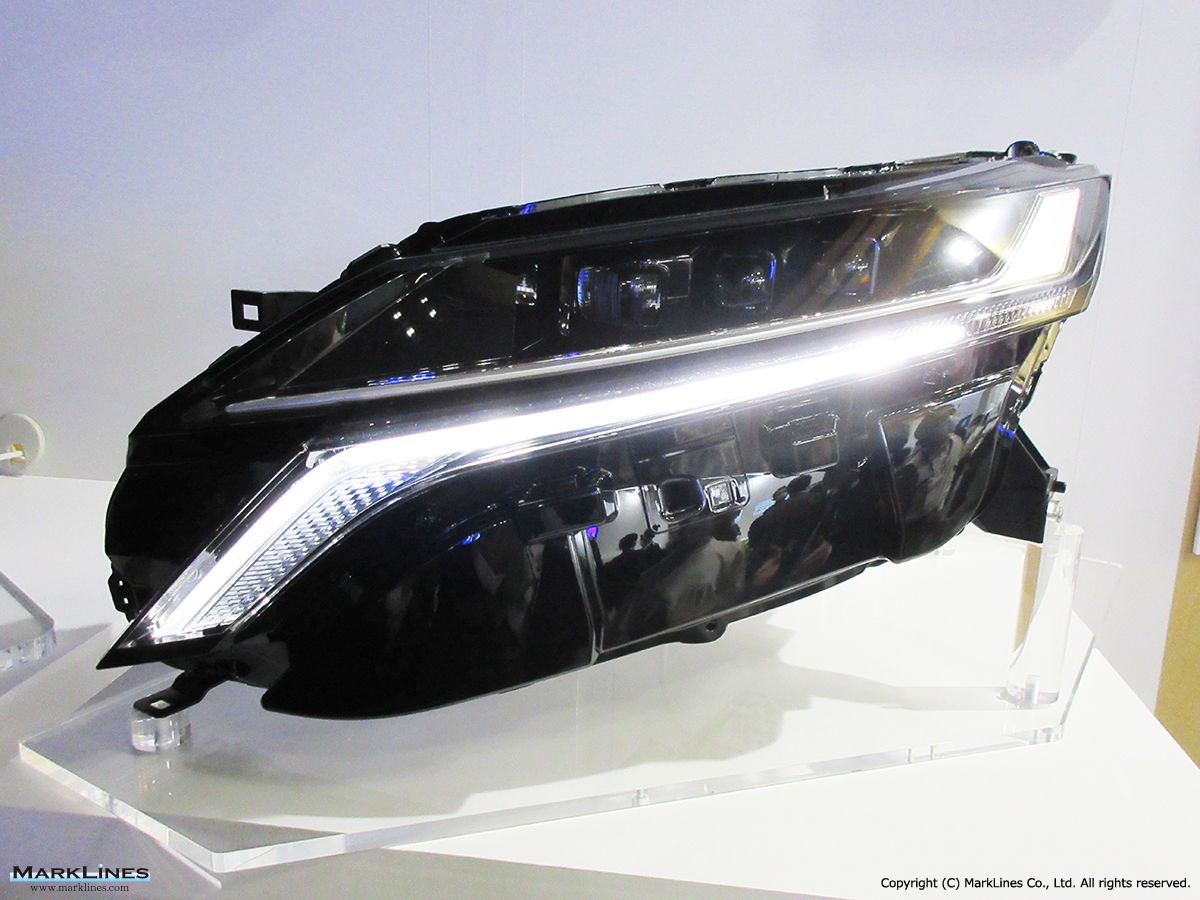
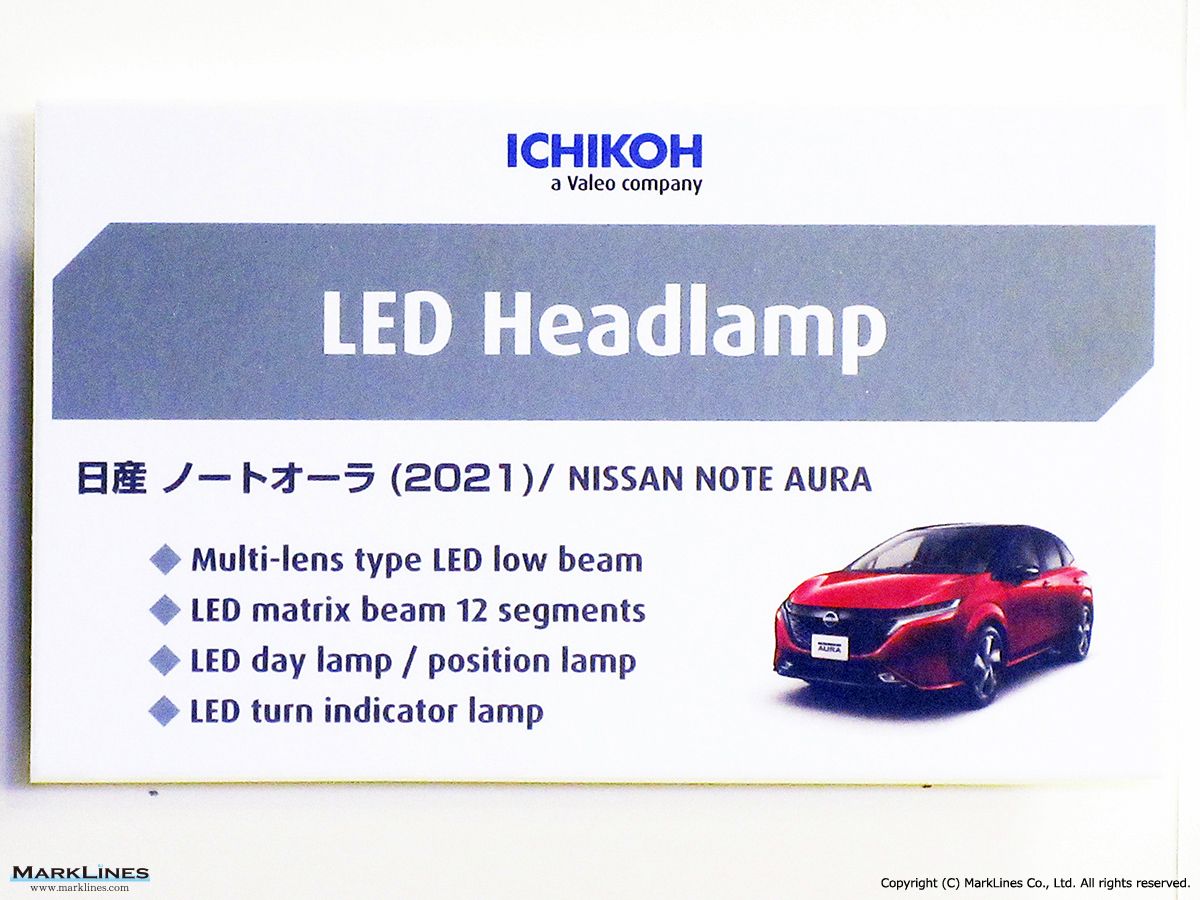
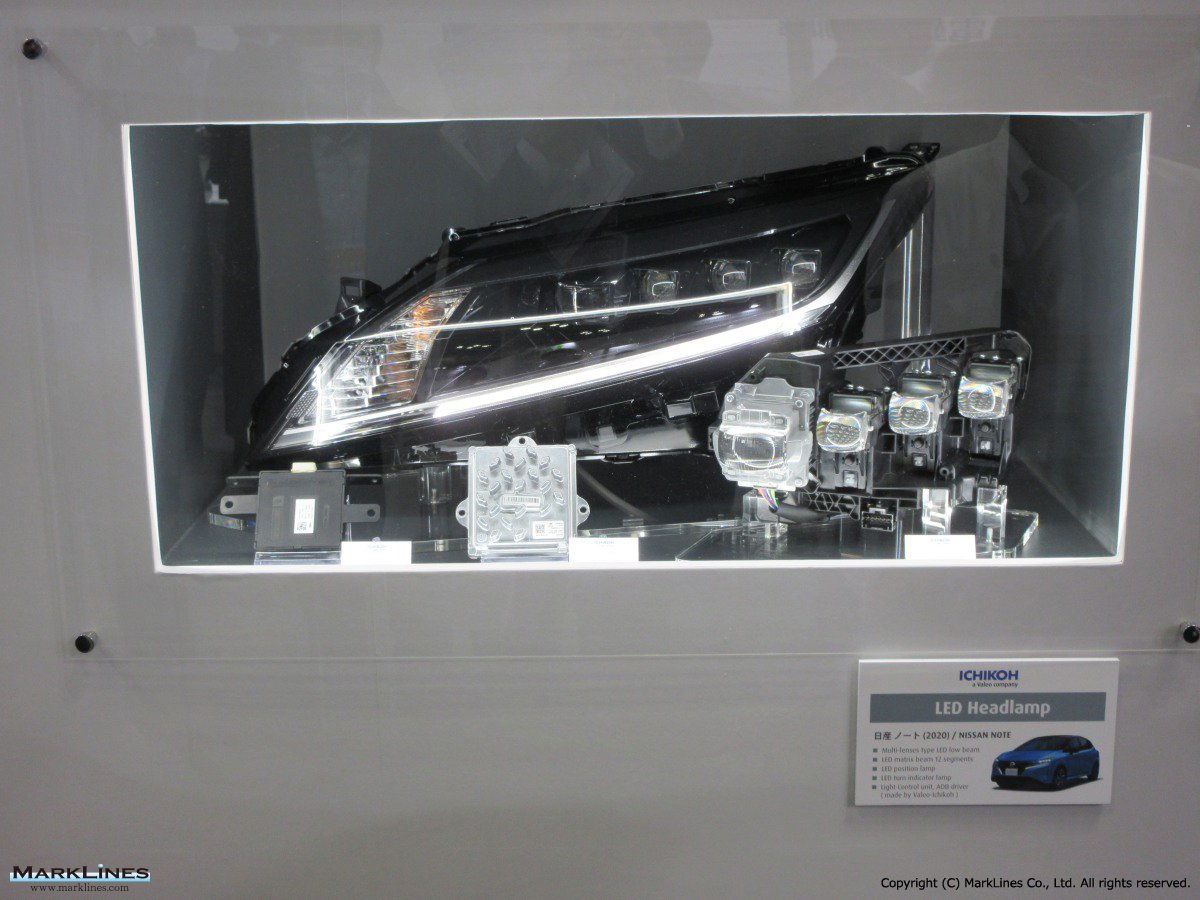
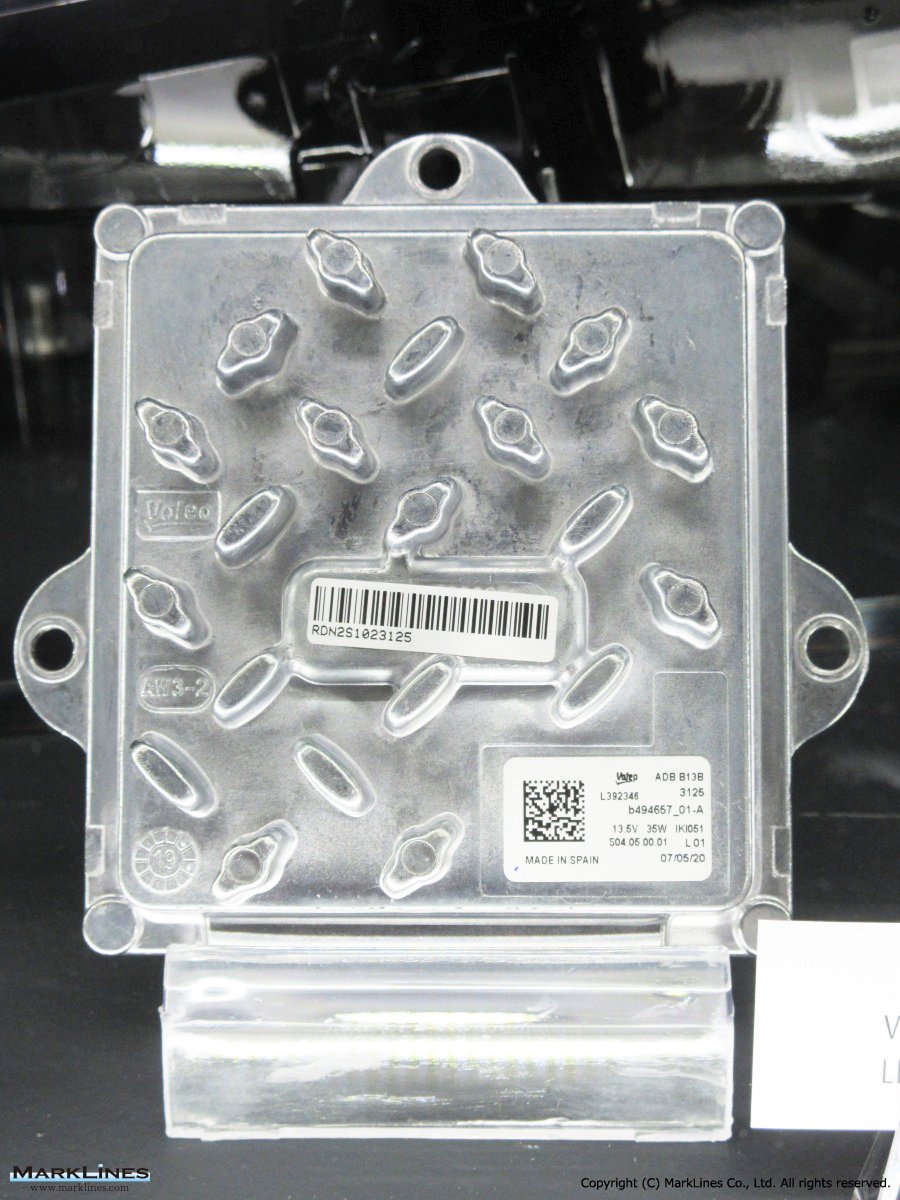
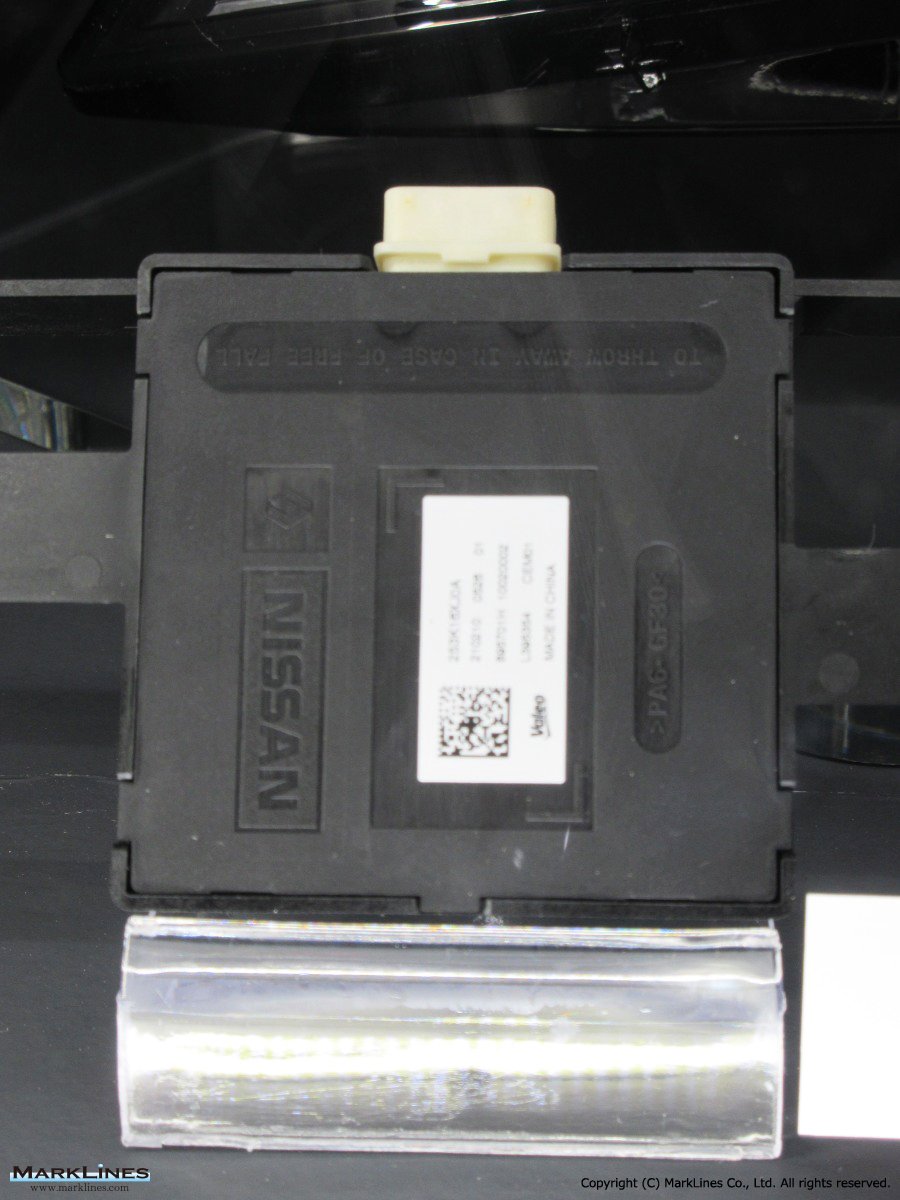
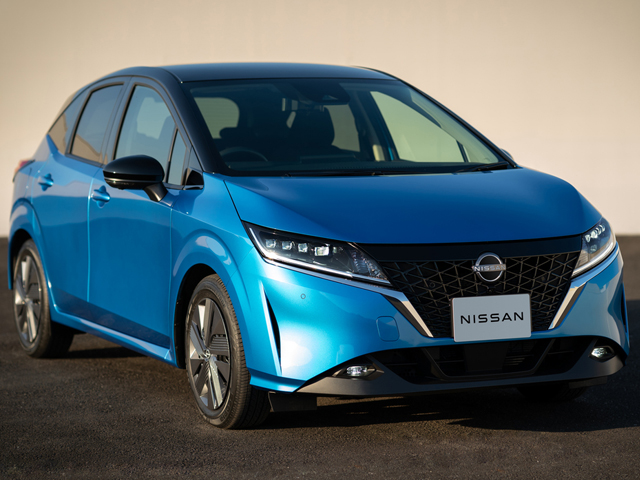
LED headlamp
 2
2
LED head lamp
 5
5
LED headlamp
 6
6
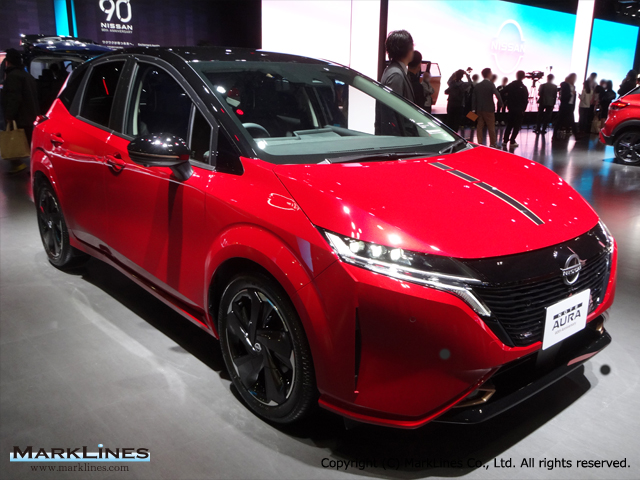
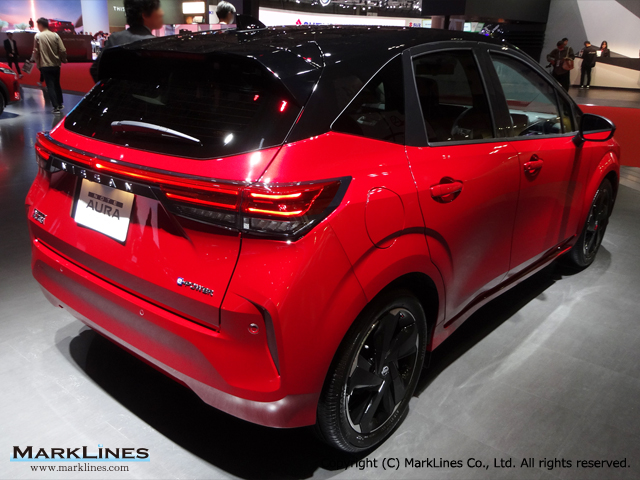
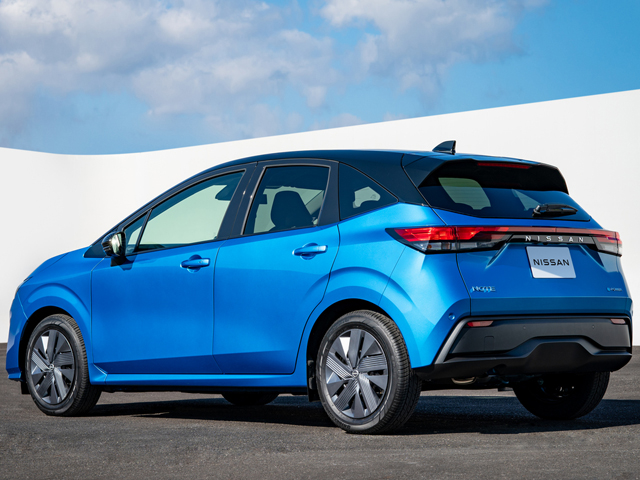
Note/Note Aura
 2
2
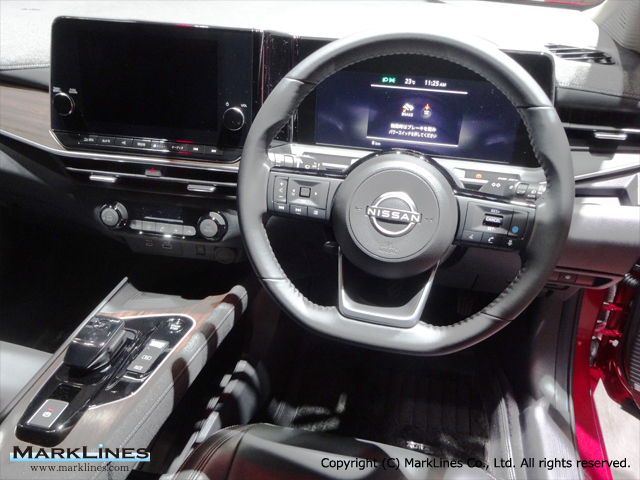
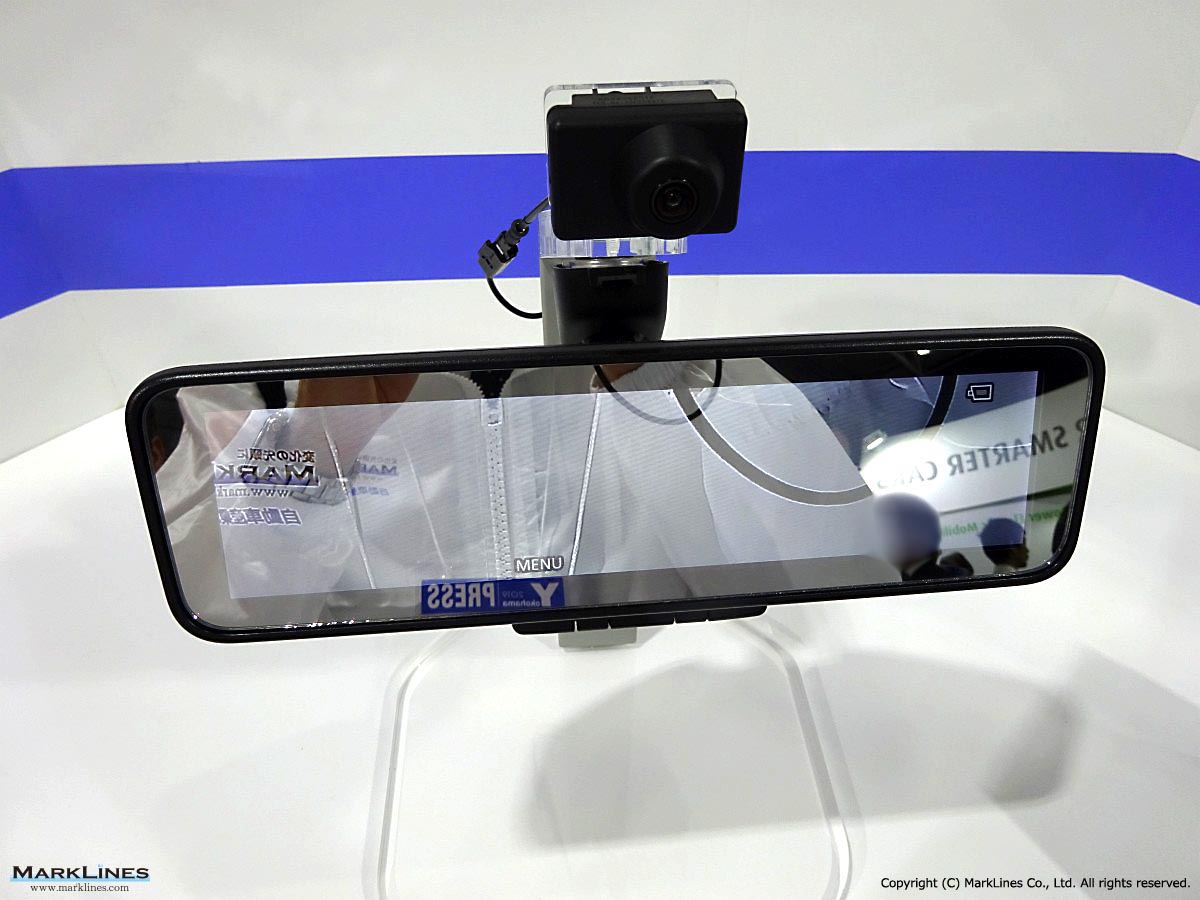
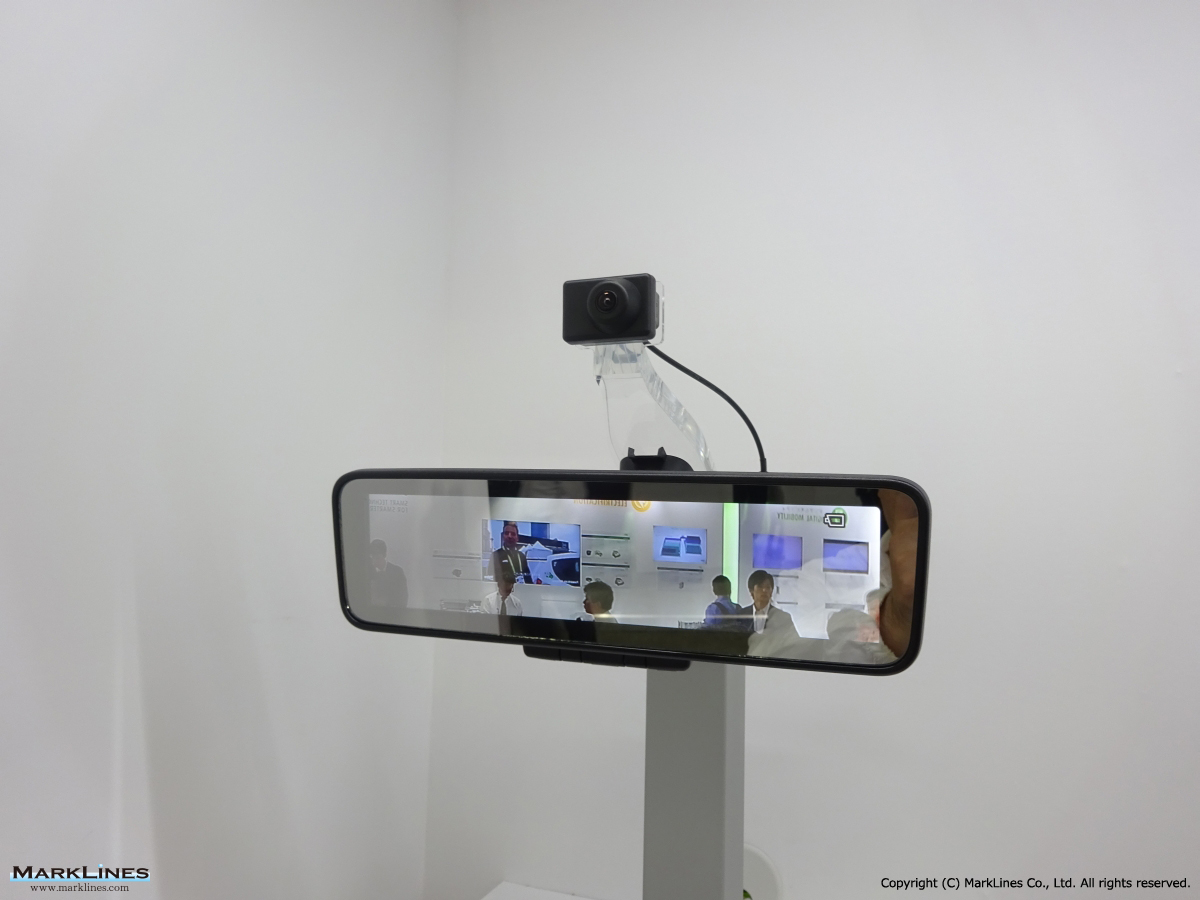
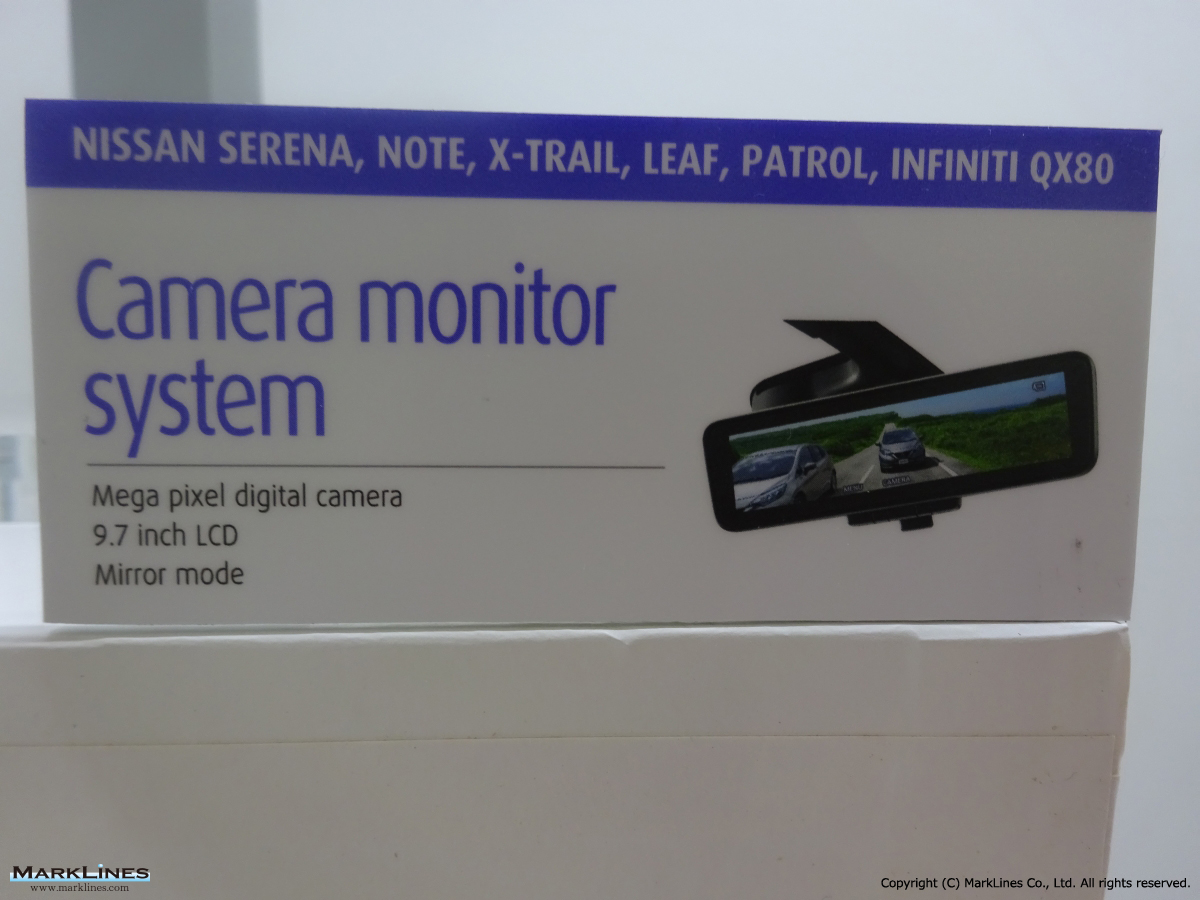
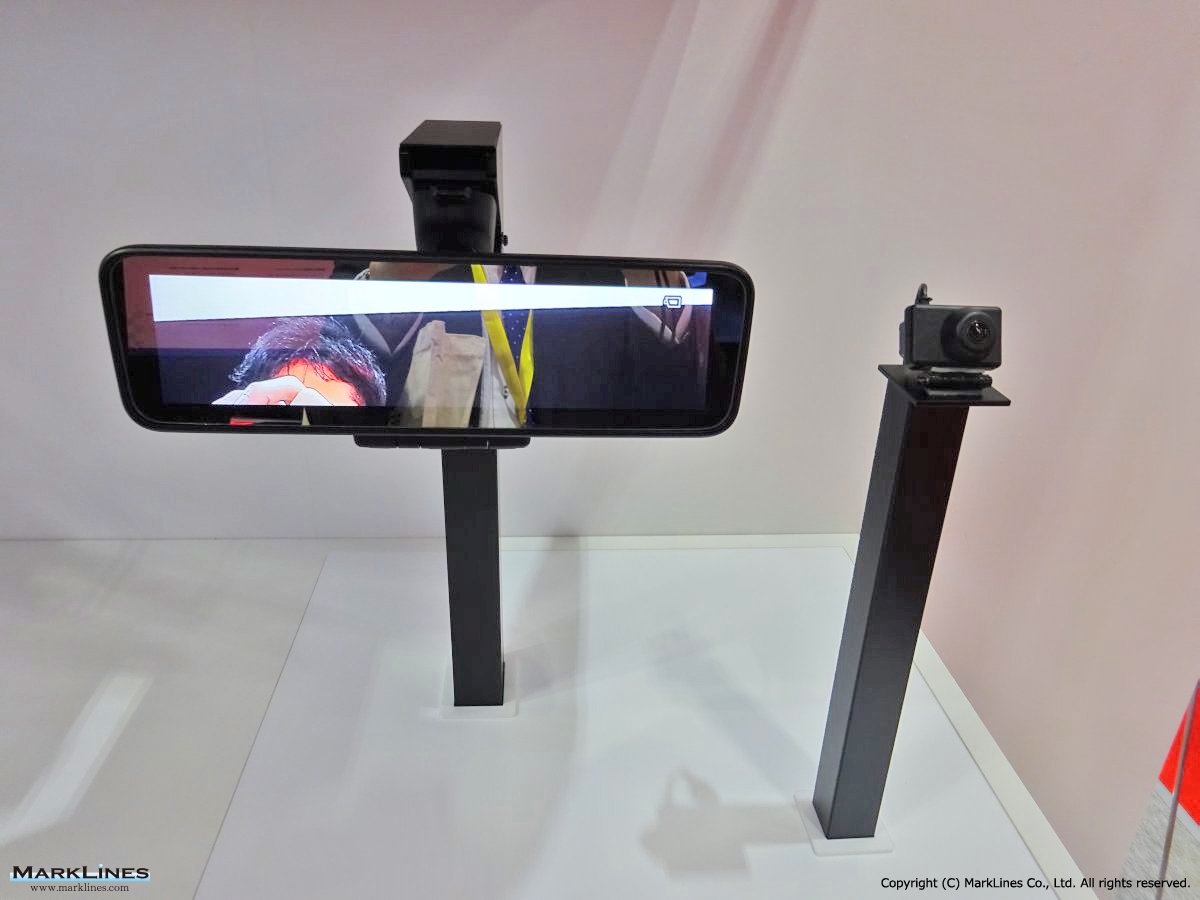
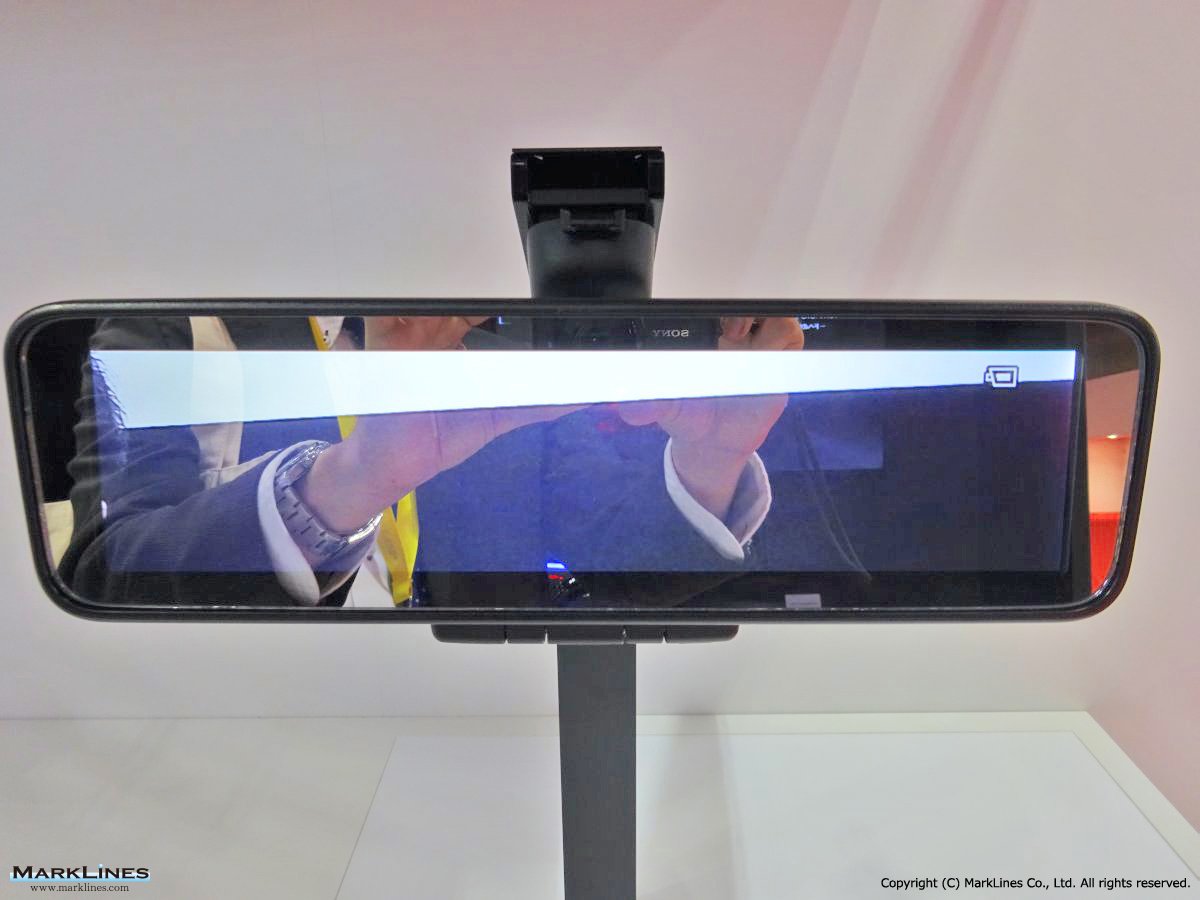
Camera monitor system
 6
6
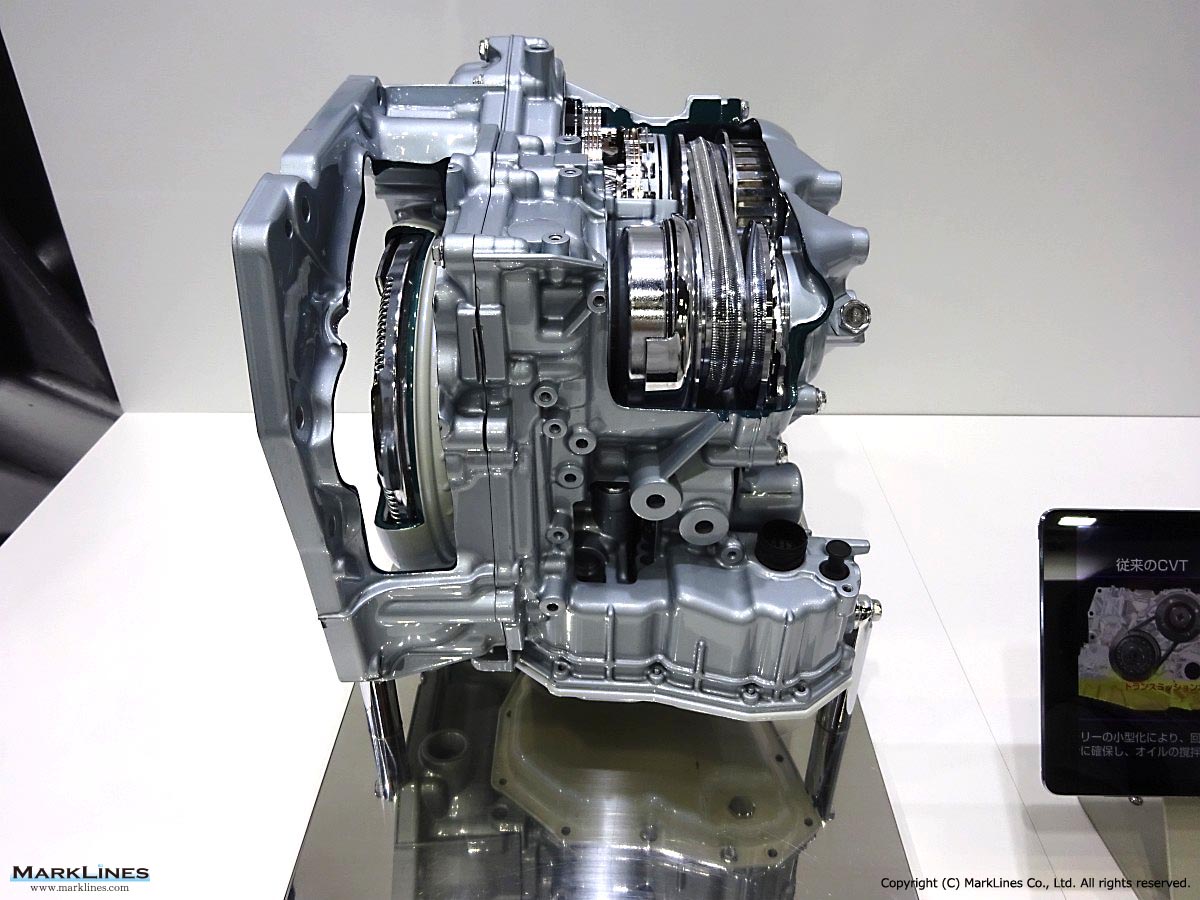
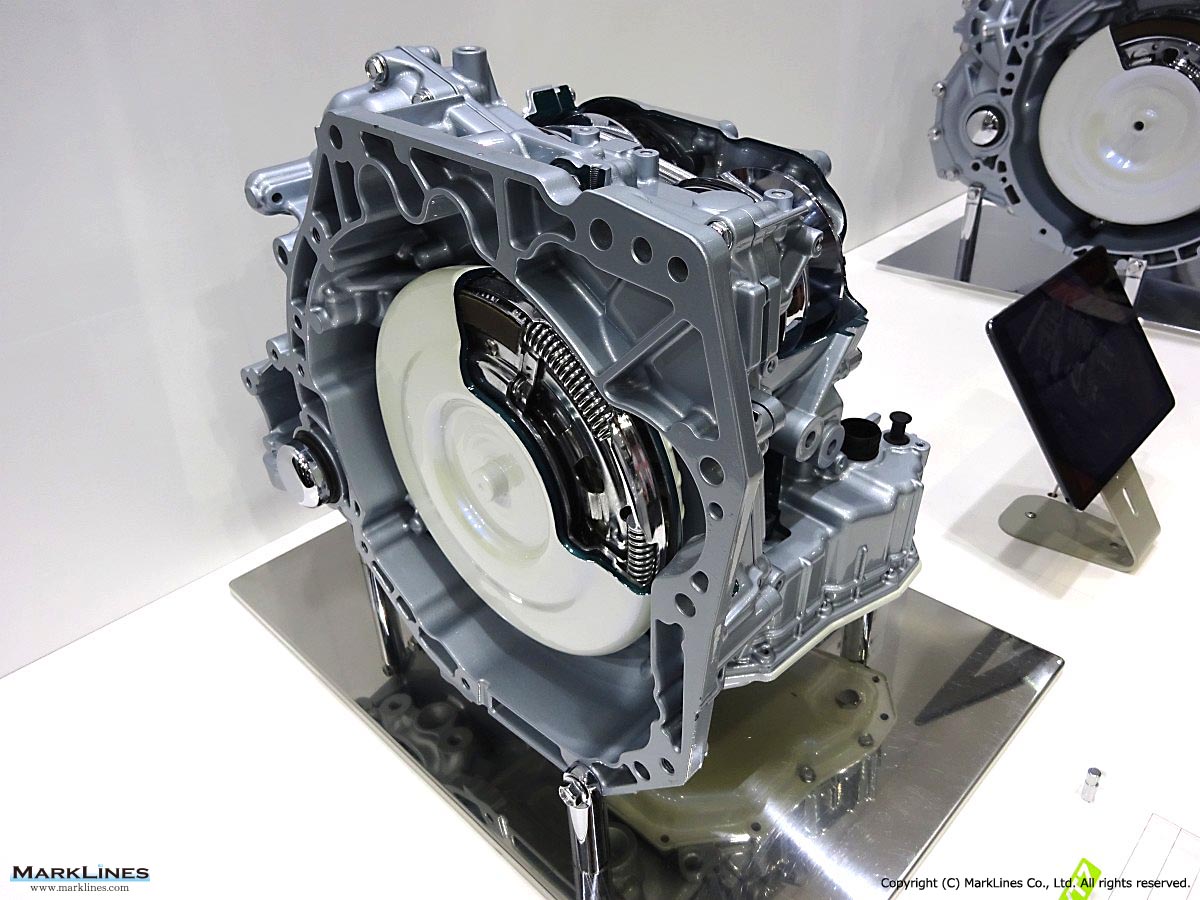
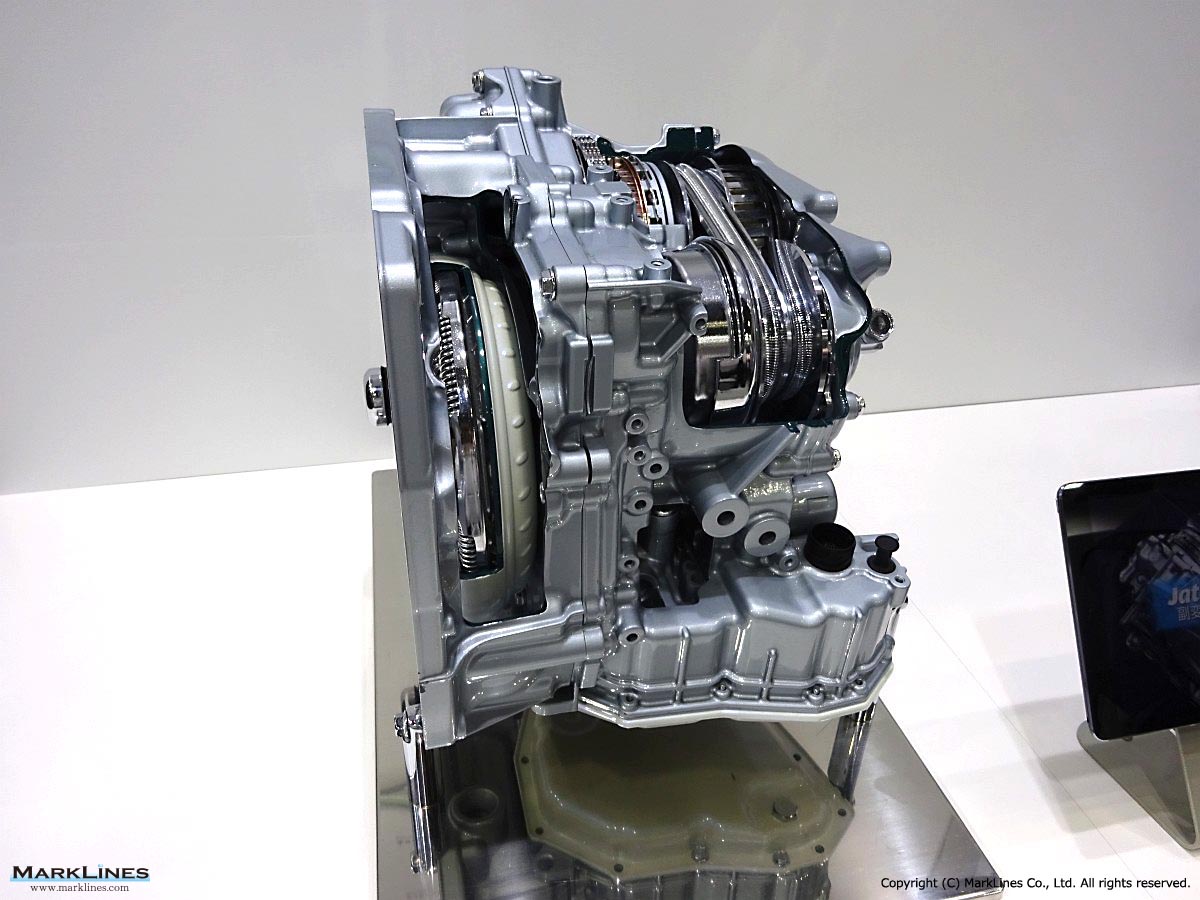
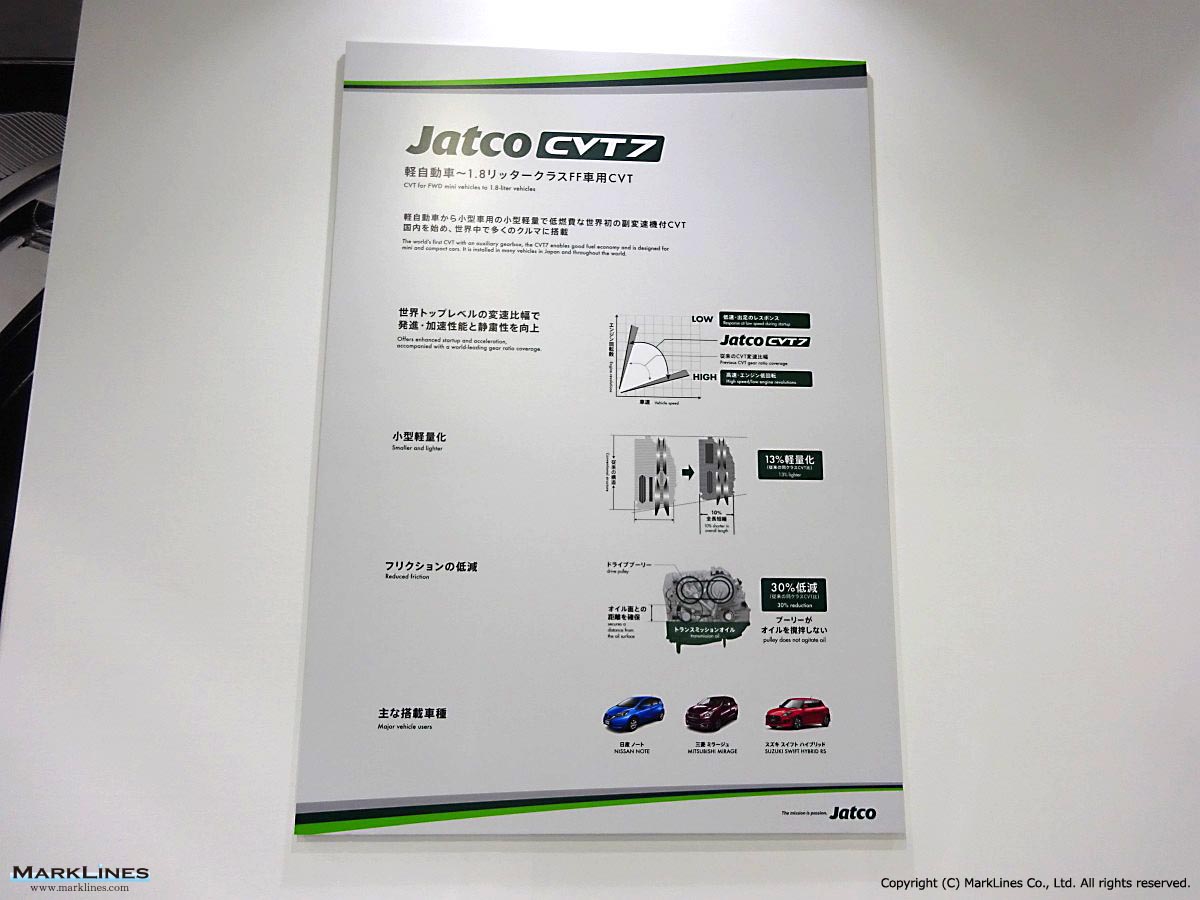
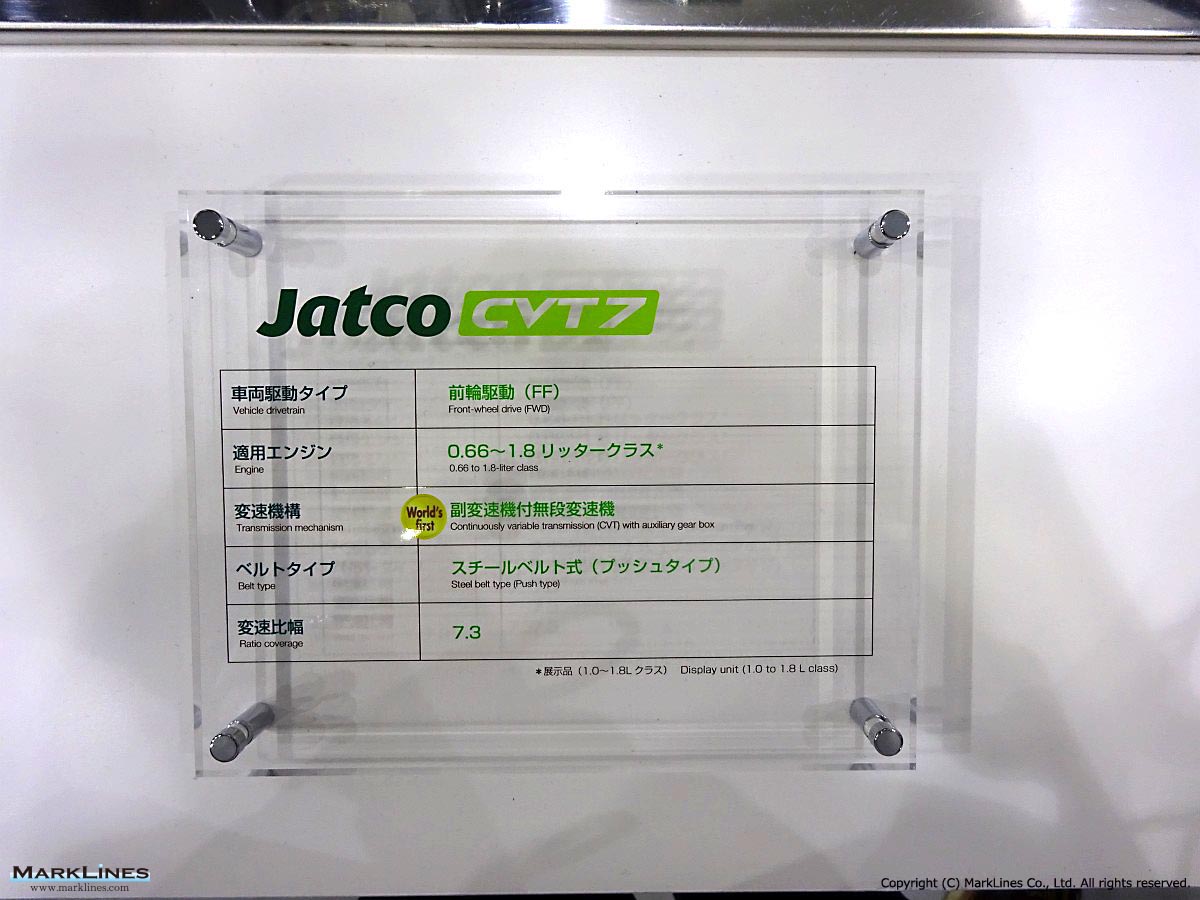
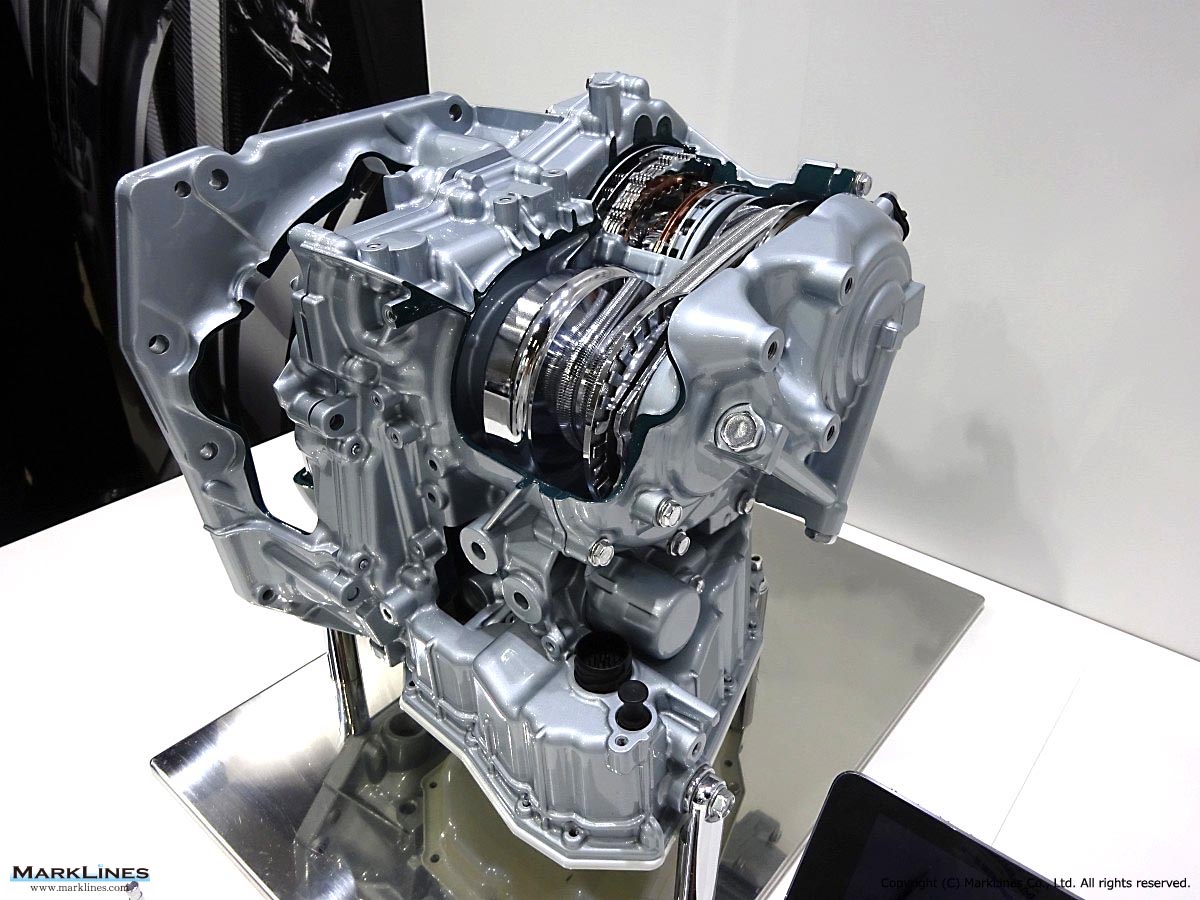
CVT7
 3
3
Camera monitor system
 1
1
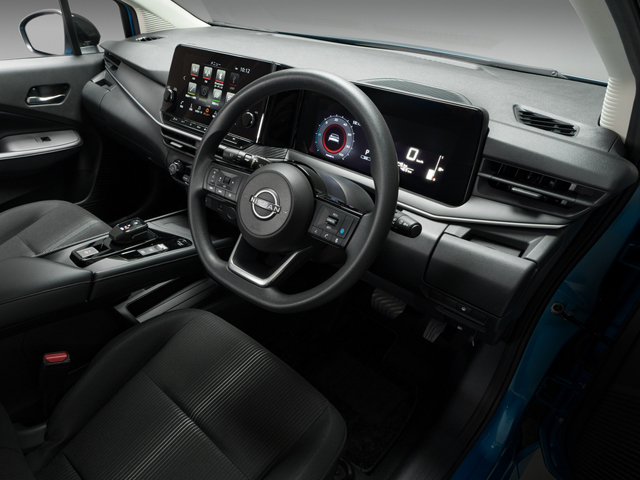
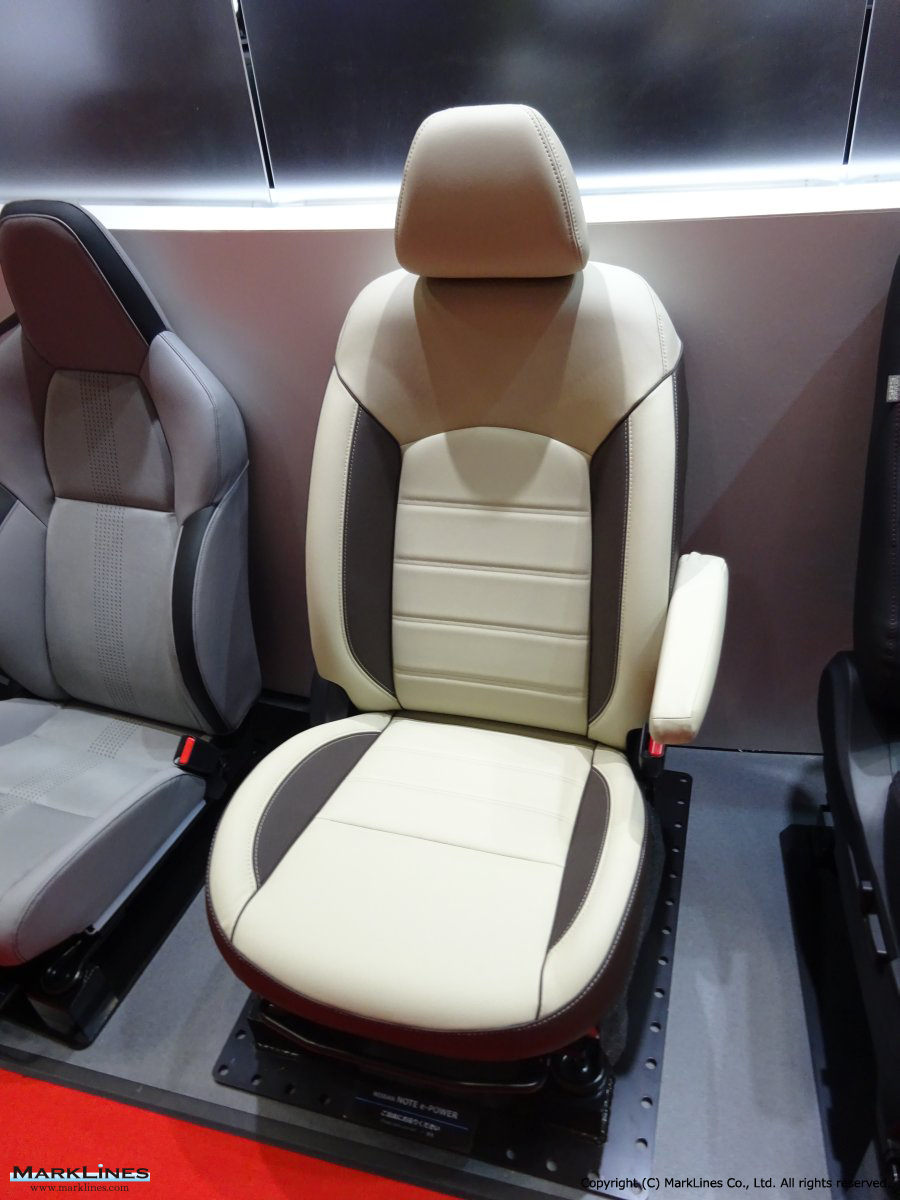
Seat
 3
3
Camera Monitor System
Sort by :
1 - 20 of 35 results
Data changes for Sales Statistics
otivePrevious Group: GM GroupNew Group: SAIC (Shanghai Automotive Industry Corporation (Group)) October 29, 2025 The "Hyundai/Inokom" and "Inokom" have been changed to "Hyundai". May 29, 2025 The "SEAT" is now listed separately as "SEAT" , "CUPRA" and "SEAT / CUPRA" March 7, 2025 The "Renault-Nissan" group has been changed and is now listed separately as "Renault" and "Nissan."As a result, the maker/brand group has also been changed. See he...
Automotive Sales Data Updated at: 2026/05/27
China - New car sales in 2026 by OEM, model, vehicle type
.8 -40.0 8.7 0.9 -30.8 Passenger Cars Total 212.9 84.3 -4.2 806.3 84.2 -6.7 Commercial Vehicles Total 39.7 15.7 8.1 151.1 15.8 6.5 Grand Total 252.6 100.0 -2.5 957.4 100.0 -4.8 Source:Created by MarkLines based on press releaseNew vehicle sales by brands (Factory shipments) (NOTE) The below chart includes estimates. Apr. 2026 Jan.-Apr. 2026 Units(10,000) Share(%) Y-o-Y(%) Units(10,000) Share(%) Y-o-Y(%) Chinese bra...
Automotive Sales Data Updated at: 2026/05/25
Representative models for each segment
erica Europe China Japan Other Sedan/Hatchback A (Basic) Fiat 500, JAC E10X, Auteco D2S Fiat Panda, Hyundai i10, Kia Morning BYD Seagull, Wuling Hongguang MINIEV, Changan Lumin Honda N-BOX, Suzuki Spacia, Daihatsu Tanto Suzuki Wagon R, Perodua Axia, Fiat Mobi B (Small) Chevrolet Aveo, Kia Soul, Nissan March (Micra) Renault Clio, Dacia Sandero, Peugeot 208 Geely Xingyuan, BYD Dolphin, Wuling Bingo/Binguo Toyota ROOMY, Suzuki Solio/Wagon R+, Ni...
Automotive Sales Data Updated at: 2026/03/10
Philippines - New car sales in 2025 by vehicle type
launches, especially in electrified and commercial vehicles.Within CAMPI–TMA sales for 2025, Toyota Motor Philippines Corp. led the market with a 49.49% share, followed by Mitsubishi Motors Philippines Corp. at 18.72%. Suzuki Philippines Inc. held 4.74%, Ford Motor Co. Philippines Inc. 4.70%, and Nissan Philippines Inc. 4.44%. Philippines - Sales of new vehicles Type Dec. 2025 Dec. 2024 Y-o-Y Jan. -Dec. 2025 Jan. -Dec. 2024 Y-o-Y Passenger...
Automotive Sales Data Updated at: 2026/02/26
China - New car sales in 2025 by OEM, model, vehicle type
7 34.3 1.0 25.3 Passenger Cars Total 284.7 87.0 -8.7 3,010.3 87.5 9.2 Commercial Vehicles Total 42.5 13.0 15.3 429.6 12.5 10.9 Grand Total 327.2 100.0 -6.2 3,440.0 100.0 9.4 Source:Created by MarkLines based on press release New vehicle sales by brands (Factory shipments) (NOTE) The below chart includes estimates. Dec. 2025 Jan.-Dec. 2025 Units (10,000) Share(%) Y-o-Y(%) Units (10,000) Share(%) Y-o-Y(%) Chinese b...
Automotive Sales Data Updated at: 2026/02/10
Mexico - New car sales in 2025 by OEM, vehicle type
nstituto Nacional de Estadistica y Geografia (INEGI) reported sales of 154,450 light vehicles in December 2025, representing a 5.0% increase from the 147,140 sales in December 2024.In 2025, Mexican light vehicle sales increased 1.4% to 1,524,638 units, from the 1,504,322 units sold in 2024.In 2025, Nissan sold 274,461 units, an increase of 7.6% from the previous year.General Motors sales of 198,153 units in 2025 decreased 3.4% from 2024.Volkswage...
Automotive Sales Data Updated at: 2026/02/06
USA - New car sales in 2025 by OEM, model, vehicle type
USA - New car sales in 2025 by OEM, model, vehicle type Flash report, Automotive sales volume, 2025 Jan. Feb. Mar. Apr. May Jun. Jul. Aug. Sep. Oct. Nov. Dec. Flash report, December 2025 Jan 6, 2026 U.S. auto sales down 1.5% in December, up 2.7% for 2025 full year to 16.39 million unitsNote: Some figures were updated on January 21.MarkLines' data compiled as of January 6, 2026, shows that U.S. new car sales for December 2025 were 1,476,588 units...
Automotive Sales Data Updated at: 2026/02/04
Spain - New car sales in 2025 by OEM
0% 4.4% -0.5 pt MG Total 3,198 3,434 -6.9% 45,163 30,770 46.8% Share 3.1% 3.3% -0.2 pt 3.9% 3.0% 0.9 pt SKODA Total 3,448 4,978 -30.7% 42,387 38,255 10.8% Share 3.3% 4.7% -1.4 pt 3.7% 3.8% -0.1 pt AUDI Total 4,776 3,357 42.3% 41,260 38,770 6.4% Share 4.6% 3.2% 1.5 pt 3.6% 3.8% -0.2 pt NISSAN Total 2,606 2,624 -0.7% 34,711 31,519 10.1% Share 2.5% 2.5% 0.0 pt 3.0% 3.1% -0.1 pt CITROEN Total 2,393 2,060 16.2% 34,286 38,475 -10.9% ...
Automotive Sales Data Updated at: 2026/02/03
Japan - New car sales in 2025 by OEM, model, vehicle type
the sales volume of tractors and cranes made in Japan.Therefore, the figures on the data are different.Japanese new vehicle sales in December increase 1.7% y/y to 335.5K units, 2025 sales volume increase 3.3% to 4.6 million units, Daihatsu, Suzuki, and Mazda saw double-digit growth, while Honda and Nissan experienced double-digit declines, resulting in contrasting fortunesAccording to the Japan Automotive Dealers Association and Japan Light Motor...
Automotive Sales Data Updated at: 2026/02/02
Japan - New car sales in 2024 by OEM, model, vehicle type
vehicles Total (Breakdown by vehicle type) Brands 2024 2023 Y-o-Y 2024 2023 Y-o-Y Dec. Share Dec. Share Jan.-Dec. Share Jan.-Dec. Share Toyota 95,072 45.1% 107,892 46.4% -11.9% 1,339,108 46.8% 1,548,594 51.0% -13.5% Honda 25,034 11.9% 27,778 12.0% -9.9% 380,099 13.3% 275,722 9.1% 37.9% Nissan 18,955 9.0% 19,703 8.5% -3.8% 286,723 10.0% 291,046 9.6% -1.5% Suzuki 9,403 4.5% 8,607 3.7% 9.2% 131,861 4.6% 118,860 3.9% 10.9% Mazda 7,70...
Automotive Sales Data Updated at: 2025/07/02
China - New car sales in 2024 by OEM, model, vehicle type
.0 27.4 0.9 3.5 Passenger Cars Total 312.0 89.4 11.7 2,756.3 87.7 5.8 Commercial Vehicles Total 36.9 10.6 1.2 387.3 12.3 -3.9 Grand Total 348.9 100.0 10.5 3,143.6 100.0 4.5 Source:Created by MarkLines based on press release New vehicle sales by brands (Factory shipments) (NOTE) The below chart includes estimates. Dec. 2024 Jan.-Dec. 2024 Units (10,000) Share(%) Y-o-Y(%) Units (10,000) Share(%) Y-o-Y(%) Chinese b...
Automotive Sales Data Updated at: 2025/07/02
Canada - Flash report, Automotive sales volume, 2023
tuation brought on by vehicle model availability affected by supply chain issues that had made it the worst October since 2009.However, this October’s results have now made it 12 consecutive months of sales increases compared to the previous year, prompting Andrew King, Managing Partner of DAC to note that “The market has been on a tear the last 3 months with gains close to 20% each month.” The SAAR for October came in at 1.79 million – t...
Automotive Sales Data Updated at: 2025/06/04
South Africa - Flash report, Automotive sales volume, 2023
ther undermining the new vehicle market’s ability to full recovery. New vehicle sales increased by only 0.5% year-on-year in 2023 to 532,098 units compared to the 529,556 units in 2022 and will likely now take four years to recover to the pre-pandemic level of 536,612 units in 2019. On a positive note, heavy commercial vehicle sales already exceeded the pre-pandemic level in 2022, supported by the transport of goods forced onto roads due to the...
Automotive Sales Data Updated at: 2025/06/04
Japan - Flash report, Automotive sales volume, 2023
Association, Japan Light Motor Vehicle and Motorcycle Association Non-mini vehicles Total (Breakdown by vehicle type) Brands 2023 2022 Y-o-Y 2023 2022 Y-o-Y Dec. Share Dec. Share Jan.-Dec. Share Jan.-Dec. Share Toyota 107,892 46.4% 93,874 44.9% 14.9% 1,548,594 51.0% 1,217,128 47.5% 27.2% Nissan 19,703 8.5% 20,167 9.6% -2.3% 291,046 9.6% 272,020 10.6% 7.0% Honda 27,778 12.0% 22,108 10.6% 25.6% 275,722 9.1% 269,034 10.5% 2.5% Mazda 8...
Automotive Sales Data Updated at: 2025/06/04
USA - Flash report, Automotive sales volume, 2023
USA - Flash report, Automotive sales volume, 2023 Flash report, Automotive sales volume, 2023 Jan. Feb. Mar. Apr. May Jun. Jul. Aug. Sep. Oct. Nov. Dec. Flash report, December 2023 Jan 4, 2024 U.S. car sales up 13.0% in December, up 12.3% for full-year 2023Note: Some figures were updated on Jan. 11.U.S. light vehicle sales in December of 1,454,597 units were up 13.0% as compared to the same month in 2022.Truck and SUV sales increased 15.7% from ...
Automotive Sales Data Updated at: 2025/06/04
China - Flash report, Automotive sales volume, 2023
5 26.5 0.9 -18.1 Passenger Cars Total 279.2 88.5 23.3 2,606.3 86.6 10.6 Commercial Vehicles Total 36.4 11.5 25.1 403.1 13.4 22.1 Grand Total 315.6 100.0 23.5 3,009.4 100.0 12.0 Source:Created by MarkLines based on press releaseNew vehicle sales by brands (Factory shipments) (NOTE) The below chart includes estimates. Dec. 2023 Jan.-Dec. 2023 Units (10,000) Share(%) Y-o-Y(%) Units (10,000) Share(%) Y-o-Y(%) Chinese b...
Automotive Sales Data Updated at: 2025/06/04
South Africa - Flash report, Automotive sales volume, 2022
cord fuel prices, as well as record highs in the frequency and intensity of load shedding weighed heavily on both business and consumer confidence. However, the new vehicle market’s performance in 2022 remained resilient despite the the multiple national and international headwinds. On a positive note, the lifting of all COVID-19 lockdown restrictions in the country in 2022 along with the recovery in business and leisure travel provided some su...
Automotive Sales Data Updated at: 2025/06/04
Japan - Flash report, Automotive sales volume, 2022
Association, Japan Light Motor Vehicle and Motorcycle AssociationNon-mini vehicles Total (Breakdown by vehicle type) Brands 2022 2021 Y-o-Y 2022 2021 Y-o-Y Dec. Share Dec. Share Jan.-Dec. Share Jan.-Dec. Share Toyota 93,874 44.9% 107,091 48.9% -12.3% 1,217,128 47.5% 1,388,960 49.7% -12.4% Nissan 20,167 9.6% 18,338 8.4% 10.0% 272,020 10.6% 274,291 9.8% -0.8% Honda 22,108 10.6% 22,039 10.1% 0.3% 269,034 10.5% 274,374 9.8% -1.9% Mazda ...
Automotive Sales Data Updated at: 2025/06/04
China - Flash report, Automotive sales volume, 2022
Mini Van 3.4 1.3 -17.1 32.3 1.2 -17.4 Passenger Cars Total 226.5 88.6 -6.7 2,356.3 87.7 9.5 Commercial Vehicles Total 29.1 11.4 -20.2 330.0 12.3 -31.2 Grand Total 255.6 100.0 -8.4 2,686.4 100.0 2.1 Source : MarkLines Data Center New vehicle sales by brands (Factory shipments) (NOTE) The below chart includes estimates. Dec. 2022 Jan.-Dec. 2022 Units (10,000) Share(%) Y-o-Y(%) Units (10,000) Share(%) Y-o-Y(%) Chinese b...
Automotive Sales Data Updated at: 2025/06/04
Japan - Flash report, Automotive sales volume, 2021
mini vehicles Total (Breakdown by vehicle type) Brands 2021 2020 Y-o-Y 2021 2020 Y-o-Y Dec. Share Dec. Share Jan.-Dec. Share Jan.-Dec. Share Toyota 107,091 48.9% 116,630 47.8% -8.2% 1,388,960 49.7% 1,423,151 49.4% -2.4% Honda 22,039 10.1% 20,989 8.6% 5.0% 274,374 9.8% 293,800 10.2% -6.6% Nissan 18,338 8.4% 21,041 8.6% -12.8% 274,291 9.8% 266,289 9.2% 3.0% Mazda 12,308 5.6% 10,501 4.3% 17.2% 126,251 4.5% 141,446 4.9% -10.7% Suzuki 6...
Automotive Sales Data Updated at: 2025/06/04


 Japan
Japan USA
USA Mexico
 Germany
 China (Shanghai)
 Thailand
 India
India