


Search Results by Category
All information related to {{ key_word }}.
AI Navigator will guide you. Click here for information about {{ key_word }}.
Images
 3
3
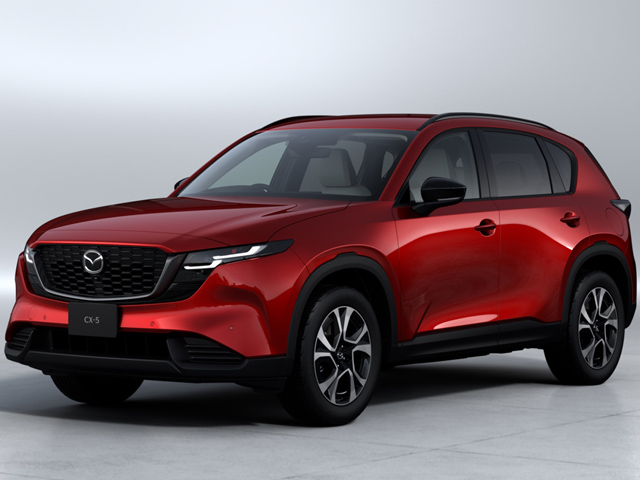
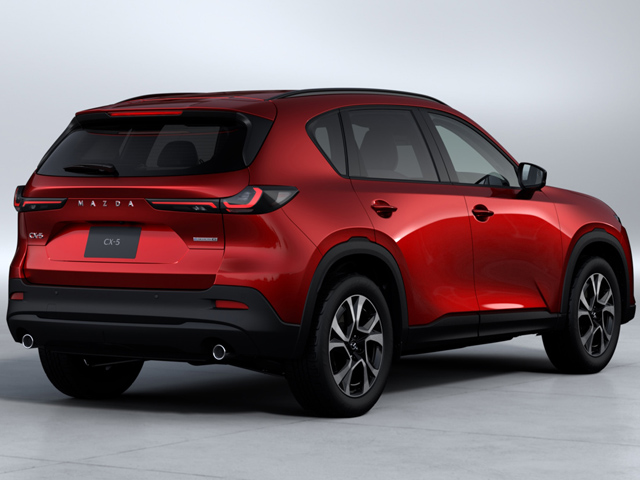
CX-5
 2
2
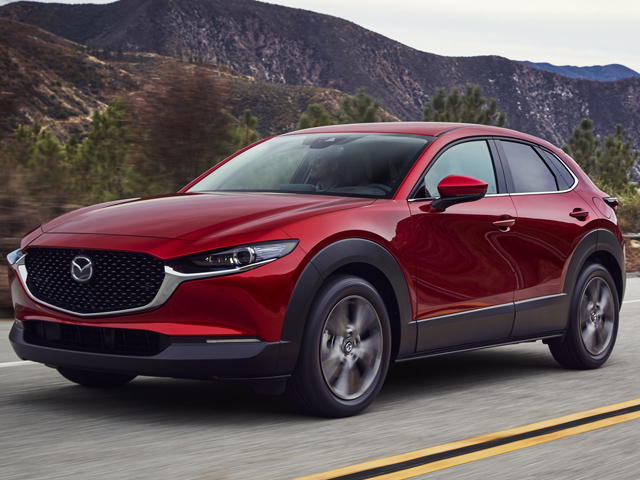
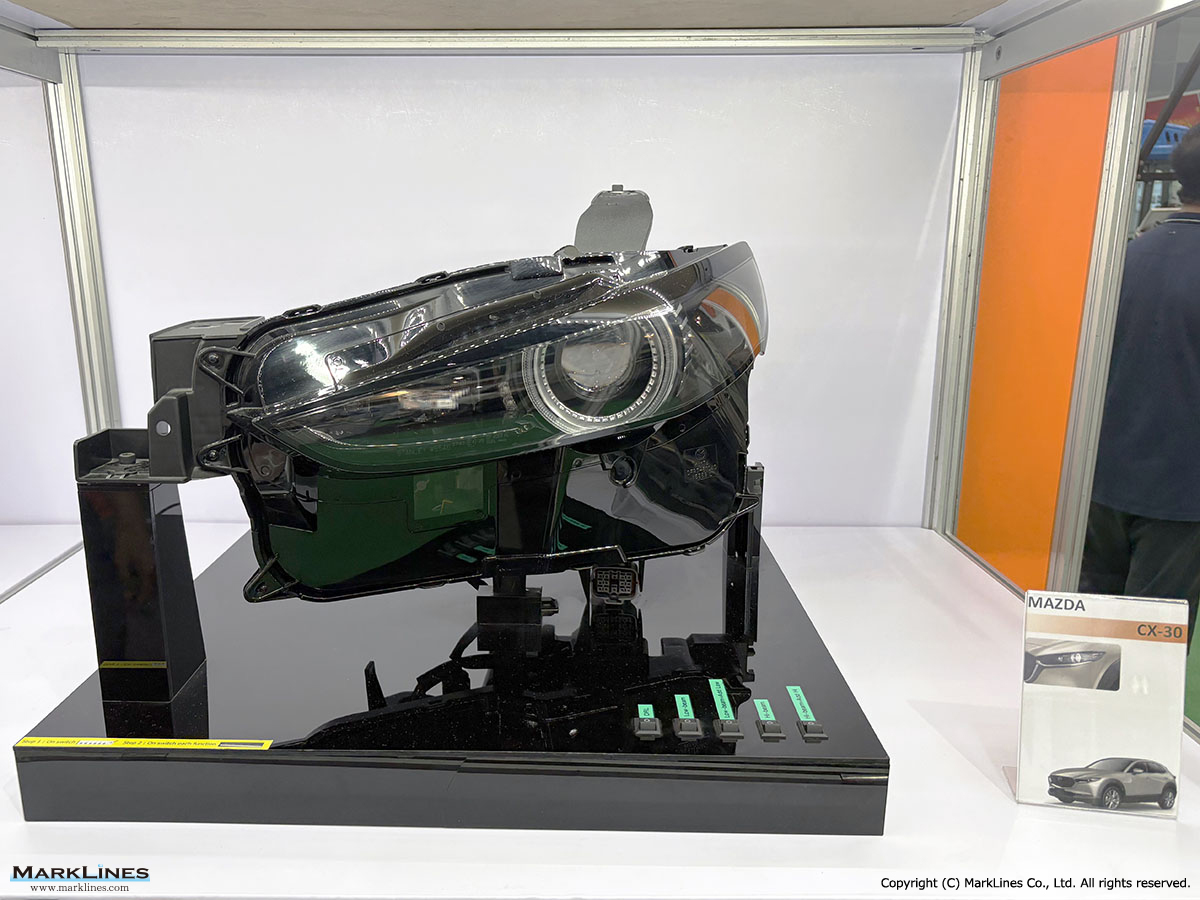
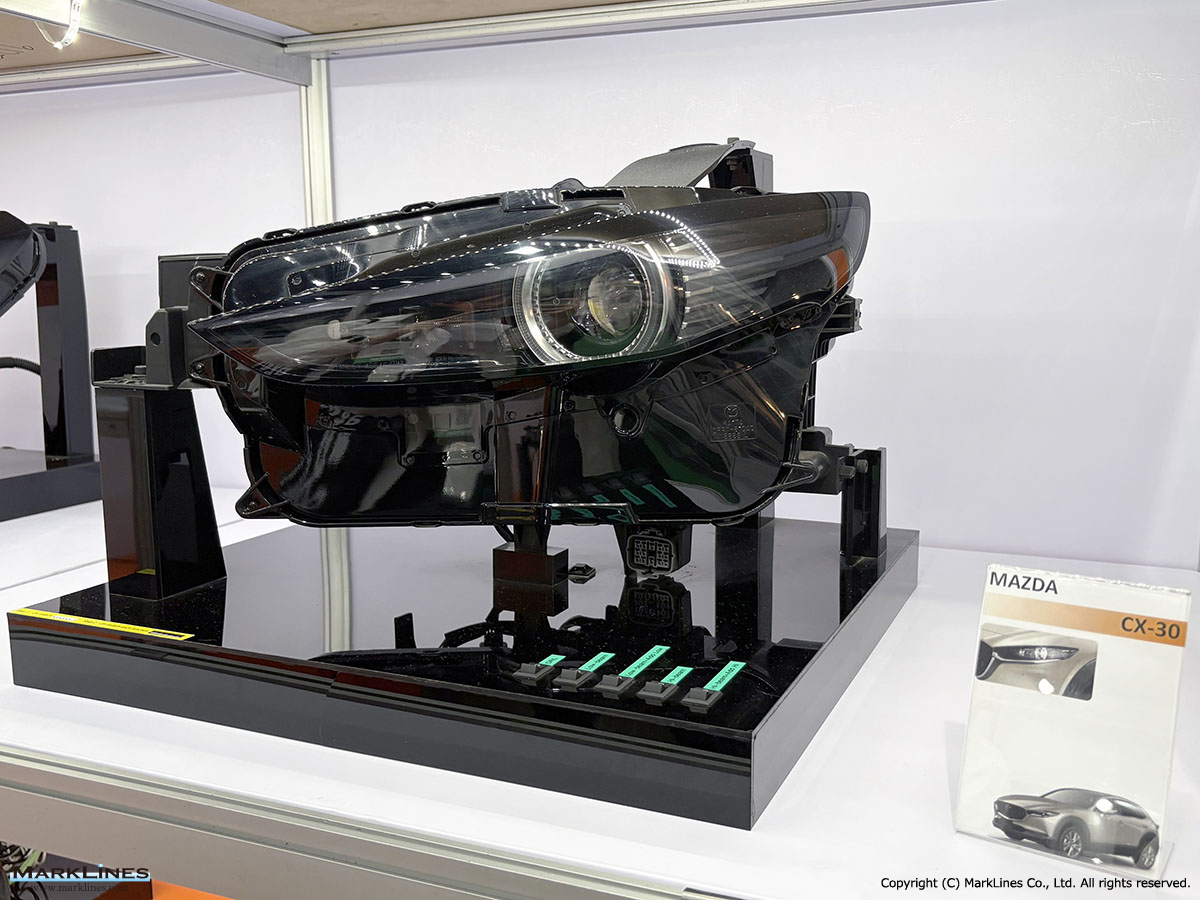
Headlamp for Mazda CX-30
 3
3
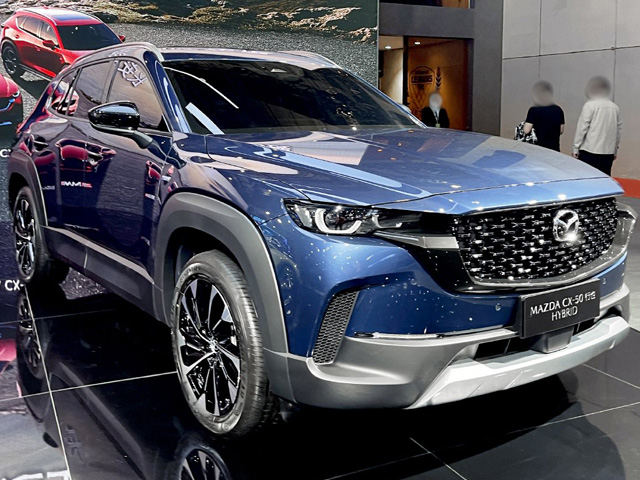
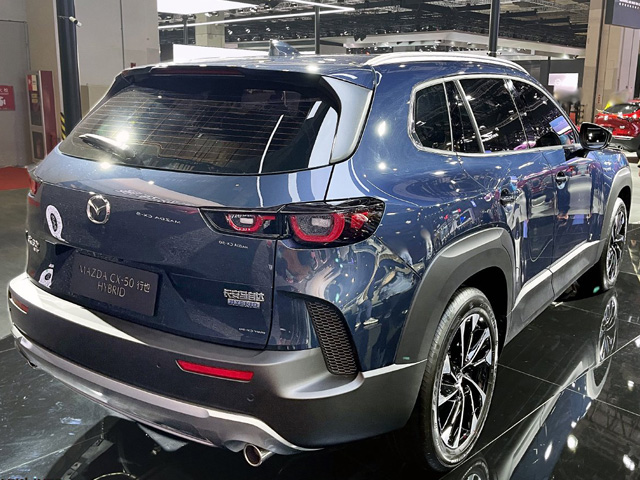
CX-50 Hybrid
 8
8
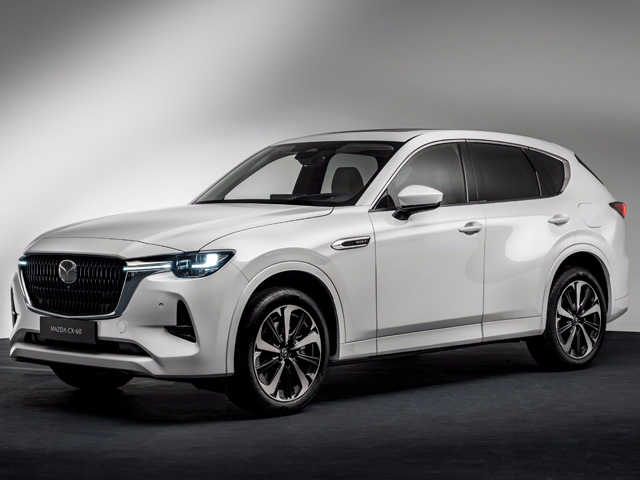
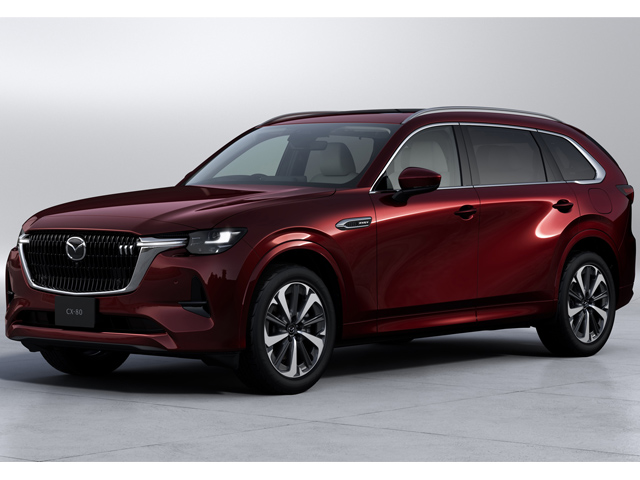
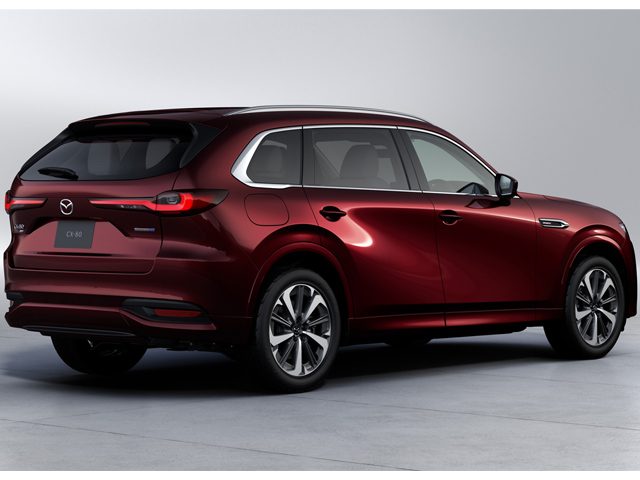
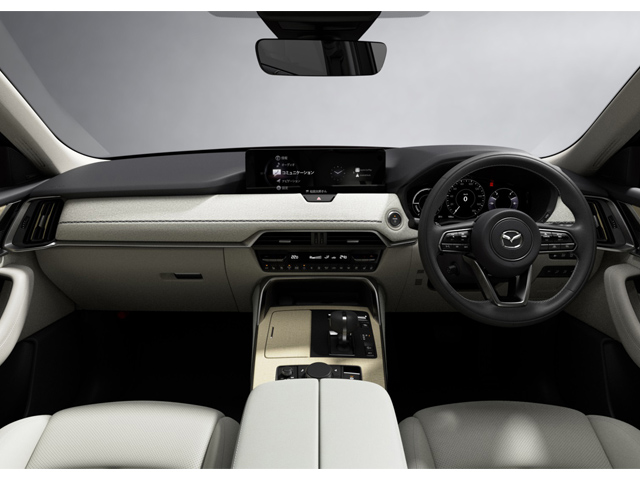
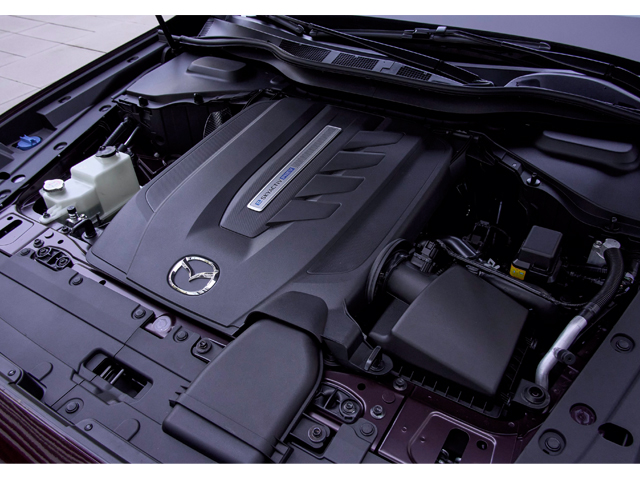
CX-60/CX-80 PHEV
 8
8
CX-60/CX-80 XD-HYBRID
 6
6
CX-70/CX-90 PHEV
 6
6
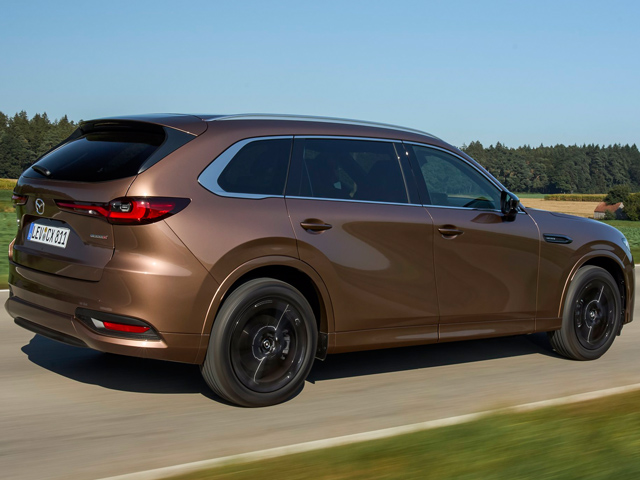
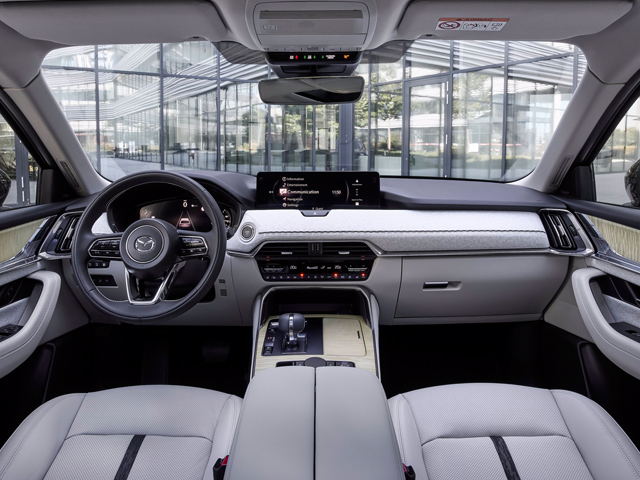
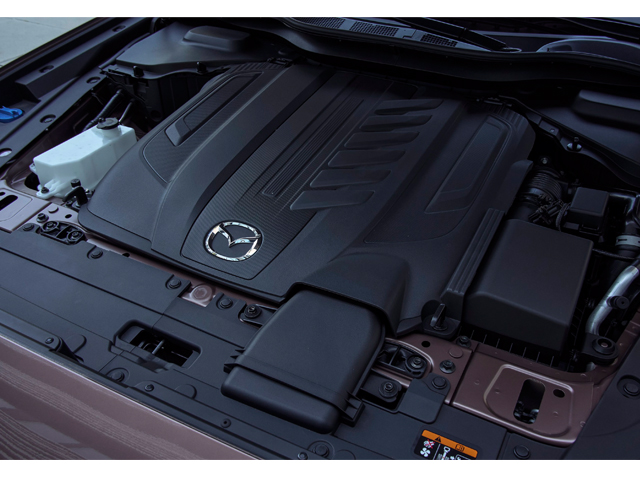
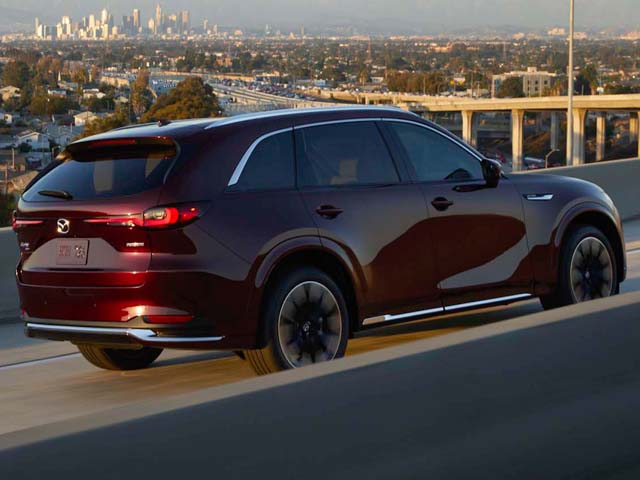
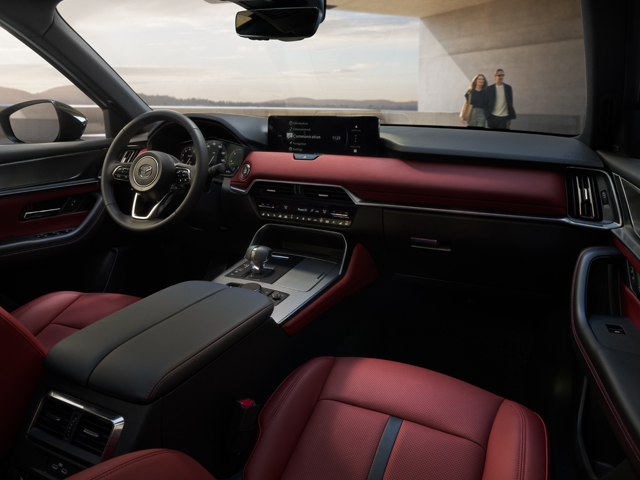
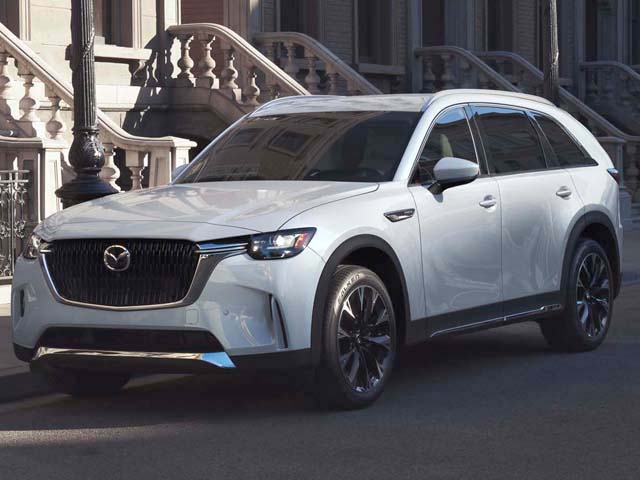
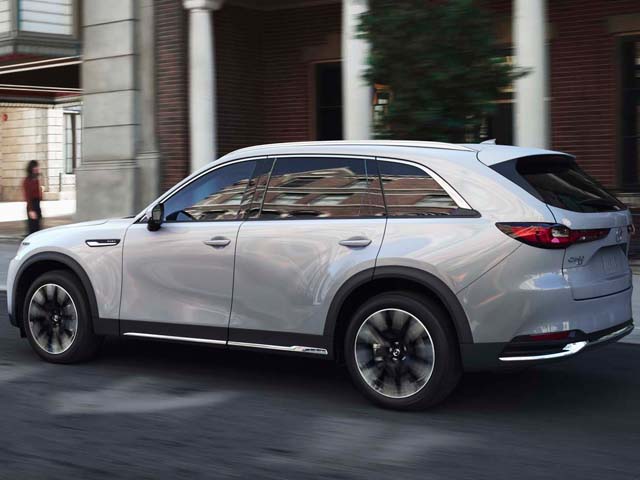
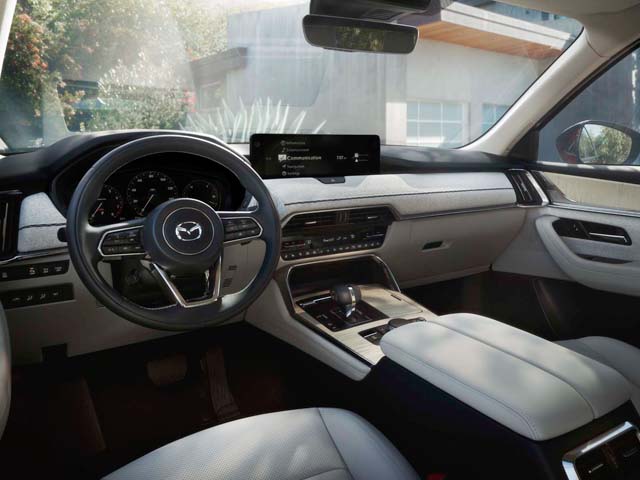
CX-70/CX-90
 3
3
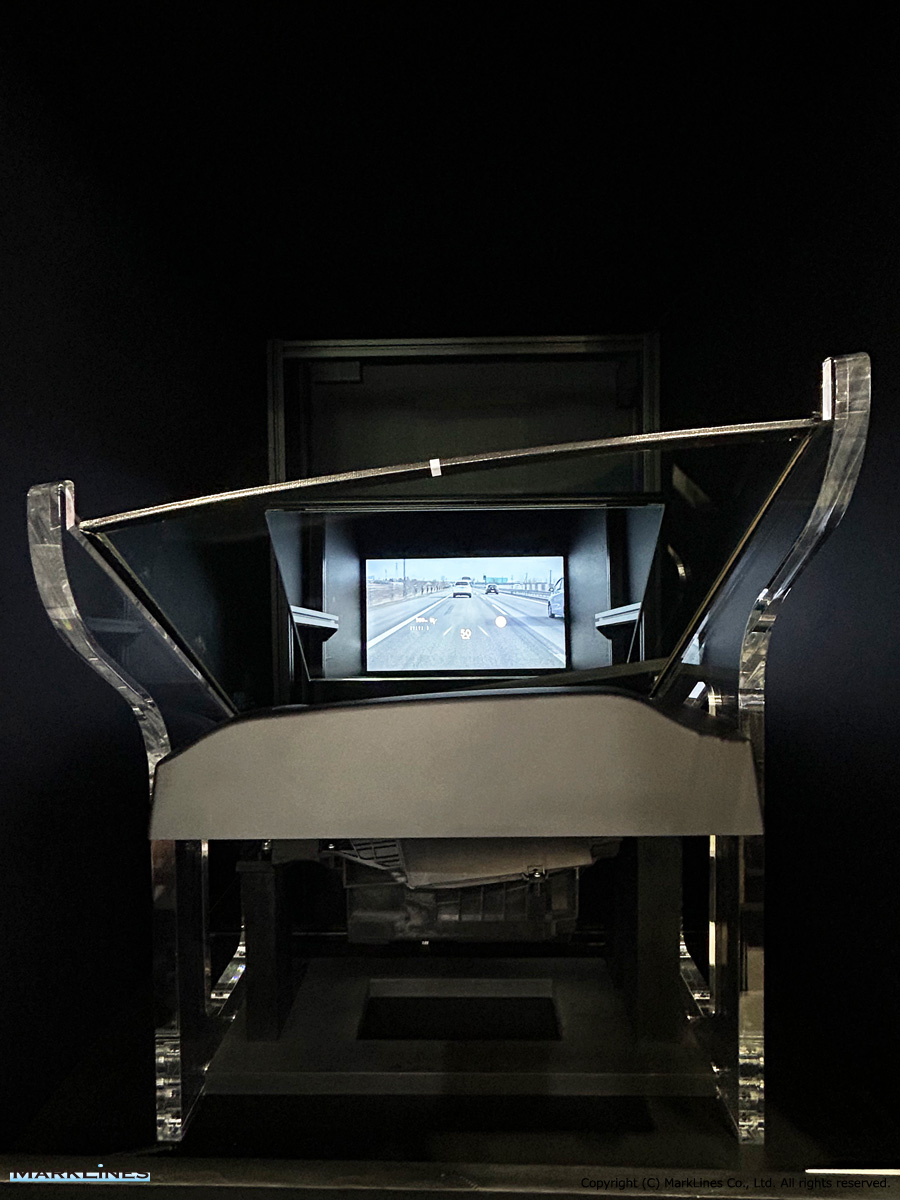
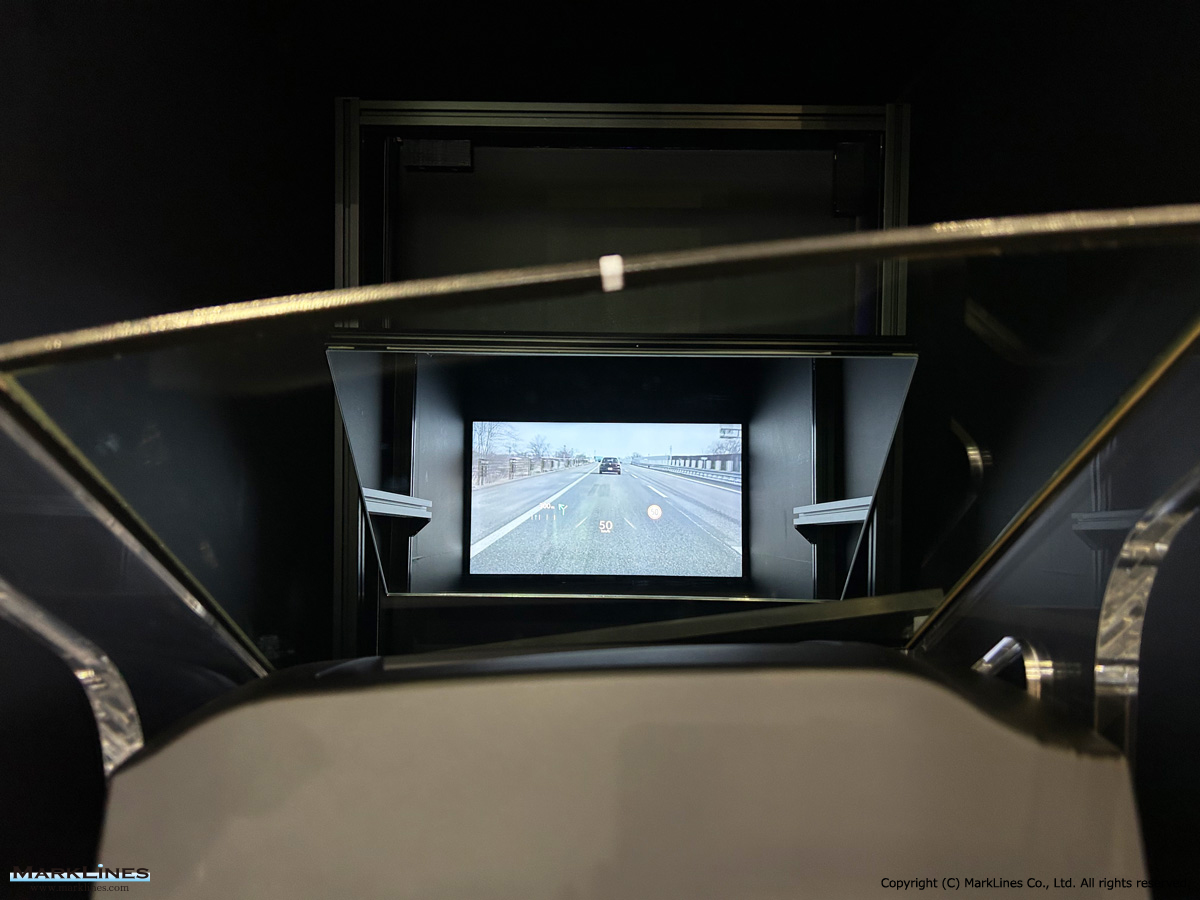
HUD (Head up display)
 4
4
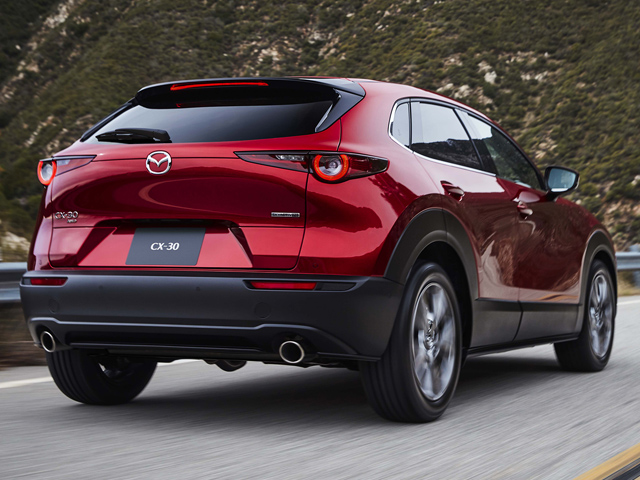
CX-30
 1
1
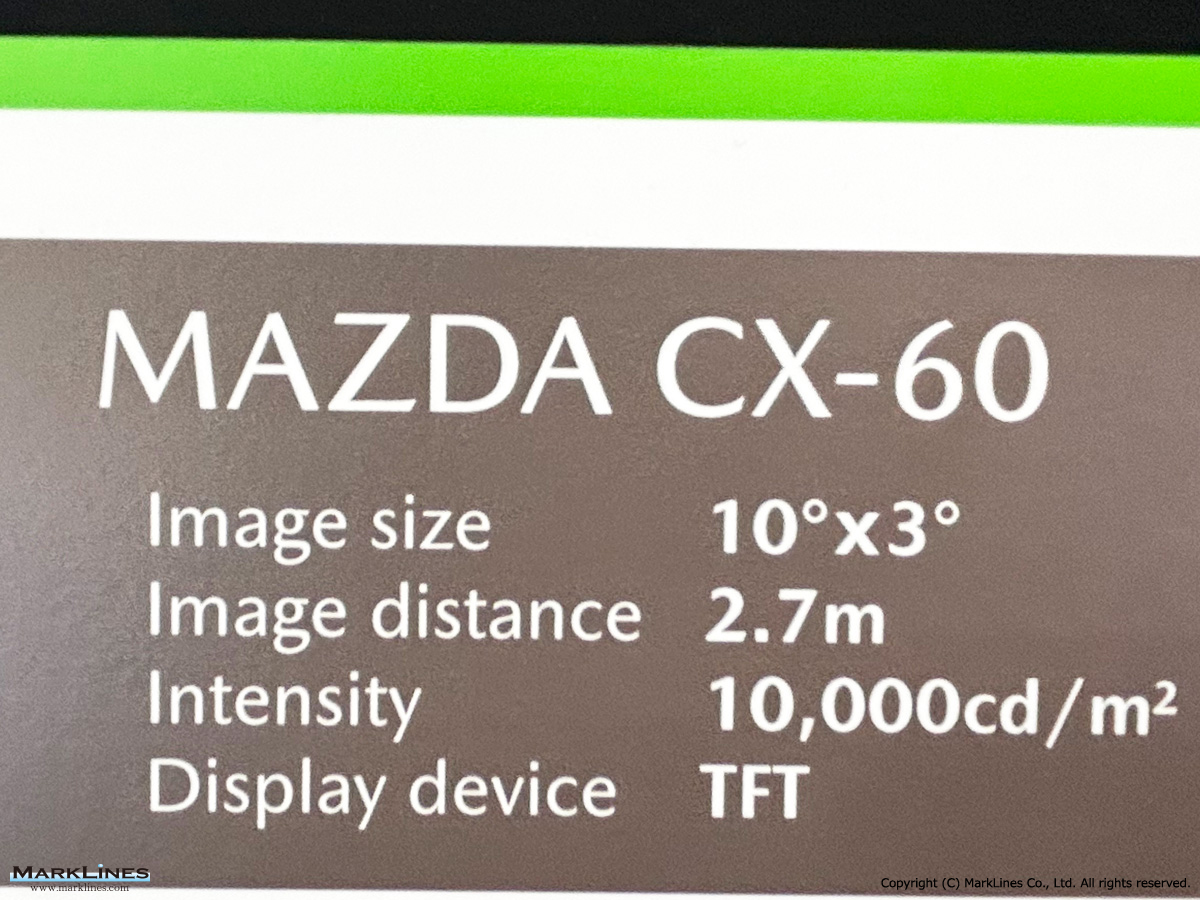
AR-HUD (Head-Up Display)
Sort by :
1 - 11 of 11 results
Australia - New car sales in 2026 by OEM, vehicle type
5 15.9% 77,177 20.3% -22.7% 2 BYD 7,702 8.3% 3,207 3.5% 140.2% 25,243 6.7% 11,974 3.1% 110.8% 3 Kia 6,450 7.0% 6,303 7.0% 2.3% 27,080 7.2% 26,037 6.8% 4.0% 4 Hyundai 6,002 6.5% 5,547 6.1% 8.2% 25,103 6.7% 23,833 6.3% 5.3% 5 Ford 5,748 6.2% 7,334 8.1% -21.6% 25,920 6.9% 28,733 7.5% -9.8% 6 Mazda 5,636 6.1% 6,573 7.3% -14.3% 27,526 7.3% 31,692 8.3% -13.1% 7 GWM 4,717 5.1% 3,874 4.3% 21.8% 19,595 5.2% 15,453 4.1% 26.8% 8 Chery 4,322 4....
Automotive Sales Data Updated at: 2026/05/07
Representative models for each segment
ng, Buick GL8, Denza D9 Toyota Sienta, Honda Freed, Nissan Serena Suzuki Ertiga, Toyota Innova, Kia Carnival SUV SUV-A Renault Kwid, Suzuki Jimny, Chevrolet Spark EUV Toyota Aygo X, Dacia Spring Electric, Hyundai Inster Baojun Yep, Dacia Spring Electric, Chery Duomi Suzuki HUSTLER, Daihatsu Taft, Mazda Flair Crossover Renault Kwid, VinFast VF5, Suzuki S-Presso SUV-B Chevrolet Trax, Nissan Kicks, Volvo EX30 VW T-Roc, Peugeot 2008, Toyota Yaris...
Automotive Sales Data Updated at: 2026/03/10
USA - New car sales in 2025 by OEM, model, vehicle type
(30 days), and Mitsubishi (26 days). Among European brands, Mercedes-Benz (36 days), Volvo (30 days), and BMW (29 days). Among Korean brands, Kia (29 days). Other US brands were Cadillac (62 days), Buick (59 days), and Chevrolet (58 days). Among Japanese brands, Infiniti (49 days), Honda (48 days), Mazda (45 days), and Subaru (41 days). Among European brands, Audi (45 days). Among Korean brands, Hyundai (60 days) and Genesis (49 days).Sales of ne...
Automotive Sales Data Updated at: 2026/02/04
Australia - Flash report, Automotive sales volume, 2022
9.2% 47,359 43,321 9.3% Total 87,920 78,402 12.1% 1,081,429 1,049,831 3.0% Top 10 best selling Makers/Brands - Maker/Brand 2022 2021 Y-o-Y 2022 2021 Y-o-Y Dec. Share Dec. Share Jan.-Dec. Share Jan.-Dec. Share 1 Toyota 16,274 18.5% 16,237 20.7% 0.2% 231,050 21.4% 223,642 21.3% 3.3% 2 Mazda 8,500 9.7% 7,078 9.0% 20.1% 95,718 8.9% 101,119 9.6% -5.3% 3 Kia 5,630 6.4% 4,880 6.2% 15.4% 78,330 7.2% 67,964 6.5% 15.3% 4 Mitsubishi 4,92...
Automotive Sales Data Updated at: 2025/06/04
USA - Flash report, Automotive sales volume, 2022
*1 *2 Total 31,355 31,932 -1.8% 350,949 329,574 6.5% Share 2.4% 2.6% -0.2 pt 2.5% 2.2% 0.3 pt BMW *2 Total 38,988 38,902 0.2% 332,388 336,644 -1.3% Share 3.0% 3.2% -0.2 pt 2.4% 2.2% 0.2 pt VW *2 Total 21,999 27,842 -21.0% 301,069 375,031 -19.7% Share 1.7% 2.3% -0.6 pt 2.2% 2.5% -0.3 pt Mazda Total 27,292 19,422 40.5% 294,909 332,756 -11.4% Share 2.1% 1.6% 0.5 pt 2.1% 2.2% -0.1 pt Audi *2 Total 20,100 12,935 55.4% 186,875 196,038 ...
Automotive Sales Data Updated at: 2025/06/04
China - Flash report, Sales volume, 2018
that it sold 191,907 units in December, reflecting a 33.8% y/y increase. Full year sales declined 0.6% y/y to 1,432,291 units. By model, sales of the Civic, XR-V, CR-V, Accord, Vezel, Fit, and Crider exceeded 100,000 units respectively. Annual sales of the Civic exceeded 200,000 units.On January 4, Mazda announced that it sold 20,546 units reflecting a 37.8% y/y decline in December. Full year sales declined 12% y/y to 272,322 units. New vehicle s...
Automotive Sales Data Updated at: 2019/01/31
China - Flash report, Sales volume, 2017
, up 6.3% y/y.Honda announced record December sales of 141,195 vehicles in China, a y/y increase of 6.2%. By model, steady sales of Accord, Elysion, Jade, Crider, and CR-V, as well as strong sales of the AVANCIER contributed to sales growth. Honda’s YTD sales reached 1,441,307 units, up 15.5% y/y.Mazda announced that sales for December in China totaled 33,019 units for a decline of 7.2% y/y. The automaker enjoyed a sales increase thanks to stro...
Automotive Sales Data Updated at: 2018/07/24
Australia - Flash report, Sales volume, 2013
s - Maker/Brand 2013 2012 Y-o-Y 2013 2012 Y-o-Y Dec. Share Dec. Share Jan.-Dec. Share Jan.-Dec. Share 1 Toyota 19,610 20.3% 21,169 22.2% -7.4% 214,630 18.9% 218,176 19.6% -1.6% 2 Holden 9,150 9.5% 8,727 9.1% 4.8% 112,059 9.9% 114,665 10.3% -2.3% 3 Mazda 8,526 8.8% 9,554 10.0% -10.8% 103,144 9.1% 103,886 9.3% -0.7% 4 Hyundai 7,747 8.0% 7,744 8.1% 0.0% 97,006 8.5...
Automotive Sales Data Updated at: 2016/05/02
Mexico - Flash report, Sales volume, 2014
8 14.1% 156,313 14.7% 2.4% Ford Motor 9,394 7.0% 9,227 7.7% 1.8% 79,097 7.0% 85,721 8.1% -7.7% Toyota 9,826 7.4% 8,341 7.0% 17.8% 69,597 6.1% 60,740 5.7% 14.6% Chrysler 8,393 6.3% 8,362 7.0% 0.4% 69,013 6.1% 78,974 7.4% -12.6% Honda 8,628 6.5% 7,207 6.0% 19.7% 60,128 5.3% 58,381 5.5% 3.0% Mazda 5,192 3.9% 4,127 3.5% 25.8% 40,997 3.6% 33,348 3.1% 22.9% Renault 2,938 2.2% 2,612 2.2% 12.5% 24,889 2.2% 21,187 2.0% 17.5% SEAT 1,677 1.3% ...
Automotive Sales Data Updated at: 2015/01/14
Australia - Flash report, Sales volume, 2014
2.0% Top 10 best selling Makers/Brands - Maker/Brand 2014 2013 Y-o-Y 2014 2013 Y-o-Y Dec. Share Dec. Share Jan.-Dec. Share Jan.-Dec. Share 1 Toyota 19,015 19.6% 19,610 20.3% -3.0% 203,501 18.3% 214,630 18.9% -5.2% 2 Holden 7,752 8.0% 9,150 9.5% -15.3% 106,092 9.5% 112,059 9.9% -5.3% 3 Mazda 8,731 9.0% 8,526 8.8% 2.4% 100,704 9.0% 103,144 9.1% -2.4% 4 Hyundai 7,657 7.9% 7,747 8.0% -1.2% 100,011 9.0% 97,006 8.5% 3.1% 5 Ford 5,936 ...
Automotive Sales Data Updated at: 2015/01/07
Mexico - Flash report, Sales volume, 2013
14.7% 133,964 13.6% 16.7% Ford Motor 9,227 7.7% 9,757 8.8% -5.4% 85,721 8.1% 82,328 8.3% 4.1% Chrysler 8,362 7.0% 9,439 8.5% -11.4% 78,974 7.4% 88,023 8.9% -10.3% Toyota 8,341 7.0% 7,652 6.9% 9.0% 60,740 5.7% 56,278 5.7% 7.9% Honda 7,207 6.0% 6,084 5.5% 18.5% 58,381 5.5% 52,351 5.3% 11.5% Mazda 4,127 3.5% 2,659 2.4% 55.2% 33,348 3.1% 25,424 2.6% 31.2% SEAT 2,060 1.7% 2,222 2.0% -7.3% 21,189 2.0% 21,114 2.1% 0.4% Renault 2,612 2.2% 2...
Automotive Sales Data Updated at: 2014/04/24


 Japan
Japan USA
USA Mexico
 Germany
 China (Shanghai)
 Thailand
 India
India