


Search Results by Category
All information related to {{ key_word }}.
AI Navigator will guide you. Click here for information about {{ key_word }}.
Images
 2
2
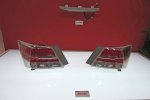
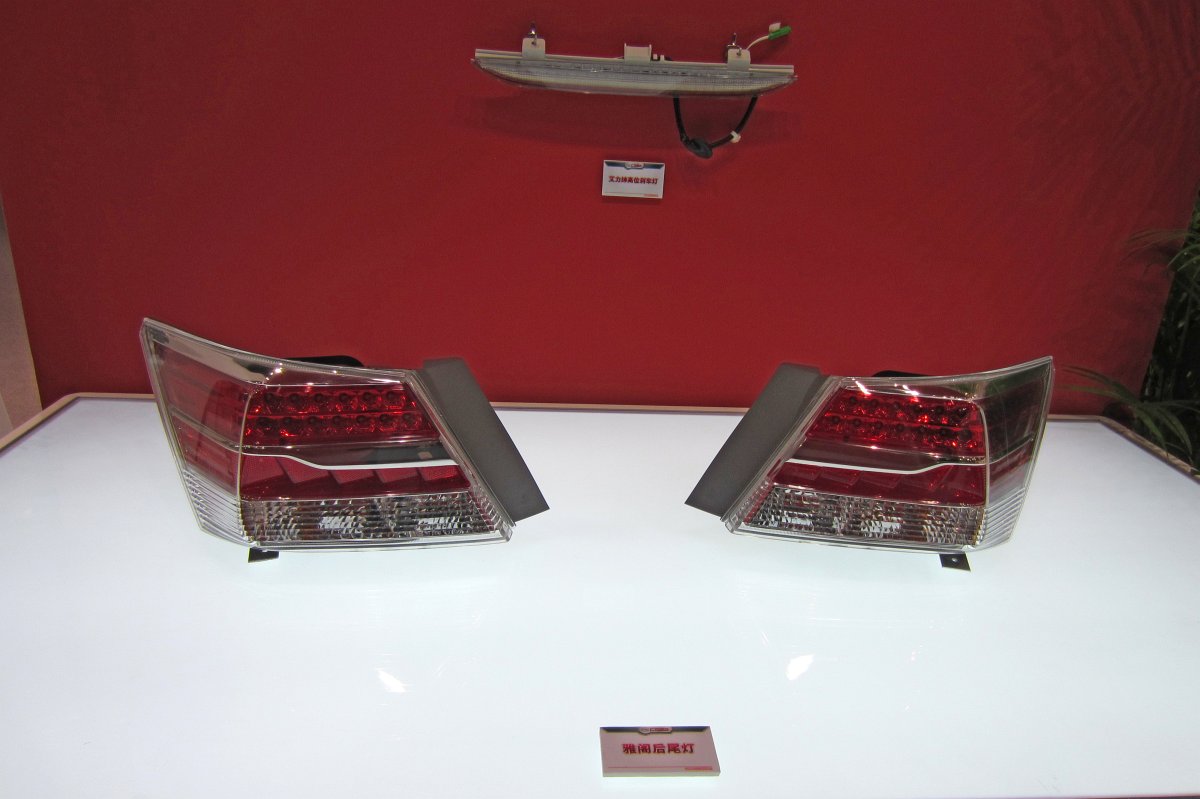
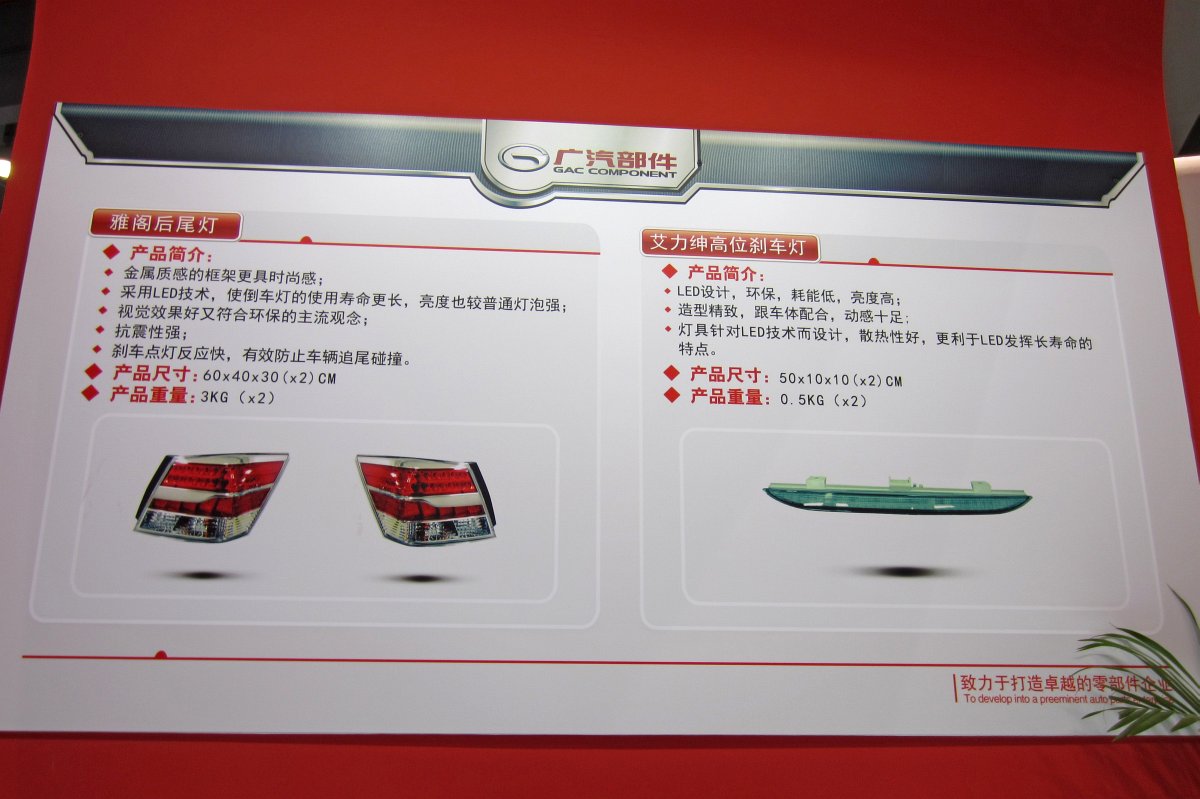
[Guangzhou Stanley Electric Co., Ltd.] Taillight and high-mounted stop lamp
 1
1
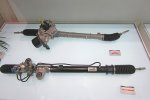
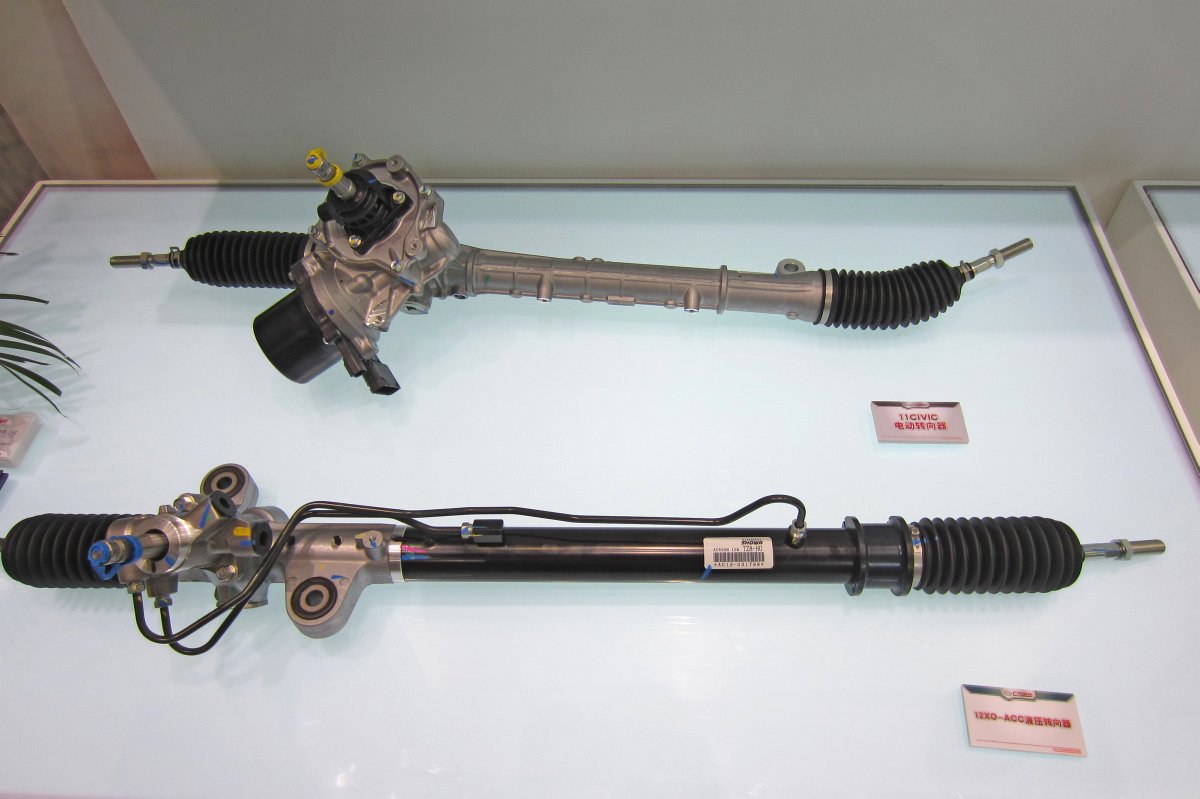
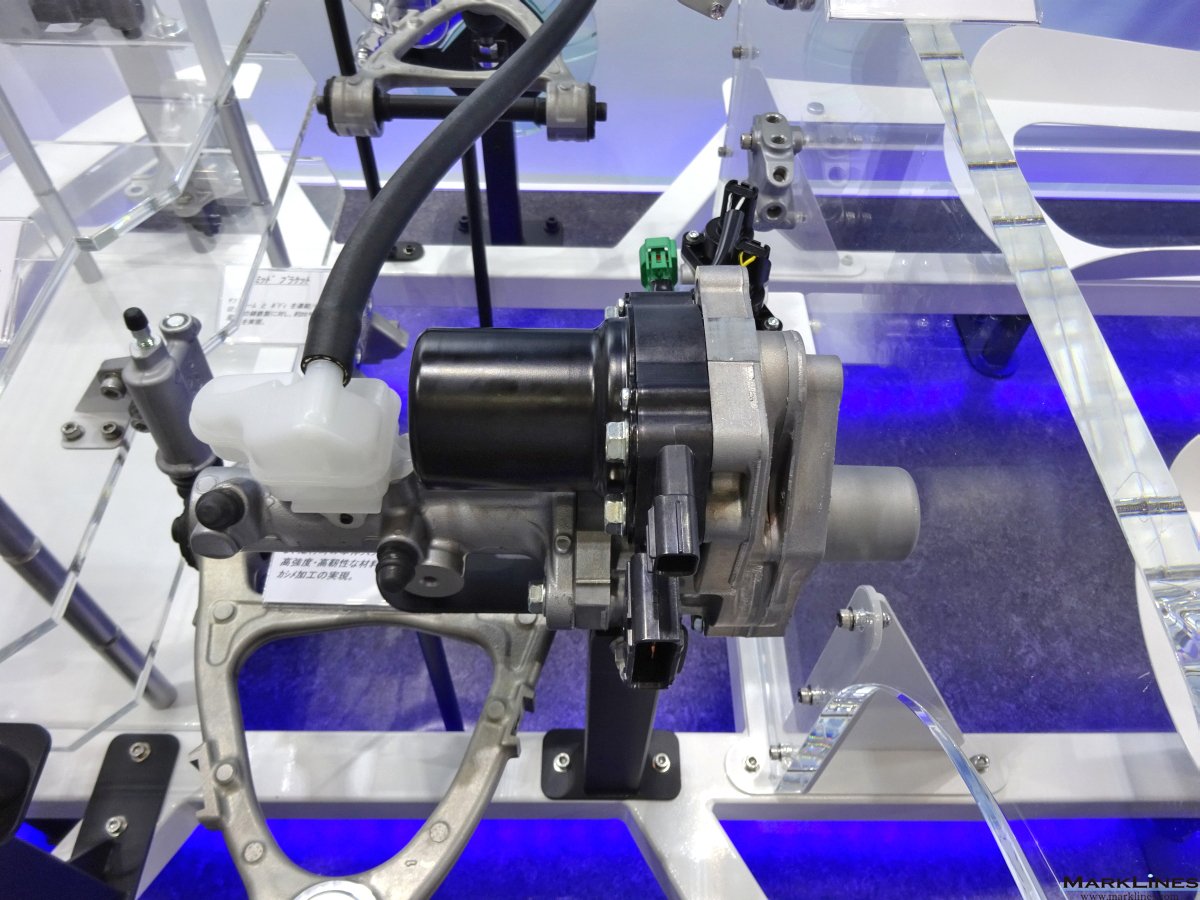
[Guangzhou Showa Auto Parts Co., Ltd.] Hydraulic Power Steering System Steering Unit
 4
4
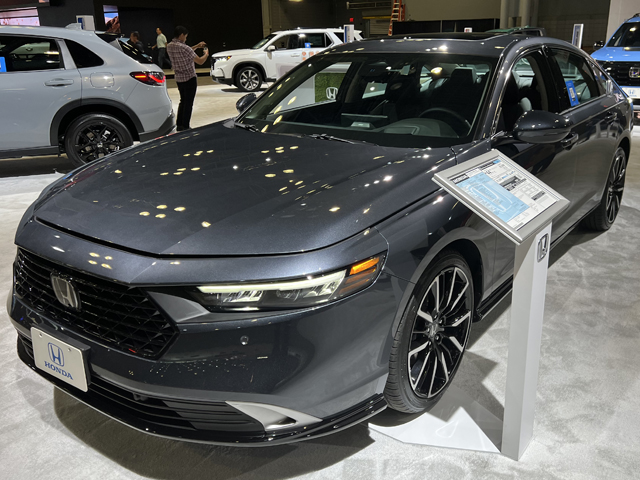
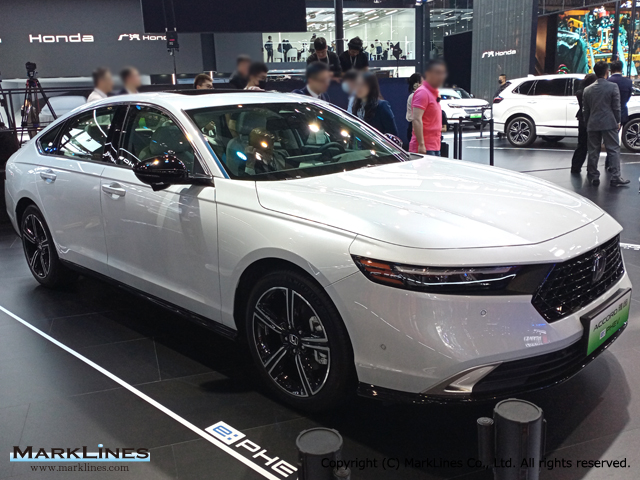
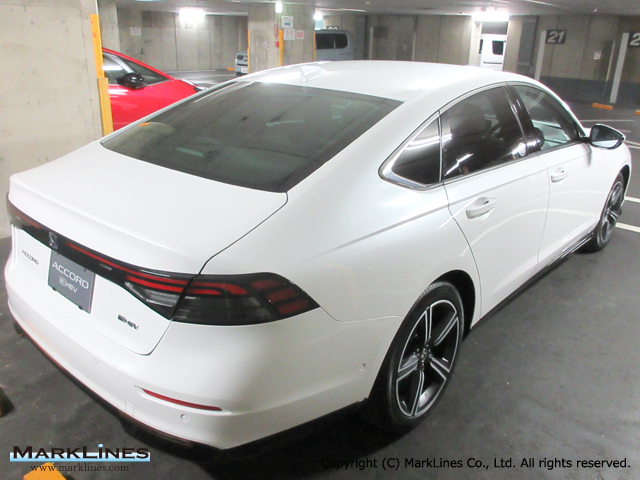
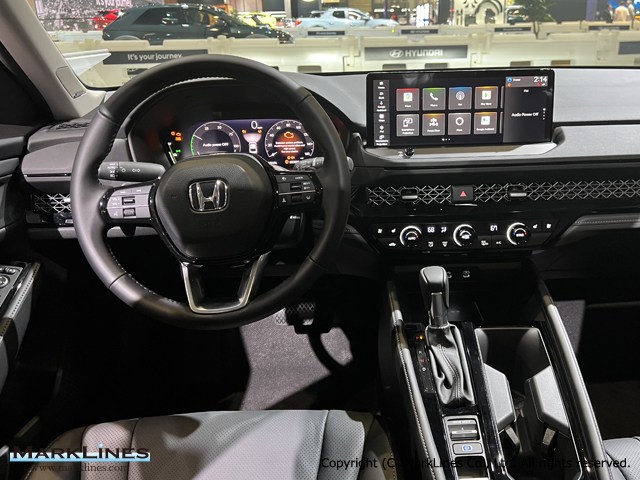
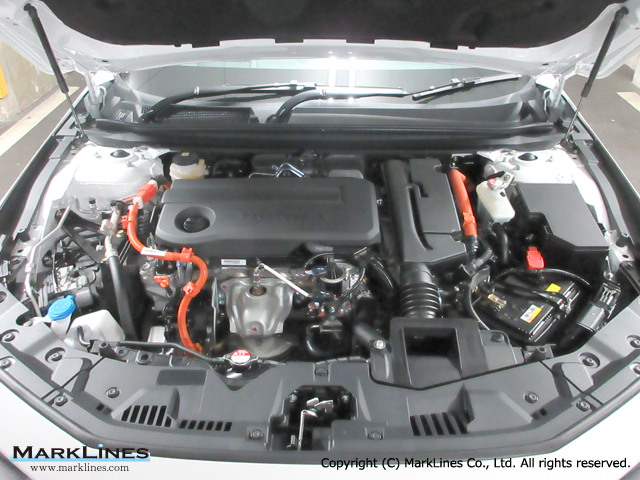
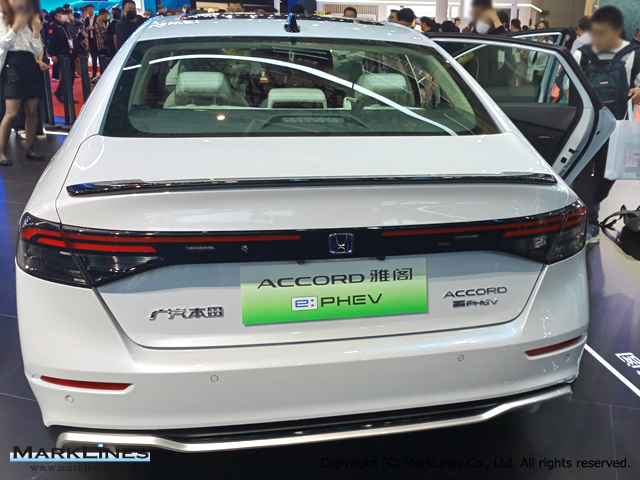
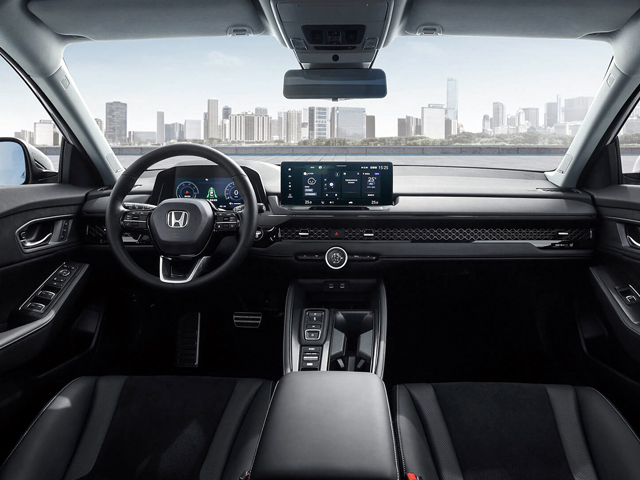
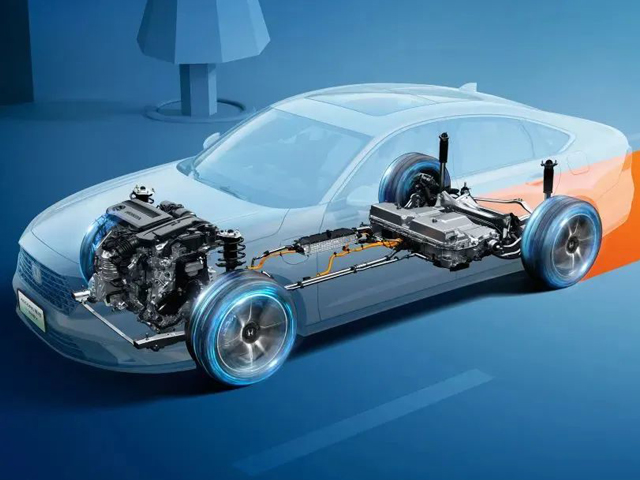
Accord Hybrid
 2
2
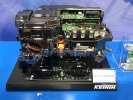
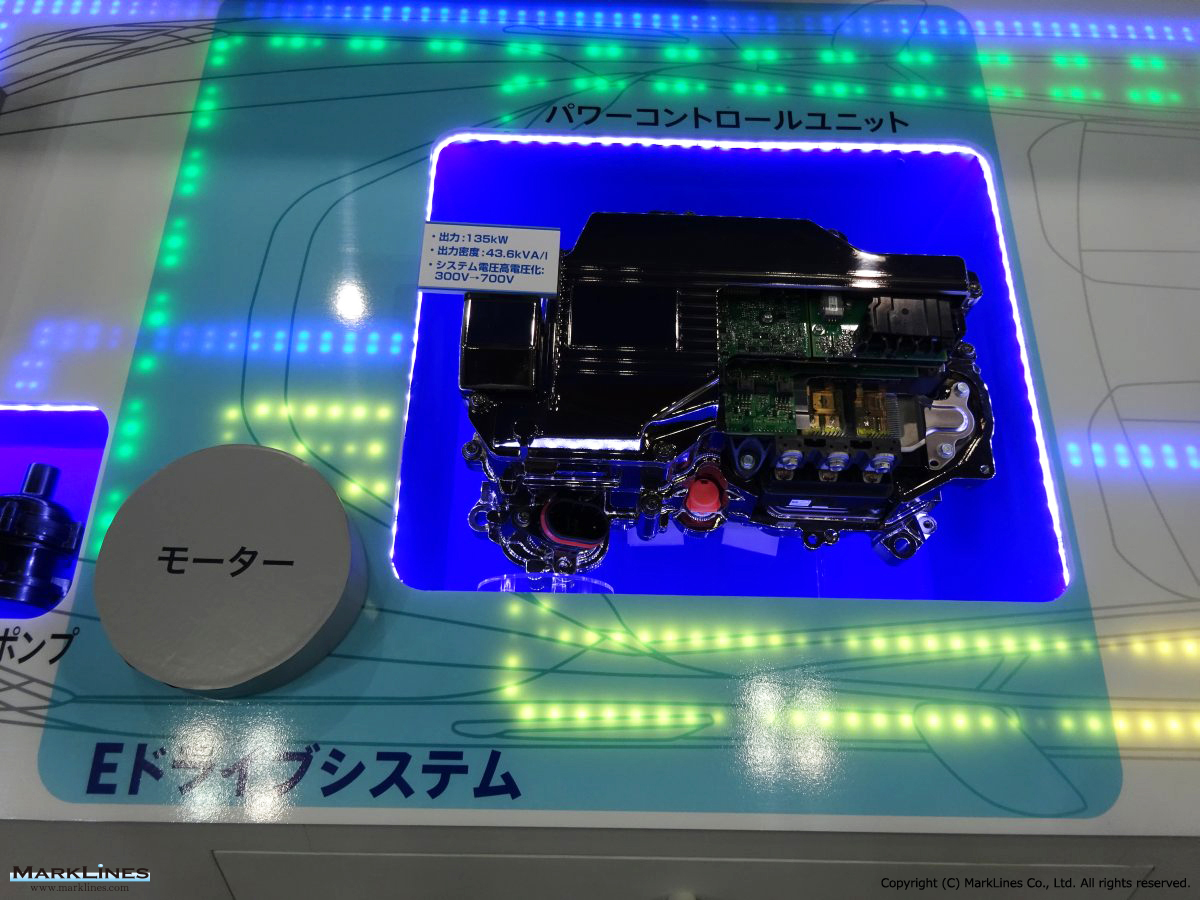
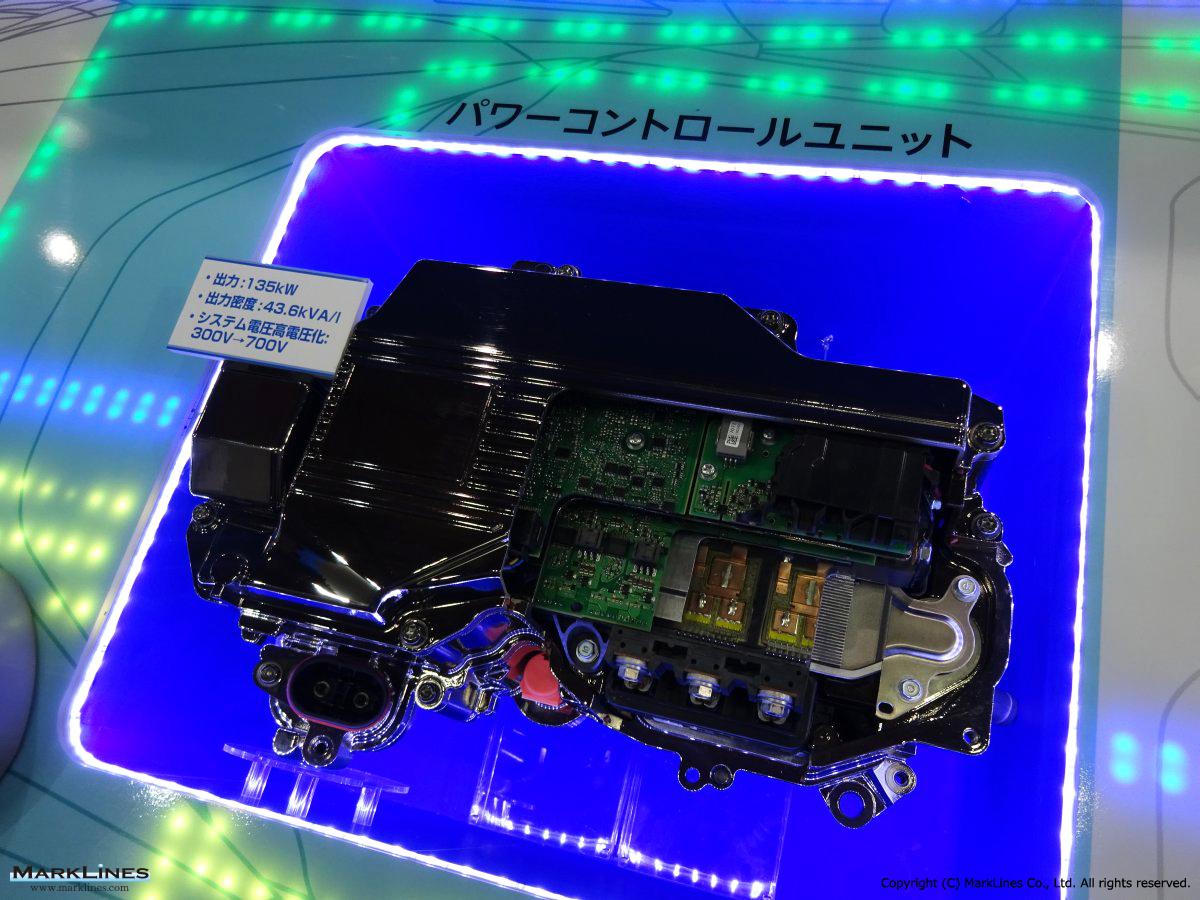
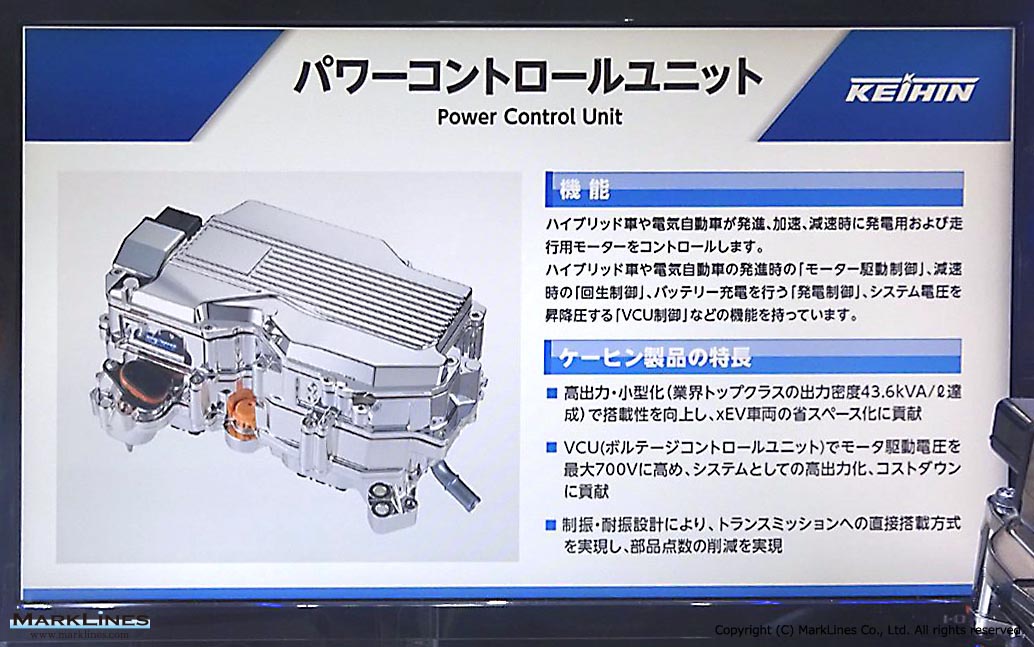
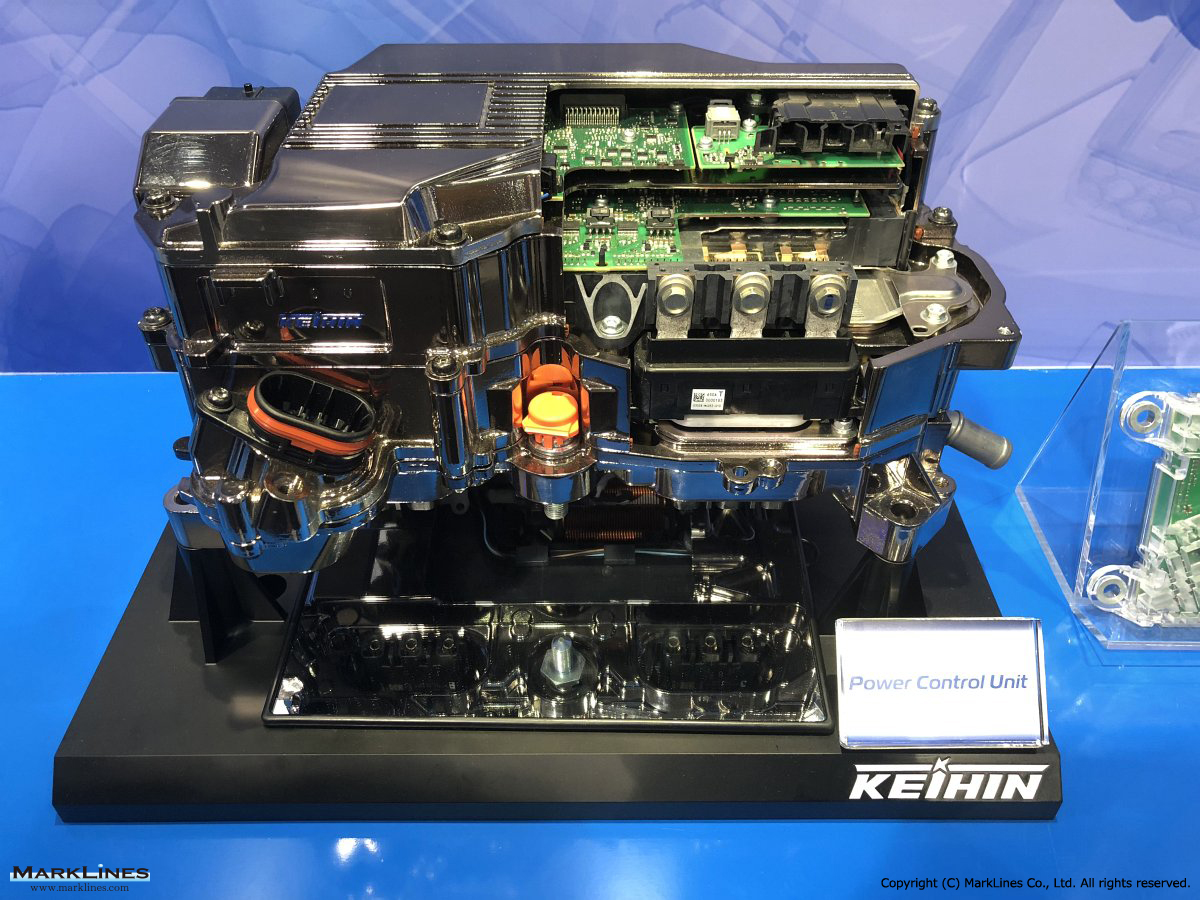
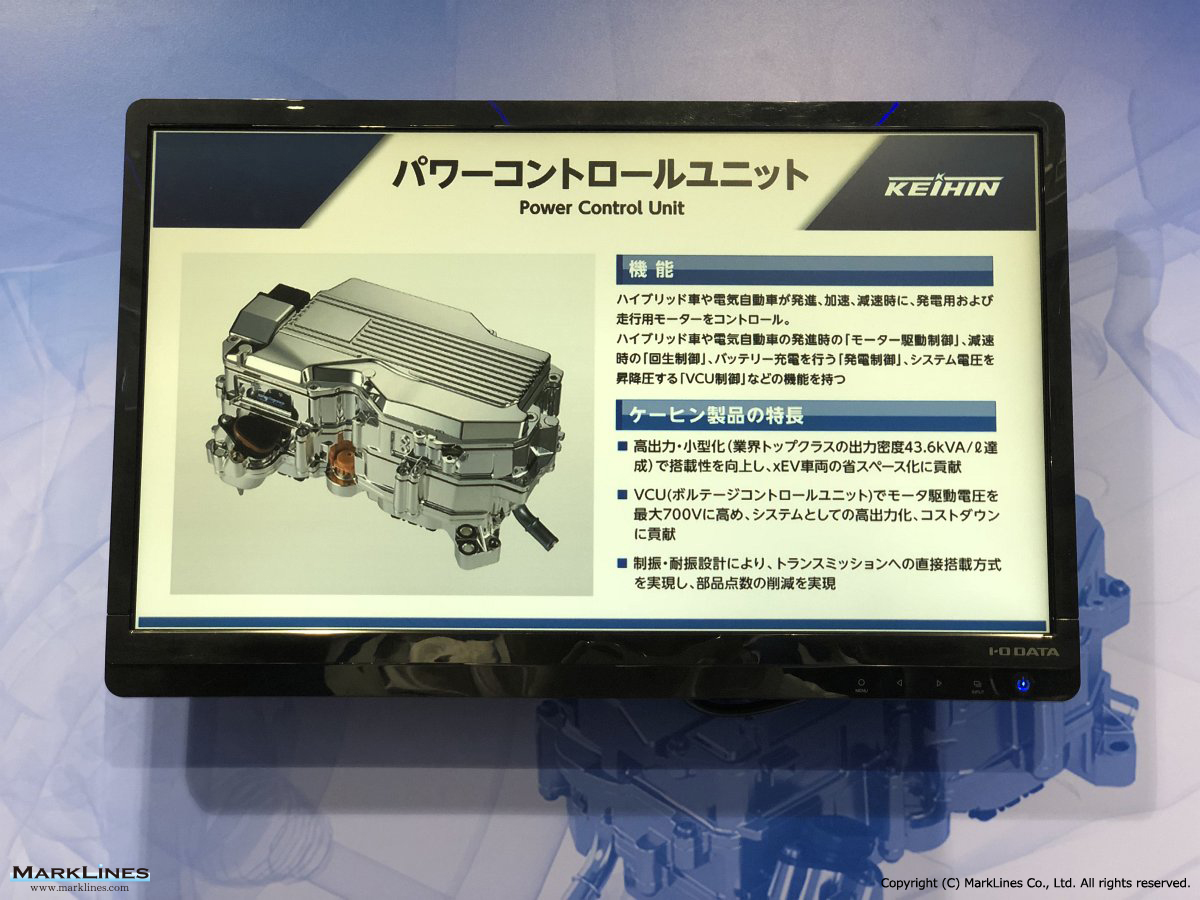
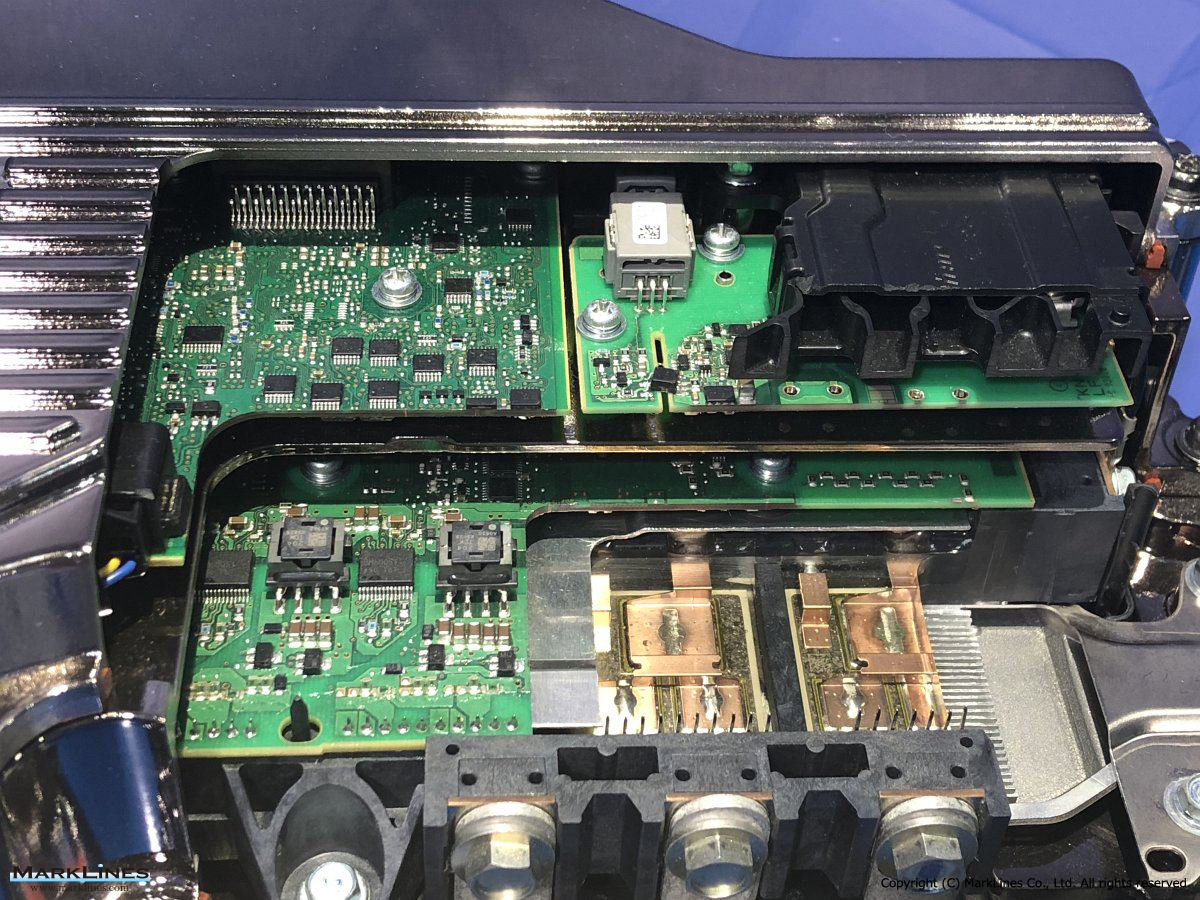
Power control unit
 3
3
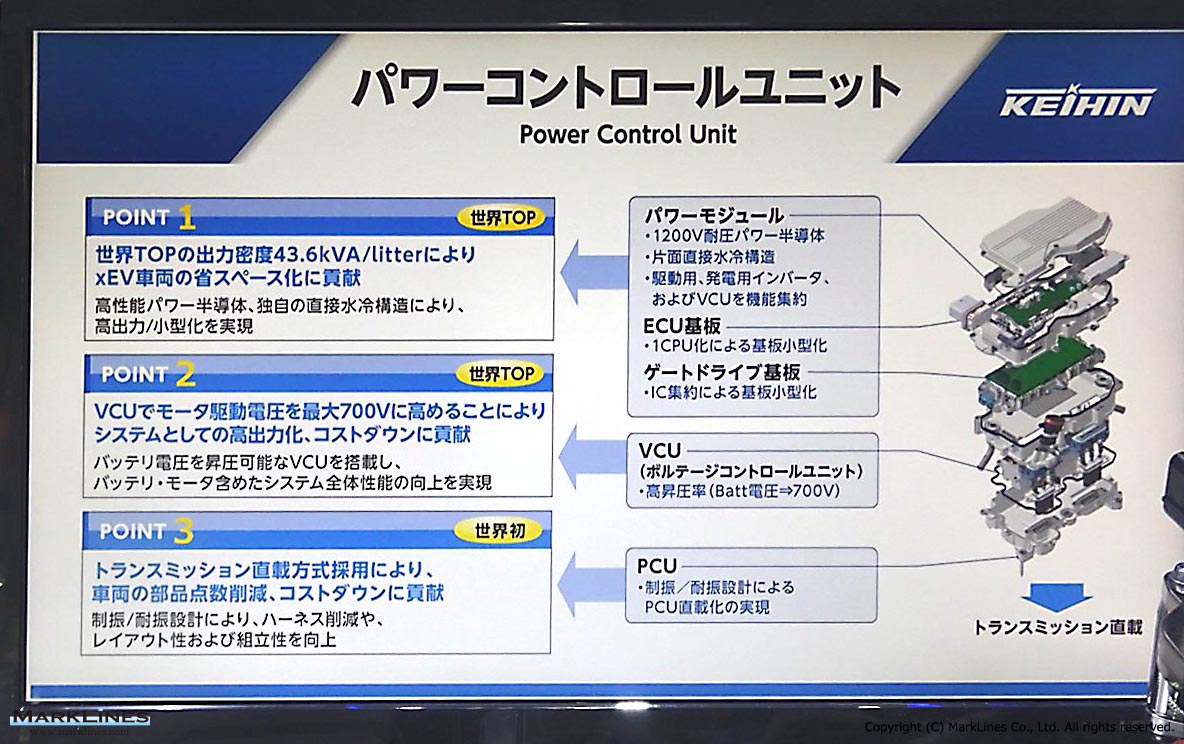
Power Control Unit
 4
4
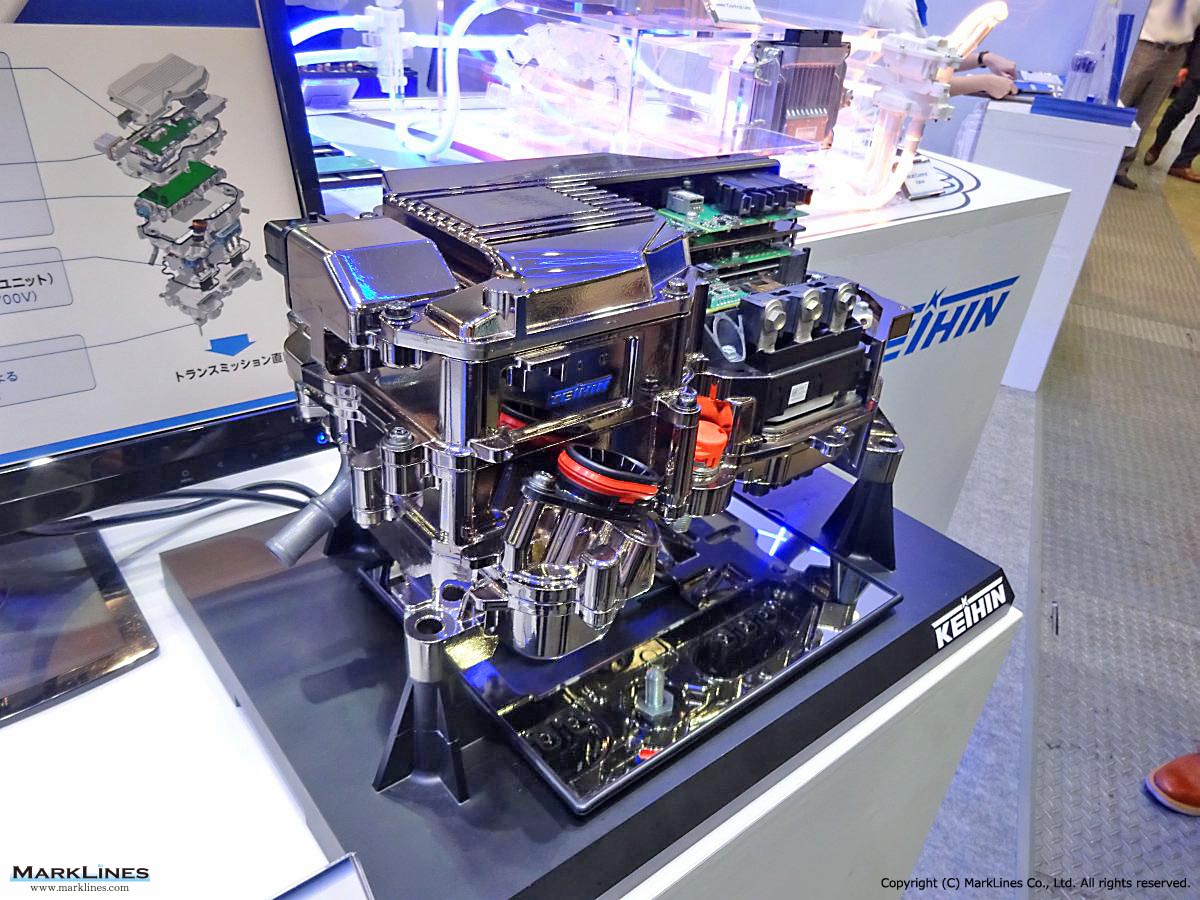
Power Control Unit
 3
3
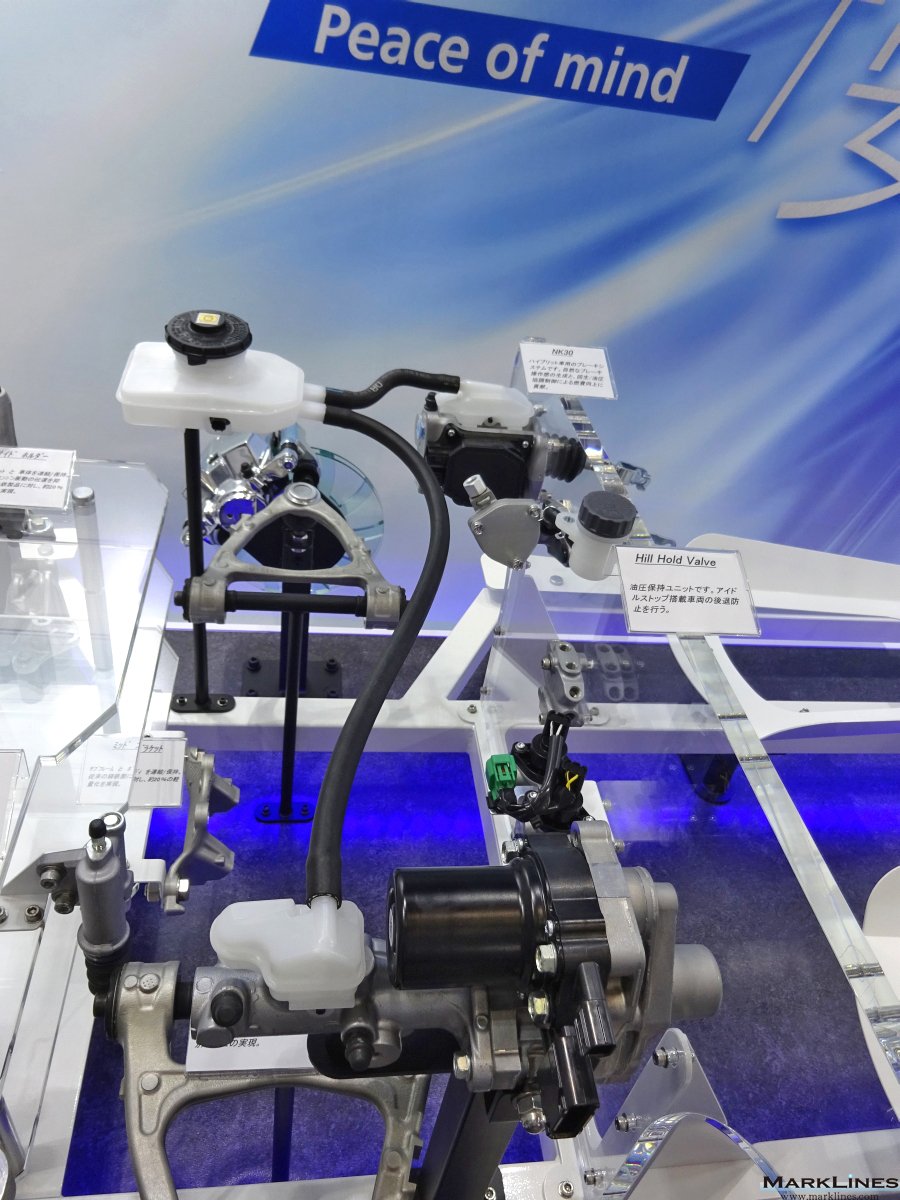
Electric servo brake -NK30-
 4
4
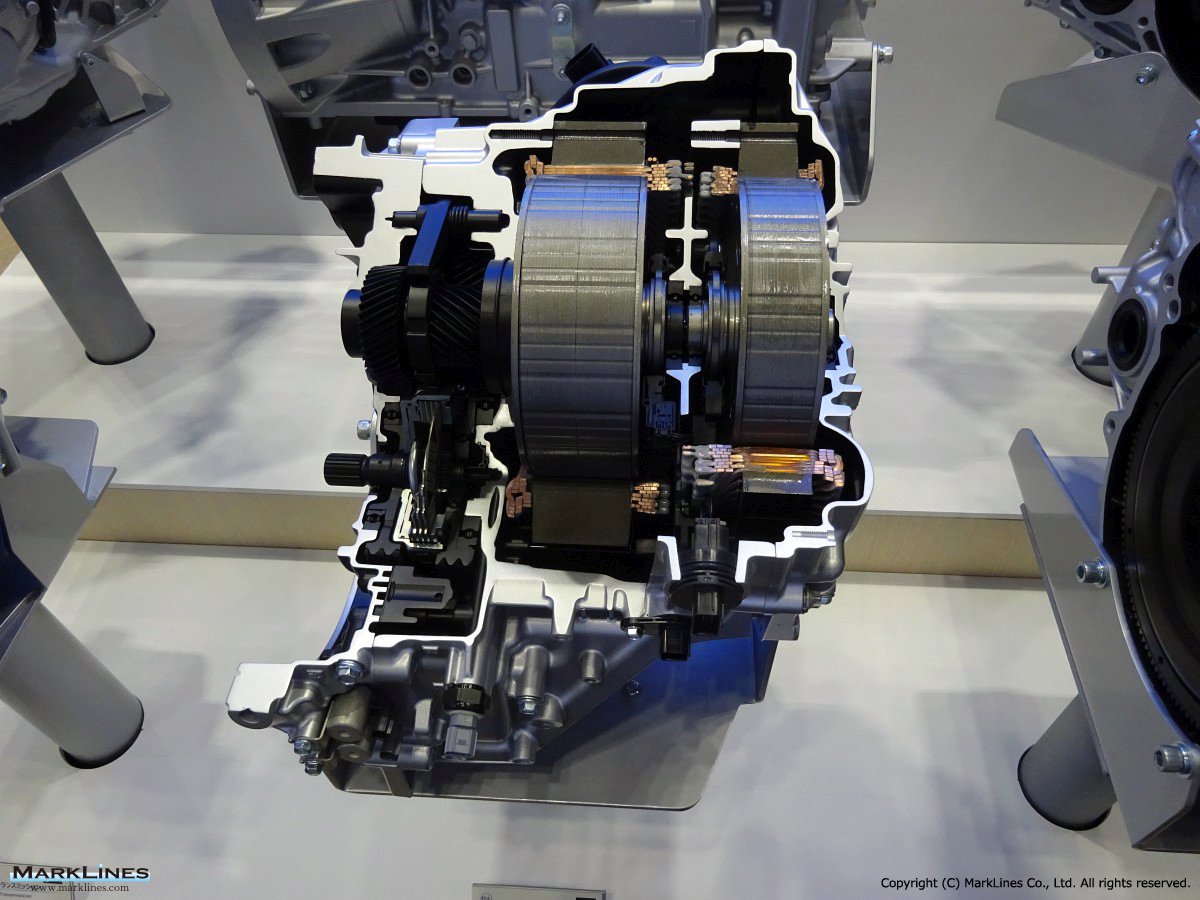
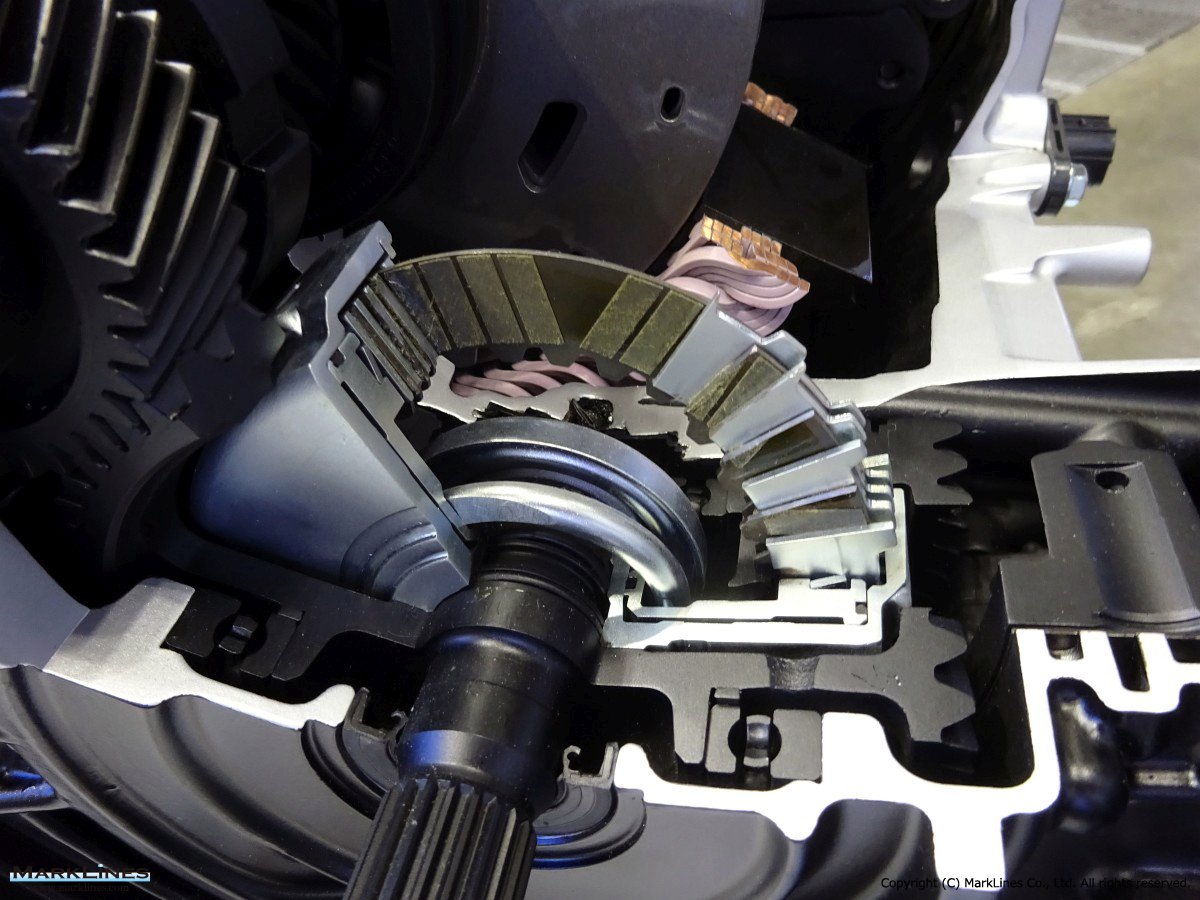
Accord / Inspire e:PHEV
 2
2
Clutch for Hybrid Transmission
 2
2
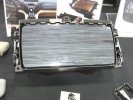
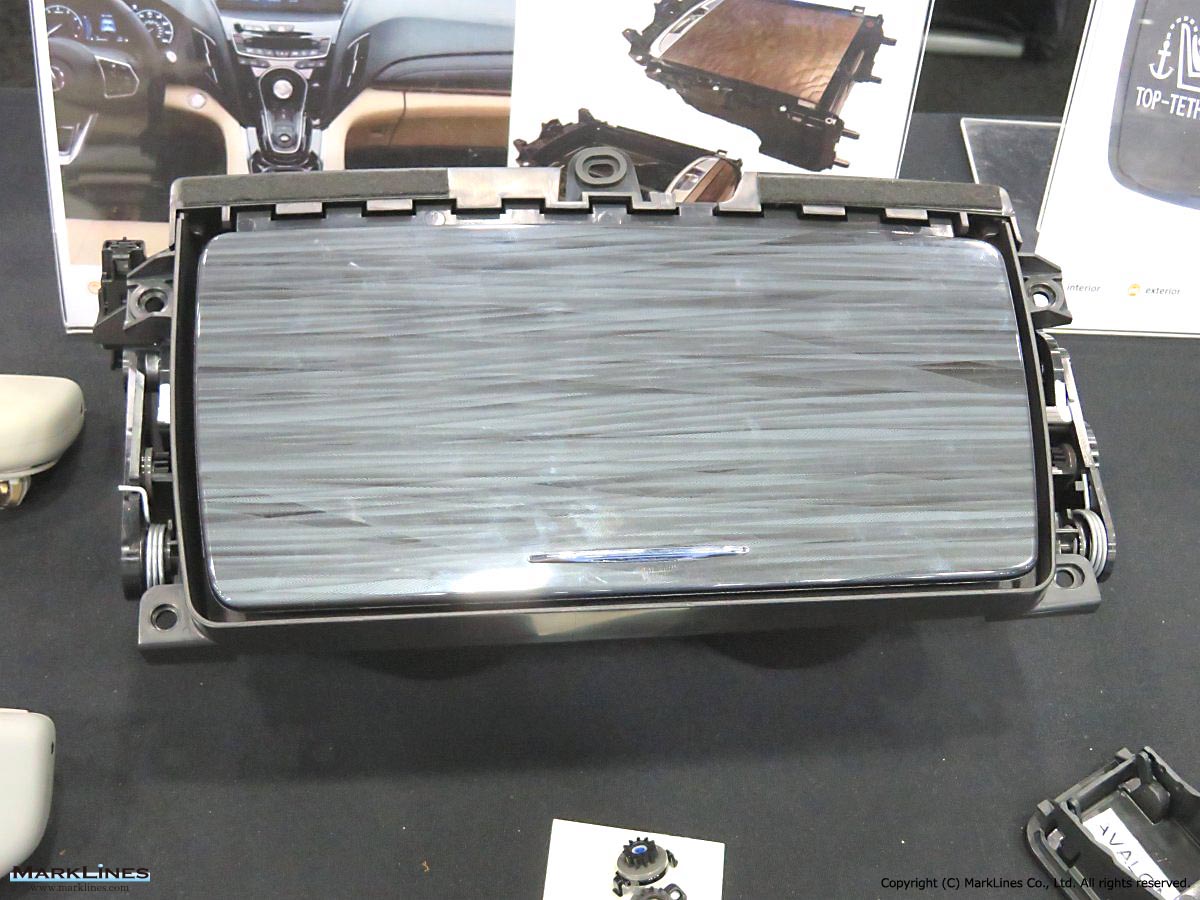
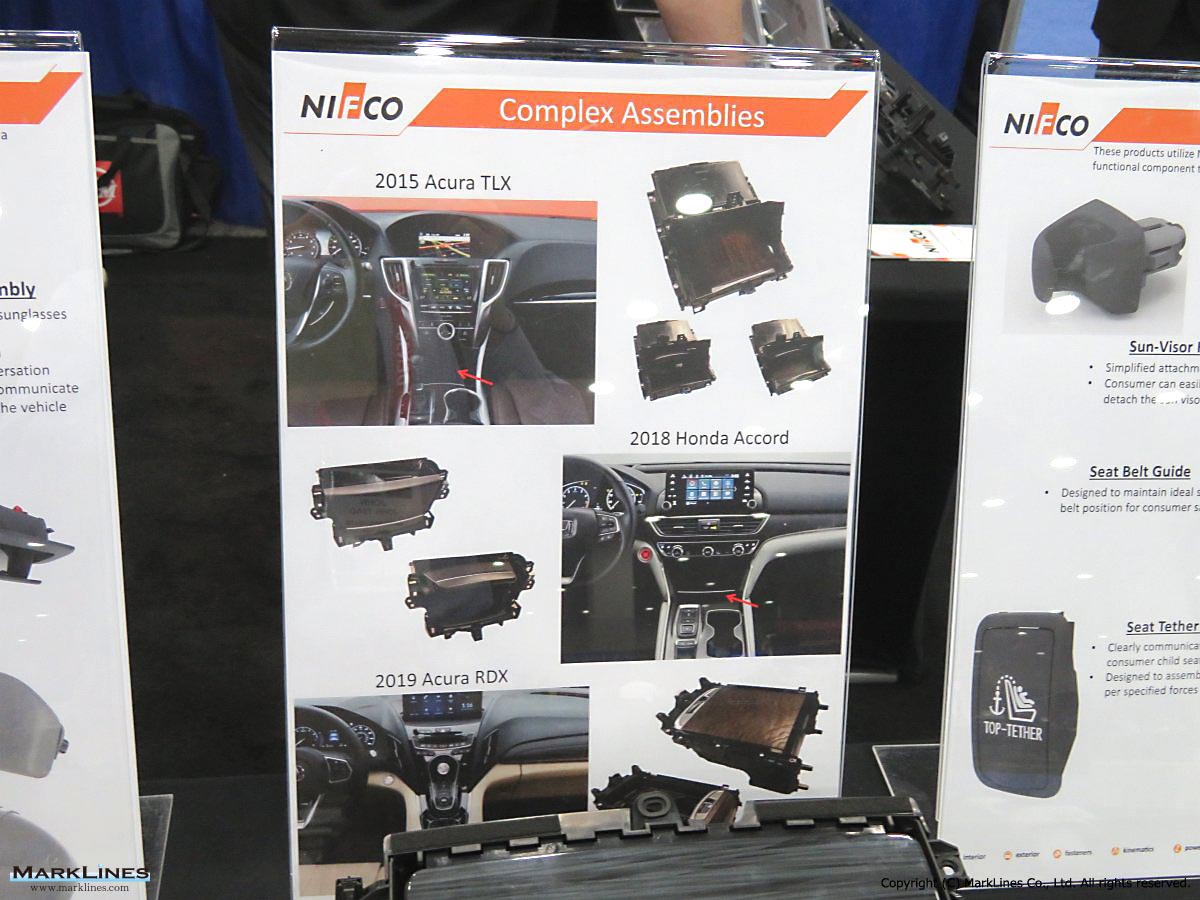
Center console storage area assembly
Sort by :
1 - 17 of 17 results
USA - New car sales in 2026 by OEM, model, vehicle type
and weakening demandThe number of new vehicles sold in the U.S. in March 2026 (preliminary figures including estimates for GM/Stellantis/Tesla, etc.), aggregated by MarkLines as of April 2, totaled 1,405,817 units, down 11.8% year over year. March had 25 selling days, one fewer than a year earlier.According to U.S. media reports, March auto sales reflected a slowing market, as elevated vehicle prices, the end of federal EV tax credits, and weake...
Automotive Sales Data Updated at: 2026/04/02
Data changes for Sales Statistics
ssan" to "Venucia". June 19, 2014 The maker/brand, Chinese OEMs, and manufacturers of "Liebao" have been changed. Refer to the chart below for details. Download June 10, 2014 Descriptions of some of groups have been changed. Maker/Brand Previous Group New Group Everus, CIIMO Other Groups Honda Baojun Other Groups GM Group October 23, 2013 Porsche has been classified as part of the VW group since 2013. May 16, 2013 The maker/b...
Automotive Sales Data Updated at: 2026/03/24
Representative models for each segment
are typical models included in each segment. (Refer to sales volume in 2025) Segment Representative models North America Europe China Japan Other Sedan/Hatchback A (Basic) Fiat 500, JAC E10X, Auteco D2S Fiat Panda, Hyundai i10, Kia Morning BYD Seagull, Wuling Hongguang MINIEV, Changan Lumin Honda N-BOX, Suzuki Spacia, Daihatsu Tanto Suzuki Wagon R, Perodua Axia, Fiat Mobi B (Small) Chevrolet Aveo, Kia Soul, Nissan March (Micra) Renault ...
Automotive Sales Data Updated at: 2026/03/10
China - New car sales in 2024 by OEM, model, vehicle type
uding mounting unfavorable factors from changes in the external environment, insufficient endogenous momentum for automobile consumption due to lack of consumer confidence, and a negative impact of intensifying industry competition and shrinking profits on sound and sustainable industry development.According to the CAAM, China will adhere to the principle of pursuing progress while ensuring stability in terms of economic development in 2025, a mo...
Automotive Sales Data Updated at: 2025/07/02
China - Flash report, Automotive sales volume, 2023
inese sales figures for 2023 all dropThree Japanese OEMs recently announced their sales results in China for December 2023 and the whole of 2023.Toyota sold 185,500 units in December, up 0.9% year-over-year (y/y). Year-to-date (YTD) sales volumes totaled 1,907,600 units, down 1.7% y/y.On January 4, Honda announced that its December sales volume was 165,798 units, up 19.7% y/y. YTD sales volumes totaled 1,234,181 units, down 10.1% y/y. GAC Honda a...
Automotive Sales Data Updated at: 2025/06/04
China - Flash report, Automotive sales volume, 2022
anese OEMs announced their sales results in China for December 2022 and the whole of 2022.Toyota sold 183,800 units in December in China, reflecting a 19.8% year-over-year (y/y) drop. Year-to-date (YTD) sales from January to December totaled 1,940,600 units, reflecting a 0.2% y/y drop.On January 5, Honda announced that its December sales was 138,512 units, reflecting a y/y drop of 17.9% due to COVID-19 outbreaks and tight part supplies. YTD sales...
Automotive Sales Data Updated at: 2025/06/04
China - Flash report, Automotive sales volume, 2021
2021Four Japanese OEMs announced their sales results in China for December 2021.Toyota sold 229,200 units in December in China, reflecting a 26.2% year-over-year (y/y) increase. Year-to-date (YTD) sales from January to December totaled 1,944,000 units, reflecting an 8.2% y/y increase.On January 6, Honda announced that its December sales were 168,663 units, reflecting a y/y decrease of 19.2%, owing to the shortage in auto parts supply. YTD sales ...
Automotive Sales Data Updated at: 2025/06/04
China - Flash report, Sales volume, 2020
ion methods. Passenger Car retail sales by Chinese Makers Top10 - Maker Dec. 2020 (10,000) Y-o-Y 1 FAW-VW 24.0 5.3% 2 SAIC GM 16.2 30.3% 3 SAIC VW 16.2 -26.7% 4 SAIC-GM-Wuling 15.2 9.6% 5 Dongfeng Nissan 14.4 0.5% 6 Geely Automobile 14.2 12.3% 7 Great Wall 12.2 40.6% 8 Dongfeng Honda 11.1 46.7% 9 GAC Honda 9.8 45.7% 10 Chery Automobile 9.3 28.4% Source: CPCA Four Japanese OEMs announce Chinese sales figures for Decembe...
Automotive Sales Data Updated at: 2025/06/04
China - Flash report, Sales volume, 2019
y 26,950 56,339 -52.2% 346,551 481,216 -28.0% 6 VW Sagitar 31,789 22,455 41.6% 307,323 309,902 -0.8% 7 Buick Excelle GT 26,083 18,531 40.8% 279,280 261,920 6.6% 8 VW New Bora (Model X) 31,274 2,469 1166.7% 272,266 169,782 60.4% 9 VW New Santana 24,900 17,933 38.9% 251,174 265,869 -5.5% 10 Honda Civic 19,031 22,195 -14.3% 243,966 218,132 11.8% Source: MarkLines Data Cente *The below data may differ from the sales volume by make (shipp...
Automotive Sales Data Updated at: 2020/05/12
USA - Flash report, Sales volume, 2019
imated sales in December were down 6.4%, Ford sales were down 1.5%, and FCA sales were down 2.8% compared to December 2018.For all of 2019, GM sales were down 2.5% and Ford sales were down 3.2%, and FCA sales were down 1.4% compared to 2018.Toyota sales were down 6.1%, Nissan sales were down 29.5%, Honda sales were down 12.0%, and Subaru sales were down 3.4% compared to last December.For all of 2019, Toyota sales were down 1.8%, Nissan sales were...
Automotive Sales Data Updated at: 2020/01/21
China - Flash report, Sales volume, 2018
the local plant) to be released later on our data for monthly sales volume.This is due to the difference in calculation methods. Four Japanese OEMs announce Chinese sales figures for DecemberOn January 5, four Japanese OEMs have announced their sales results in China for December 2018. Toyota and Honda achieved an increase in sales.On January 4, Nissan announced that it sold 176,191 units in China, reflecting a 4.4% y/y decline. December sales ...
Automotive Sales Data Updated at: 2019/01/31
USA - Flash report, Sales volume, 2018
6,069 units, while passenger car sales were down 13.1% to 5,488,181 units for 2018.General Motors sales in December were down 3.7% and Ford sales were down 8.8%, while FCA sales were up 14.3% compared to December 2017.Among Japanese companies, Toyota sales were down 0.9%, Nissan sales were up 7.6%, Honda sales were up 3.9%, and Subaru sales were up 1.9% compared to last December.Kia sales increased 10.2%, while Hyundai sales increased 3.3% from l...
Automotive Sales Data Updated at: 2019/01/28
China - Flash report, Sales volume, 2017
sales of the Teana, Sylphy, X-Trail, KICKS, Venucia D60, Venucia T70, and Venucia T90. The company’s year-to-date (YTD) sales from January reached 1,519,714 vehicles, up 12.2% y/y.Toyota sold 107,500 vehicles, a 5.6% y/y decline. The automaker’s YTD sales reached 1,290,100 vehicles, up 6.3% y/y.Honda announced record December sales of 141,195 vehicles in China, a y/y increase of 6.2%. By model, steady sales of Accord, Elysion, Jade, Crider, a...
Automotive Sales Data Updated at: 2018/07/24
USA - Flash report, Sales volume, 2017
on units for passenger cars and 11.76 million units for trucks.General Motors sales decreased 3.4% in December, with passenger car sales down 34.9% from last year.Ford sales were up 1.3% and FCA sales were down 10.7% compared to December sales last year.Among Japanese companies, Toyota, Nissan, and Honda sales were down 8.3%, 9.5%, 7.0%, respectively, while Subaru sales were up 0.3% compared to last December.Kia sales decreased 20.8%, while Hyund...
Automotive Sales Data Updated at: 2018/07/24
China - Flash report, Sales volume, 2016
Source:CAAM, Each maker's press releases *The below data may differ from the sales volume by make (shipped from the local plant) to be released later on our data for monthly sales volume.This is due to the difference in calculation methods. Japanese OEMs achieve record-high sales in China in 2016According to the 2016 sales results in China announced by Japanese automakers, Nissan Motor Co., Ltd., Toyota Motor Corporation, Honda Motor Co., Ltd....
Automotive Sales Data Updated at: 2017/01/18
USA - Flash report, Sales volume, 2014
58 16.1% 1.2% 2,480,942 15.1% 2,493,918 16.0% -0.5% FCA 193,261 12.9% 161,007 11.9% 20.0% 2,090,639 12.7% 1,800,368 11.6% 16.1% Total 688,415 45.8% 609,222 44.9% 13.0% 7,506,589 45.6% 7,080,364 45.5% 6.0% Japanese Toyota 215,057 14.3% 190,843 14.1% 12.7% 2,373,771 14.4% 2,236,042 14.4% 6.2% Honda 137,281 9.1% 135,255 10.0% 1.5% 1,540,872 9.4% 1,525,312 9.8% 1.0% Nissan 117,318 7.8% 109,758 8.1% 6.9% 1,386,895 8.4% 1,248,420 8.0% 11.1% ...
Automotive Sales Data Updated at: 2015/01/06
USA - Flash report, Sales volume, 2013
15.9% 1.8% 2,493,918 16.1% 2,250,165 15.6% 10.8% Chrysler 161,007 11.9% 152,367 11.3% 5.7% 1,800,368 11.6% 1,651,787 11.5% 9.0% Total 609,222 45.2% 612,322 45.4% -0.5% 7,080,364 45.7% 6,497,669 45.1% 9.0% Japanese Toyota 190,843 14.2% 194,143 14.4% -1.7% 2,236,042 14.4% 2,082,504 14.4% 7.4% Honda 135,255 10.0% 132,774 9.8% 1.9% 1,525,312 9.8% 1,422,785 9.9% 7.2% Nissan 109,758 8.1% 99,290 7.4% 10.5% 1,248,420 8.1% 1,141,656 7.9% 9.4% ...
Automotive Sales Data Updated at: 2014/01/06


 Japan
Japan USA
USA Mexico
 Germany
 China (Shanghai)
 Thailand
 India
India