


Search Results by Category
All information related to {{ key_word }}.
AI Navigator will guide you. Click here for information about {{ key_word }}.
Images
 1
1
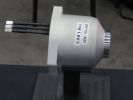
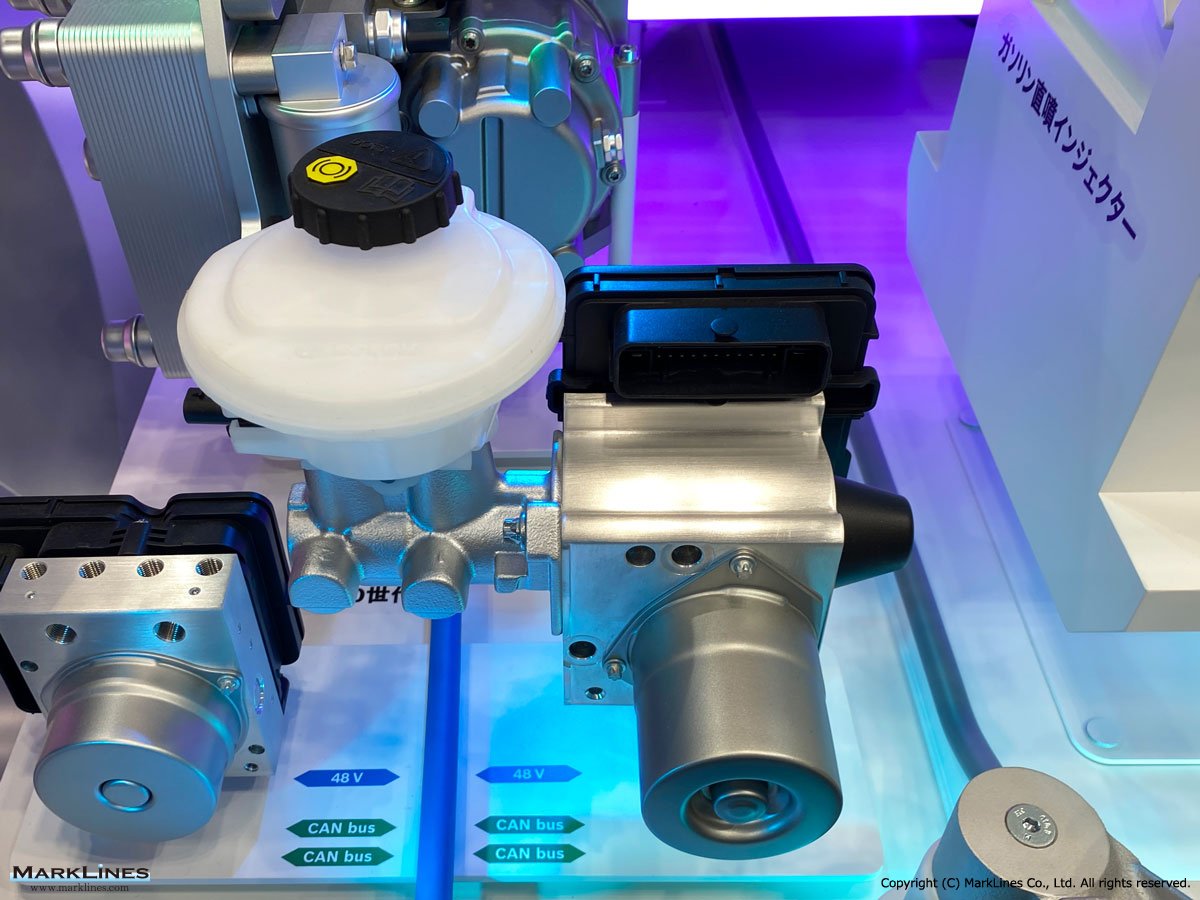
Electric brake booster motor
 2
2
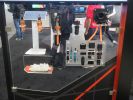
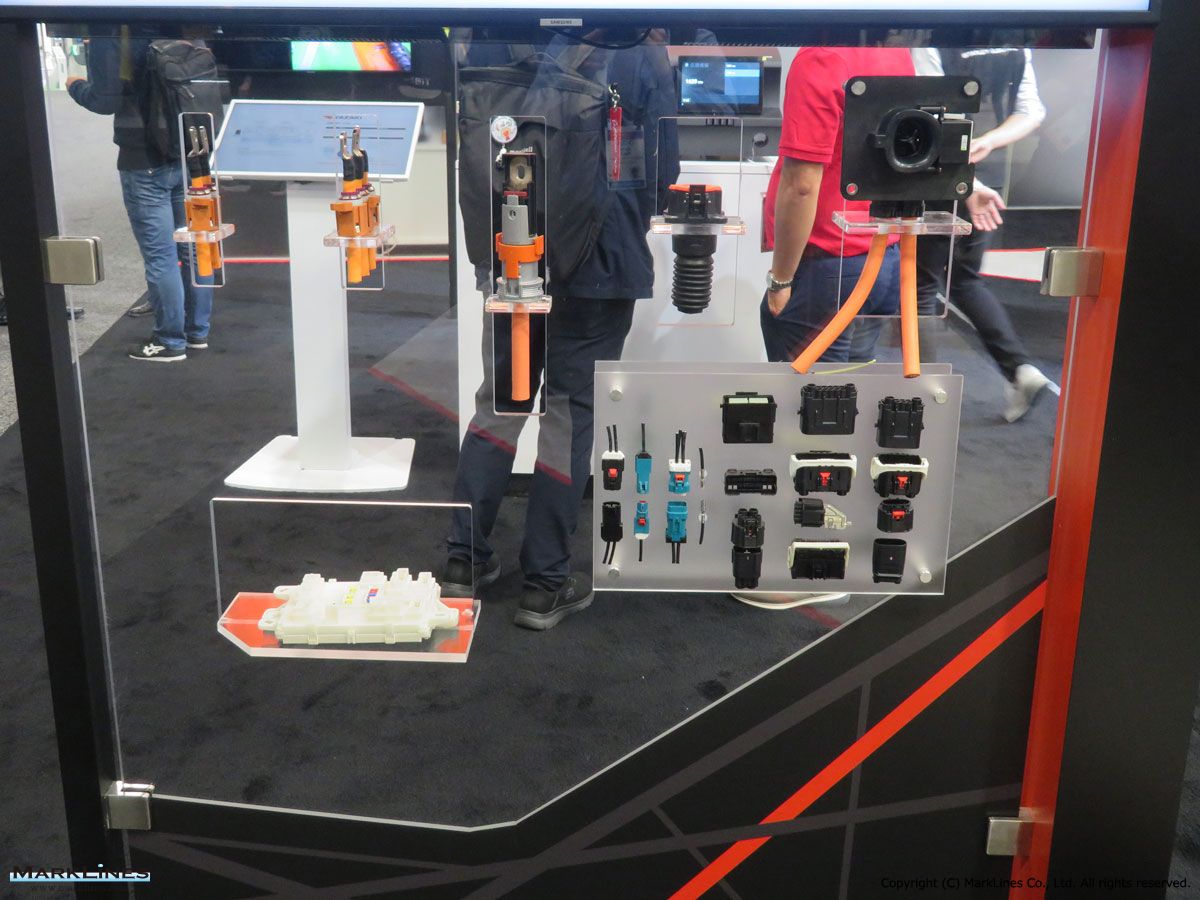
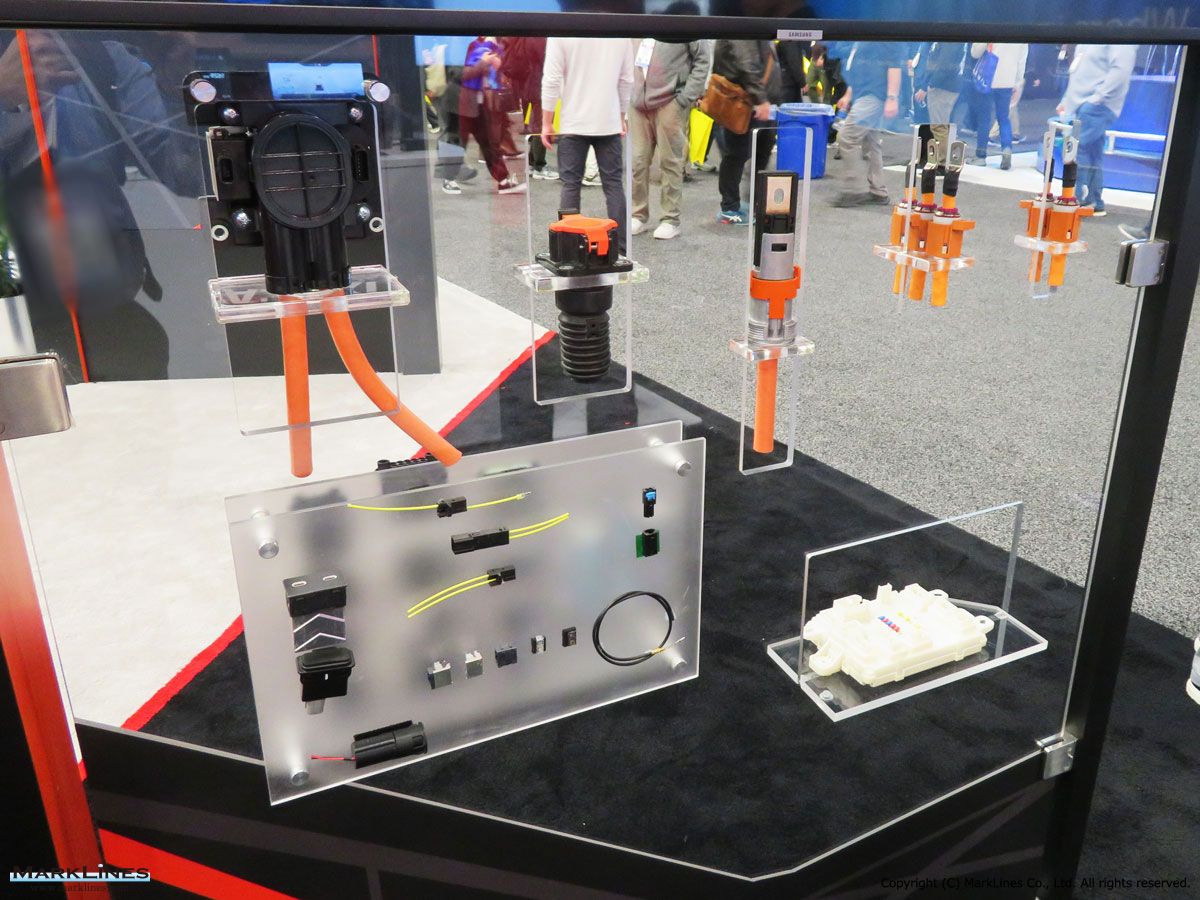
Partial portfolio of Company components
 1
1
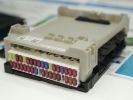
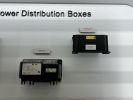
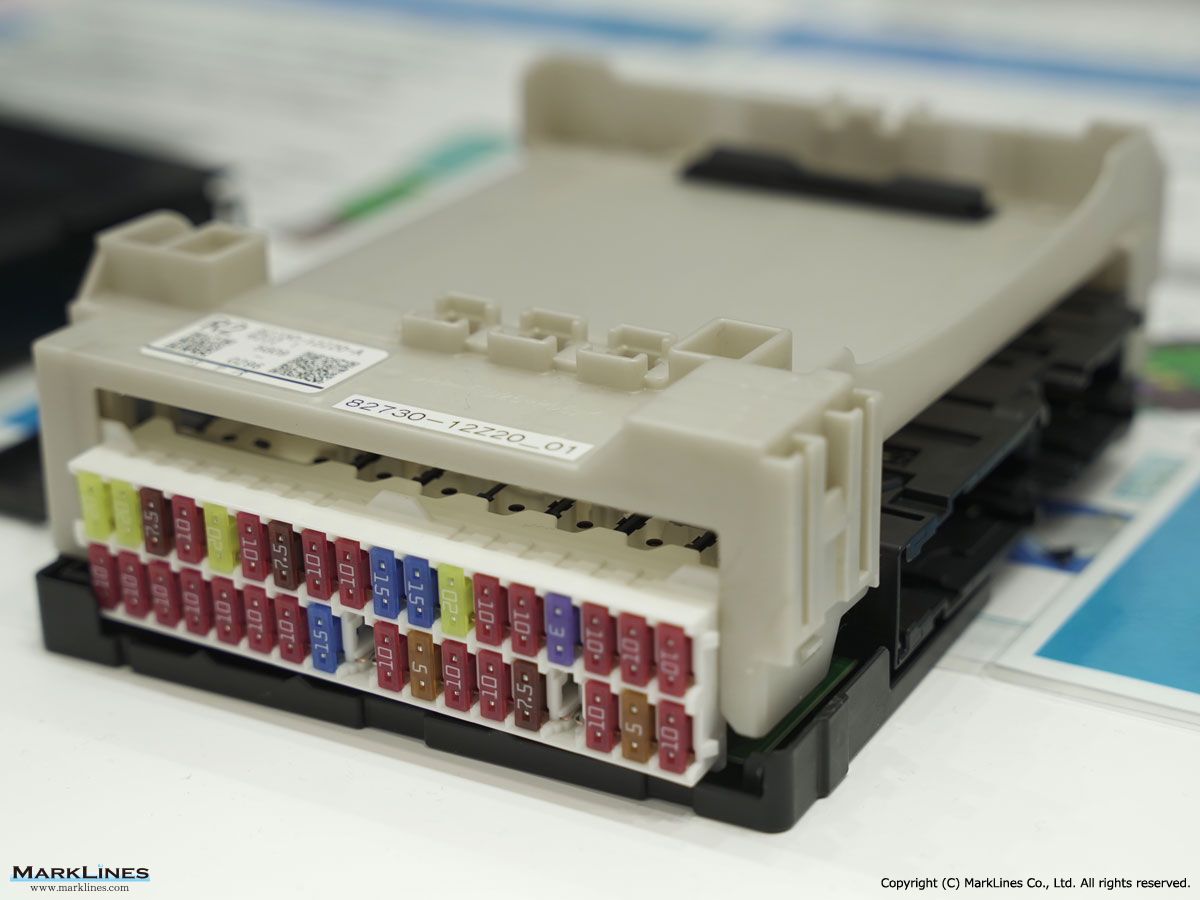
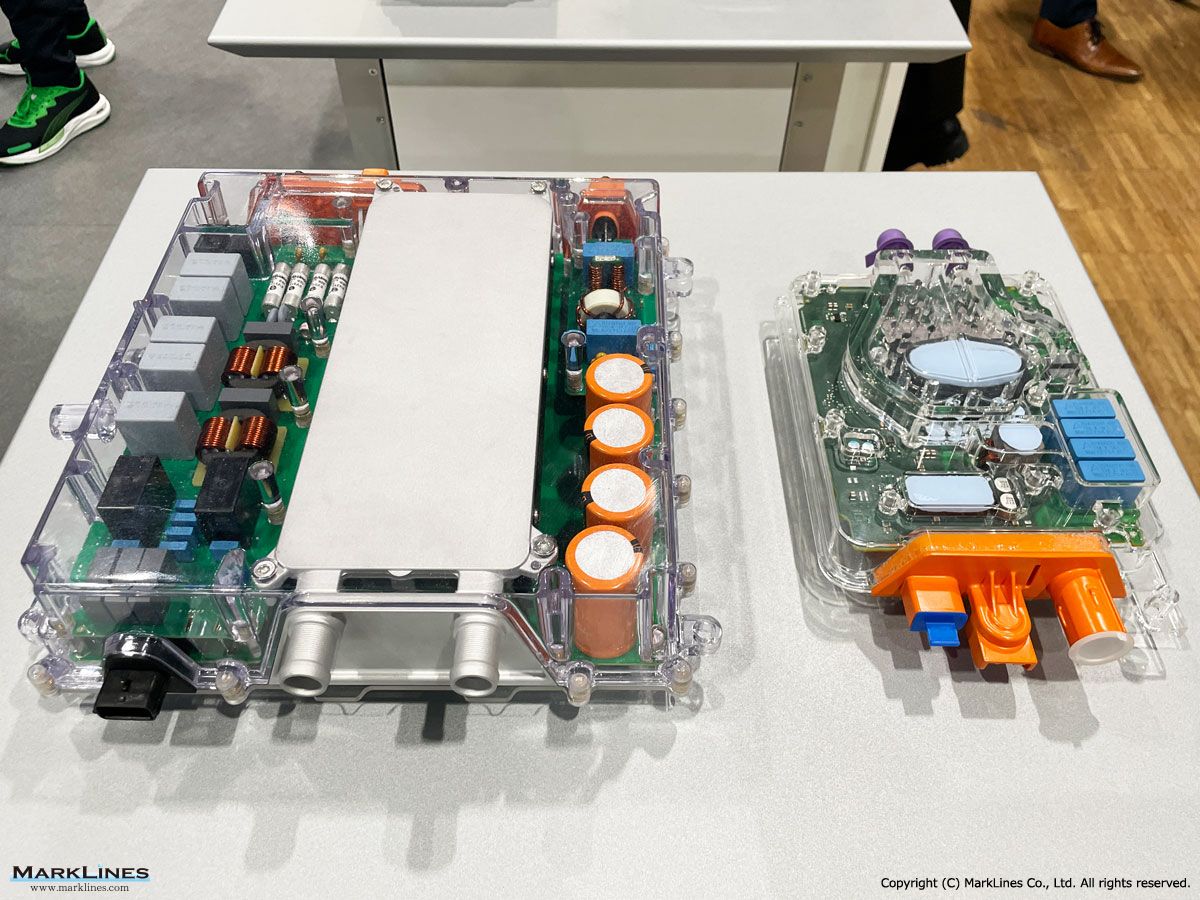
Power Distribution Box
 1
1
DCDC Converter/HV Box 3.0
 2
2
By-wire brake actuator
 2
2
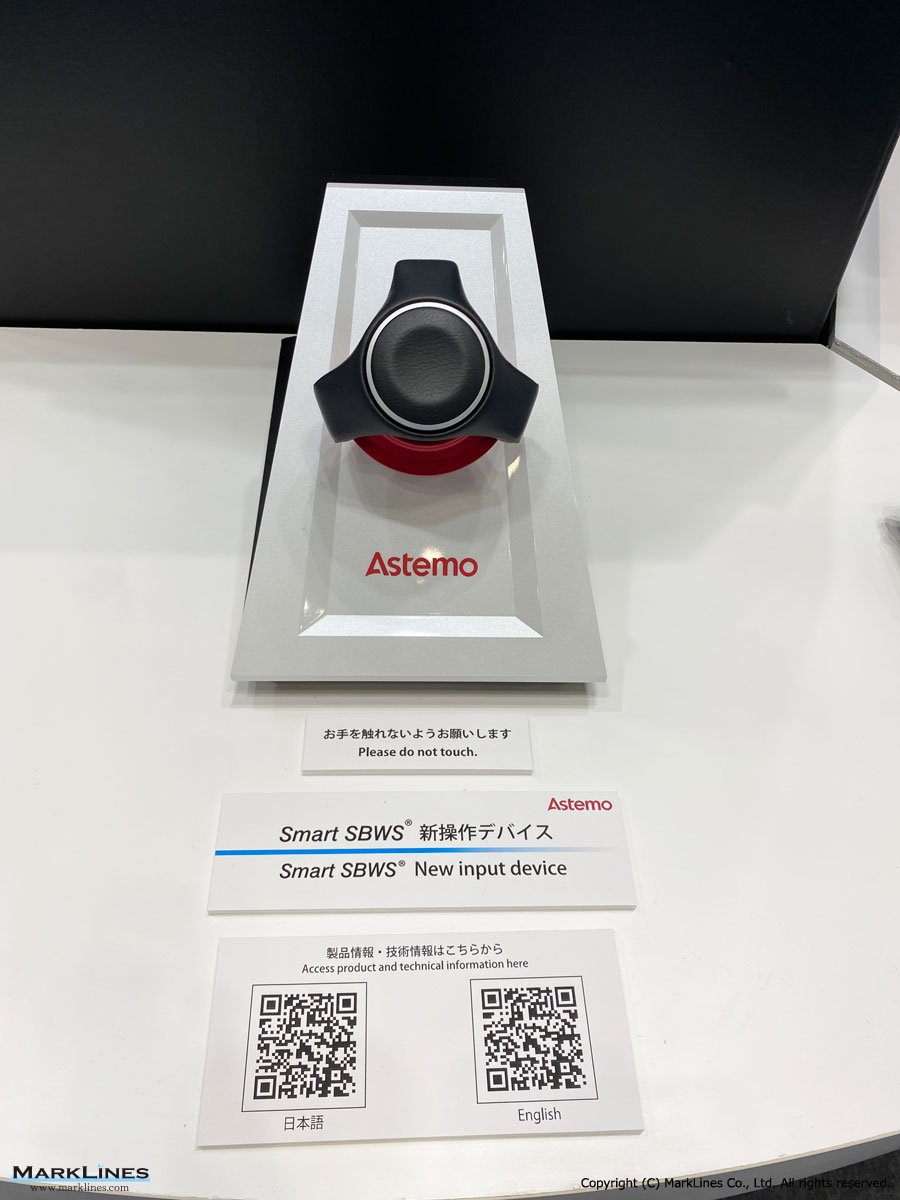
Smart SBWS
 1
1
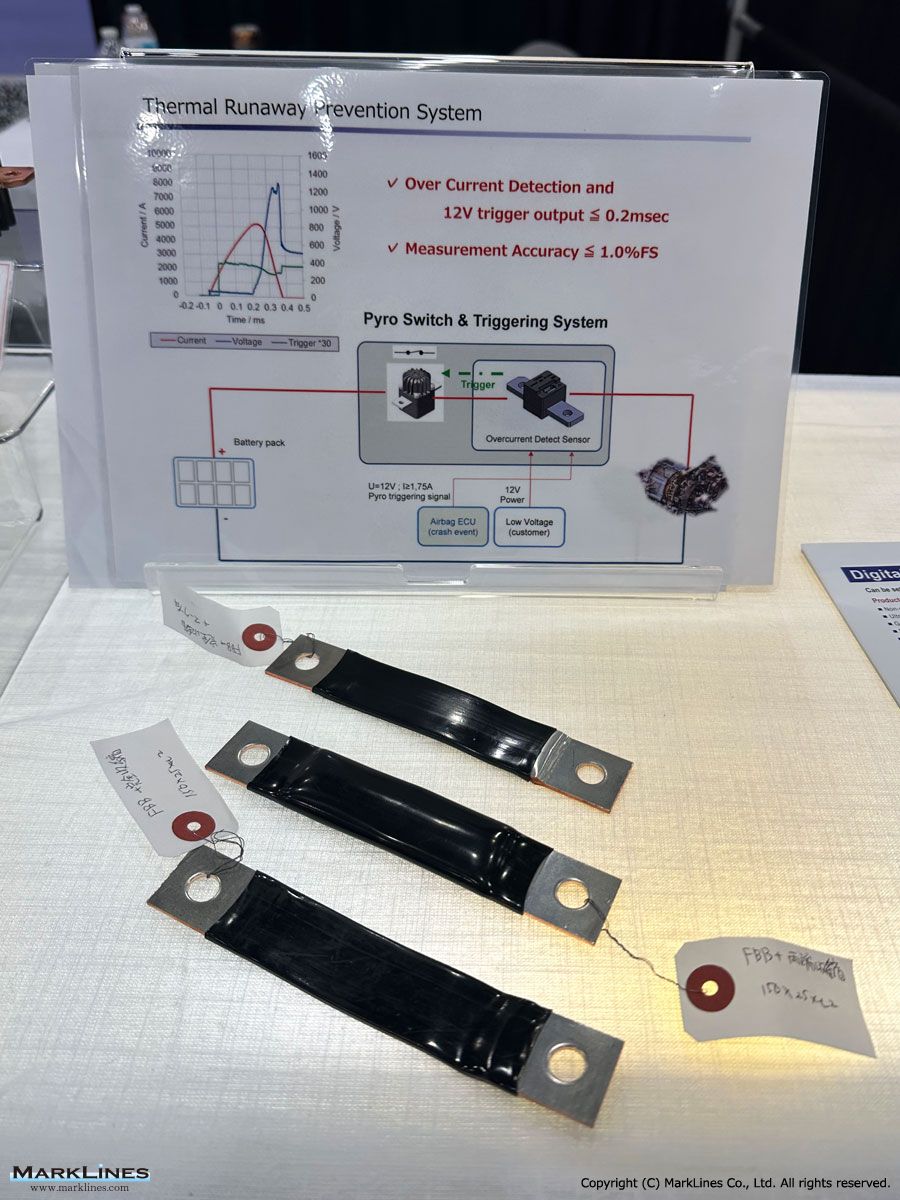
Flexible Busbar
 1
1
BMW S-Box
 2
2
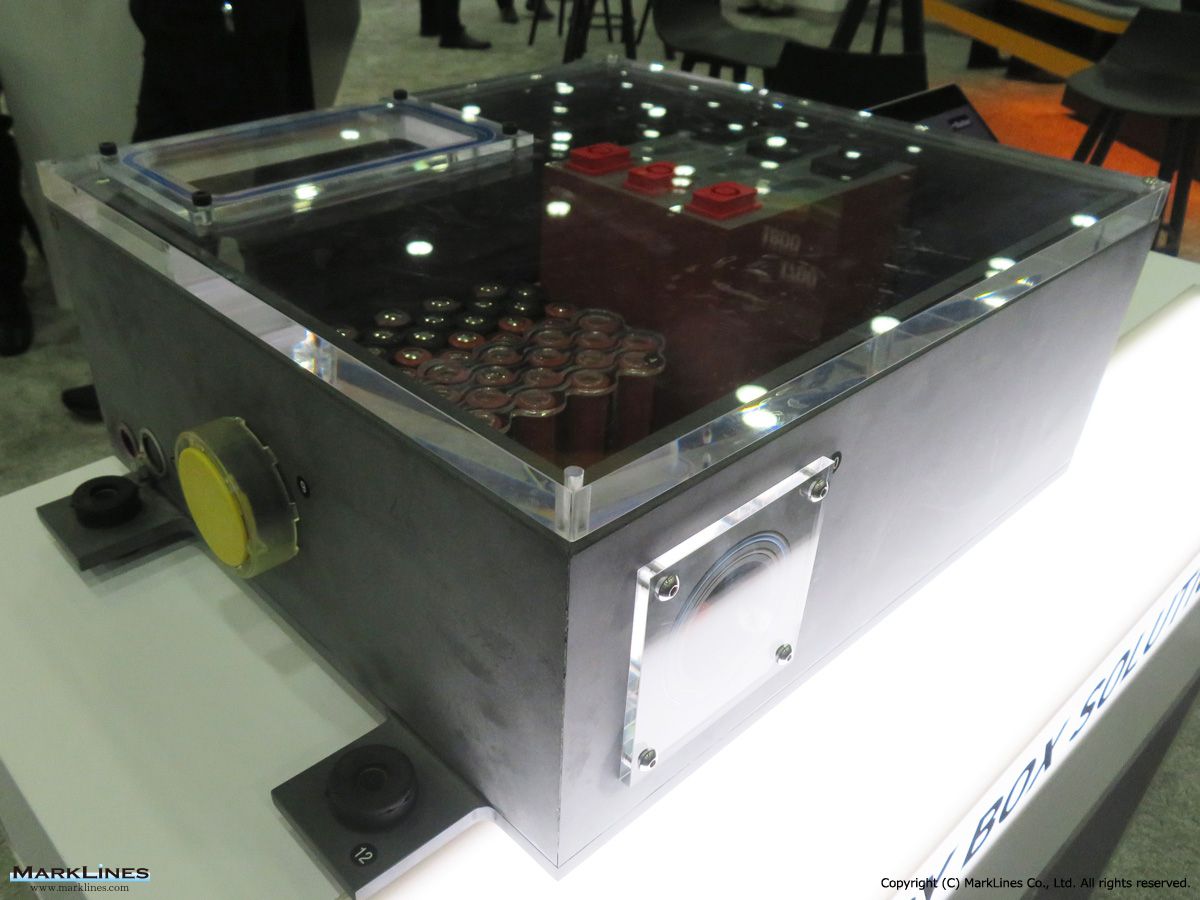
Battery box technology demonstrator
 2
2
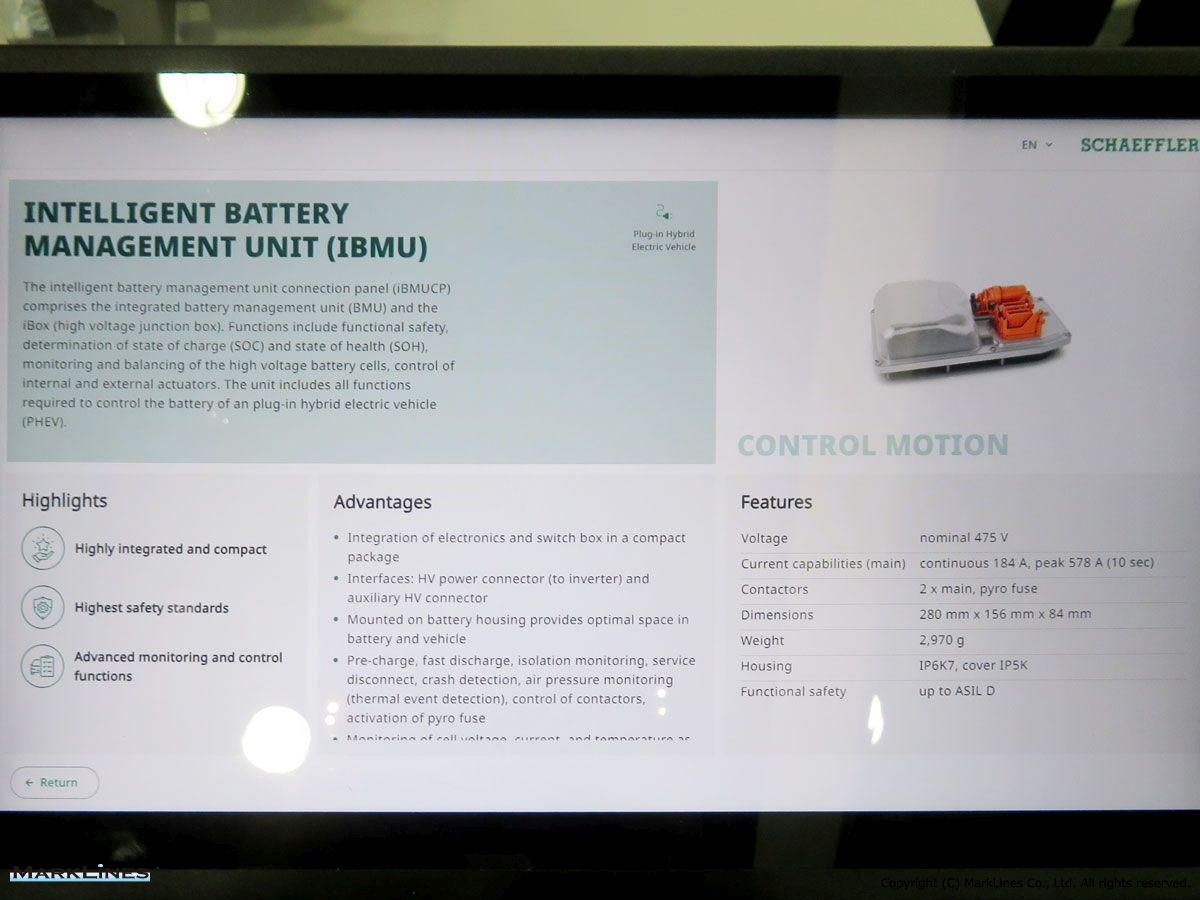
Intelligent Battery Management Unit
Sort by :
1 - 13 of 13 results
Japan - New car sales in 2026 by OEM, model, vehicle type
s 2 0.1% 14 0.7% -85.7% 66 2.2% 79 2.2% -16.5% Total 1,489 100.0% 1,868 100.0% -20.3% 3,016 100.0% 3,599 100.0% -16.2% Source: Japan Automobile Dealers AssociationJapan - Top 10 best selling models - Maker/Brand Model Mar. 2026 Mar. 2025 Y-o-Y Jan.-Mar.2026 Jan.-Mar.2025 Y-o-Y 1 Honda N BOX 21,342 23,627 -9.7% 56,383 58,844 -4.2% 2 Suzuki Suzuki Spacia 16,039 16,463 -2.6% 44,528 47,063 -5.4% 3 Daihatsu Move 14,690 9,579 53.4% 36,6...
Automotive Sales Data Updated at: 2026/05/11
Representative models for each segment
ical models included in each segment. (Refer to sales volume in 2025) Segment Representative models North America Europe China Japan Other Sedan/Hatchback A (Basic) Fiat 500, JAC E10X, Auteco D2S Fiat Panda, Hyundai i10, Kia Morning BYD Seagull, Wuling Hongguang MINIEV, Changan Lumin Honda N-BOX, Suzuki Spacia, Daihatsu Tanto Suzuki Wagon R, Perodua Axia, Fiat Mobi B (Small) Chevrolet Aveo, Kia Soul, Nissan March (Micra) Renault Clio, Da...
Automotive Sales Data Updated at: 2026/03/10
Japan - New car sales in 2025 by OEM, model, vehicle type
thers 47 5.9% 23 3.1% 104.3% 192 1.9% 180 1.8% 6.7% Total 794 100.0% 732 100.0% 8.5% 9,906 100.0% 10,097 100.0% -1.9% Source: Japan Automobile Dealers AssociationJapan - Top 10 best selling models - Maker/Brand Model Dec. 2025 Dec. 2024 Y-o-Y Jan.-Dec. 2025 Jan.-Dec. 2024 Y-o-Y 1 Honda N BOX 15,570 14,849 4.9% 201,354 206,272 -2.4% 2 Toyota Yaris 11,602 15,244 -23.9% 166,534 166,162 0.2% 3 Suzuki Suzuki Spacia 11,397 12,543 -9.1% 1...
Automotive Sales Data Updated at: 2026/02/02
Volume data search results
ad a file containing information with many models or countries versus a file with few models or countries. Regarding graphs The graph shows the top ten entries for the selected category. Figures for vehicles below the top ten are consolidated and shown as "Other". Uncheck the corresponding check box below the graph to remove categories. Display categories by adding a check to the corresponding check box. This is useful in cases like when there...
Automotive Sales Data Updated at: 2025/12/09
Japan - New car sales in 2024 by OEM, model, vehicle type
ers 23 3.1% 13 1.4% 76.9% 180 1.8% 72 0.9% 150.0% Total 732 100.0% 934 100.0% -21.6% 10,097 100.0% 8,410 100.0% 20.1% Source: Japan Automobile Dealers AssociationJapan - Top 10 best selling models - Maker/Brand Model Dec. 2024 Dec. 2023 Y-o-Y Jan.-Dec. 2024 Jan.-Dec. 2023 Y-o-Y 1 Honda N BOX 14,849 19,681 -24.6% 206,272 231,385 -10.9% 2 Suzuki Suzuki Spacia 12,940 11,571 11.8% 172,311 133,480 29.1% 3 Toyota Corolla 12,712 11,411 11...
Automotive Sales Data Updated at: 2025/07/02
Japan - Flash report, Automotive sales volume, 2023
Others 13 1.4% 9 1.5% 44.4% 72 0.9% 40 0.7% 80.0% Total 934 100.0% 592 100.0% 57.8% 8,410 100.0% 5,480 100.0% 53.5% Source: Japan Automobile Dealers Association Japan - Top 10 best selling models - Maker/Brand Model Dec. 2023 Dec. 2022 Y-o-Y Jan.-Dec. 2023 Jan.-Dec. 2022 Y-o-Y 1 Honda N BOX 19,681 16,760 17.4% 231,385 202,197 14.4% 2 Toyota Yaris 14,255 11,192 27.4% 194,364 168,558 15.3% 3 Daihatsu Hijet 13,303 13,946 -4.6% 165,73...
Automotive Sales Data Updated at: 2025/06/04
Japan - Flash report, Automotive sales volume, 2022
-% Others 9 1.5% 0 0.0% -% 40 0.7% 35 0.5% 14.3% Total 592 100.0% 495 100.0% 19.6% 5,480 100.0% 6,880 100.0% -20.3% Source: Japan Automobile Dealers AssociationJapan - Top 10 best selling models - Maker/Brand Model Dec. 2022 Dec. 2021 Y-o-Y Jan.-Dec. 2022 Jan.-Dec. 2021 Y-o-Y 1 Honda N BOX 16,760 13,439 24.7% 202,197 188,940 7.0% 2 Daihatsu Hijet 13,946 11,065 26.0% 185,220 152,124 21.8% 3 Toyota Yaris 11,192 16,907 -33.8% 168,55...
Automotive Sales Data Updated at: 2025/06/04
Japan - Flash report, Automotive sales volume, 2021
5 100.0% 615 100.0% -19.5% 6,880 100.0% 9,334 100.0% -26.3% Source: Japan Automobile Dealers Association Japan - Top 10 best selling models - Maker/Brand Model Dec. 2021 Dec. 2020 Y-o-Y Jan.-Dec. 2021 Jan.-Dec. 2020 Y-o-Y 1 Toyota Yaris 16,907 17,198 -1.7% 212,927 151,766 40.3% 2 Honda N BOX 13,439 13,427 0.1% 188,940 195,984 -3.6% 3 Daihatsu Hijet 11,065 12,039 -8.1% 152,124 141,399 7.6% 4 Toyota ROOMY 9,864 8,792 12.2% 134,801 87...
Automotive Sales Data Updated at: 2025/06/04
Japan - Flash report, Sales volume, 2020
Others 0 0.0% 0 0.0% -% 43 0.5% 76 0.6% -43.4% Total 615 100.0% 983 100.0% -37.4% 9,334 100.0% 13,586 100.0% -31.3% Source: Japan Automobile Dealers Association Japan - Top 10 best selling models - Maker/Brand Model Dec. 2020 Dec. 2019 Y-o-Y Jan.-Dec. 2020 Jan.-Dec. 2019 Y-o-Y 1 Honda N BOX 13,427 16,865 -20.4% 195,984 253,500 -22.7% 2 Toyota Yaris 17,198 - -% 151,766 - -% 3 Daihatsu Hijet 12,039 10,629 13.3% 141,399 151,074 -6.4%...
Automotive Sales Data Updated at: 2025/06/04
Sales and Production volume by model in India
ts upto-5, Length Normally between 4700 - 5000 mm, Engine Displacement Normally up to 3 Litre Luxury Seats upto-5, Length Normally Over 5000 mm, Engine Displacement Normally up to 5 Litre UV Utility Vehicles/ Sports Utility Vehicles; 2x4 or 4x4 offroad capability ; Generally ladder on frame ; 2 box ; 5 Seats or more but up to 10 Seats UV1 Length <4400 mm, Price Range Rs. 0 to 15 Lakh UV2 Length 4400 - 4700 mm, Price up to Rs. 15 Lakh U...
Automotive Sales Data Updated at: 2021/12/14
Japan - Flash report, Sales volume, 2019
0 0.0% 16 1.3% -100.0% 76 0.6% 44 0.3% 72.7% Total 983 100.0% 1,219 100.0% -19.4% 13,586 100.0% 13,702 100.0% -0.8% Source: Japan Automobile Dealers Association Japan - Top 10 best selling models - Maker/Brand Model Dec. 2019 Dec. 2018 Y-o-Y Jan.-Dec. 2019 Jan.-Dec. 2018 Y-o-Y 1 Honda N BOX 16,865 16,607 1.6% 253,500 241,870 4.8% 2 Daihatsu Tanto 8,081 9,805 -17.6% 175,292 136,558 28.4% 3 Suzuki Suzuki Spacia 12,270 12,143 1.0% 16...
Automotive Sales Data Updated at: 2020/01/23
Japan - Flash report, Sales volume, 2018
16 1.3% 3 0.3% 433.3% 44 0.3% 121 0.8% -63.6% Total 1,219 100.0% 932 100.0% 30.8% 13,702 100.0% 15,593 100.0% -12.1% Source: Japan Automobile Dealers Association Japan - Top 10 best selling models - Maker/Brand Model Dec. 2018 Dec. 2017 Y-o-Y Jan.-Dec. 2018 Jan.-Dec. 2017 Y-o-Y 1 Honda N BOX 16,607 18,458 -10.0% 241,870 218,478 10.7% 2 Suzuki Suzuki Spacia 12,143 8,757 38.7% 152,104 104,763 45.2% 3 Daihatsu Hijet 11,485 12,057 -4.7...
Automotive Sales Data Updated at: 2019/04/03
Japan - Flash report, Sales volume, 2017
3 0.3% 14 1.1% -78.6% 121 0.8% 170 1.1% -28.8% Total 932 100.0% 1,324 100.0% -29.6% 15,593 100.0% 15,498 100.0% 0.6% Source: Japan Automobile Dealers Association Japan - Top 10 best selling models - Maker/Brand Model Dec. 2017 Dec. 2016 Y-o-Y Jan.-Dec. 2017 Jan.-Dec. 2016 Y-o-Y 1 Honda N BOX 18,458 14,967 23.3% 218,478 186,367 17.2% 2 Toyota Prius 11,091 10,923 1.5% 143,290 220,998 -35.2% 3 Daihatsu Move 10,073 11,702 -13.9% 141,37...
Automotive Sales Data Updated at: 2018/07/24


 Japan
Japan USA
USA Mexico
 Germany
 China (Shanghai)
 Thailand
 India
India