
 AI Navigator


Search Results by Category
 AI Navigator
All information related to {{ key_word }}.
AI Navigation will guide you. Click here for information about {{ key_word }}.
Images
 3
3
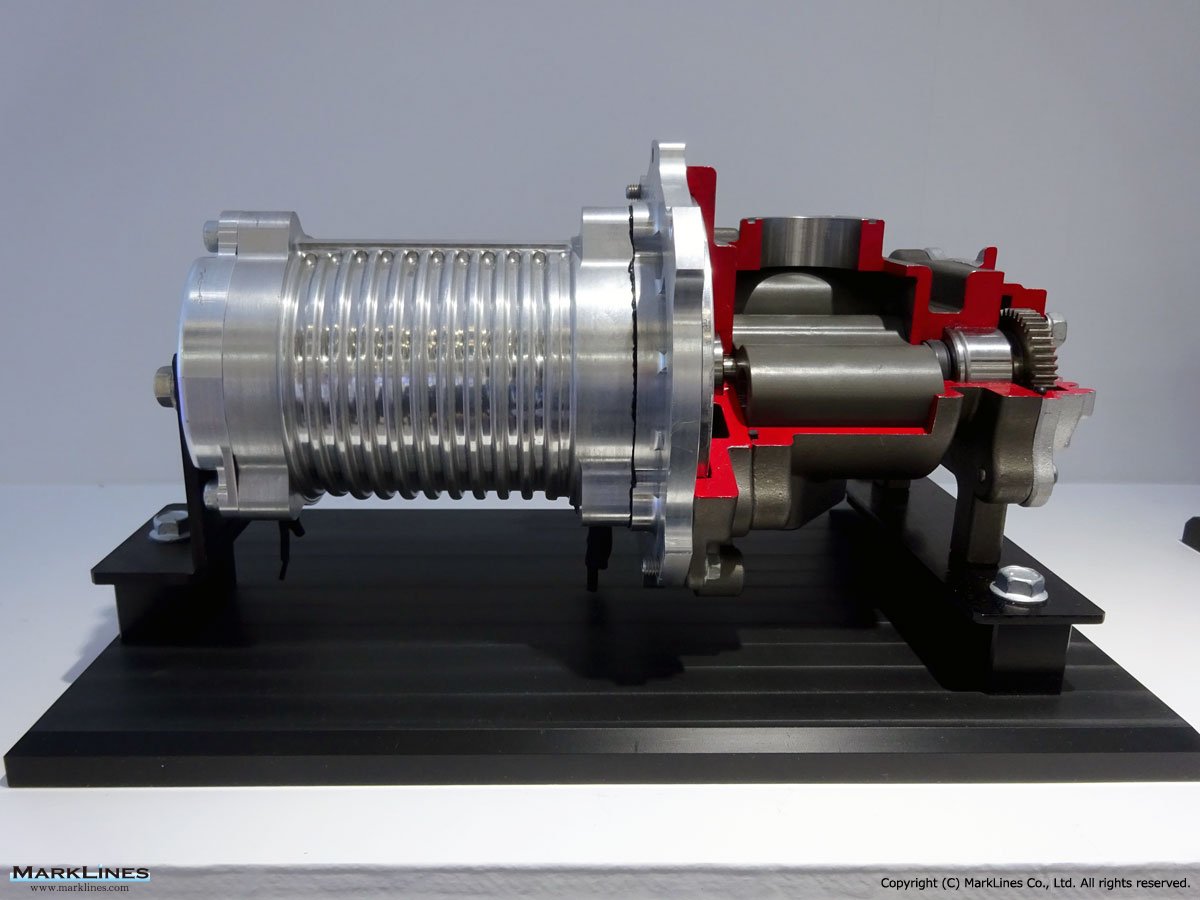
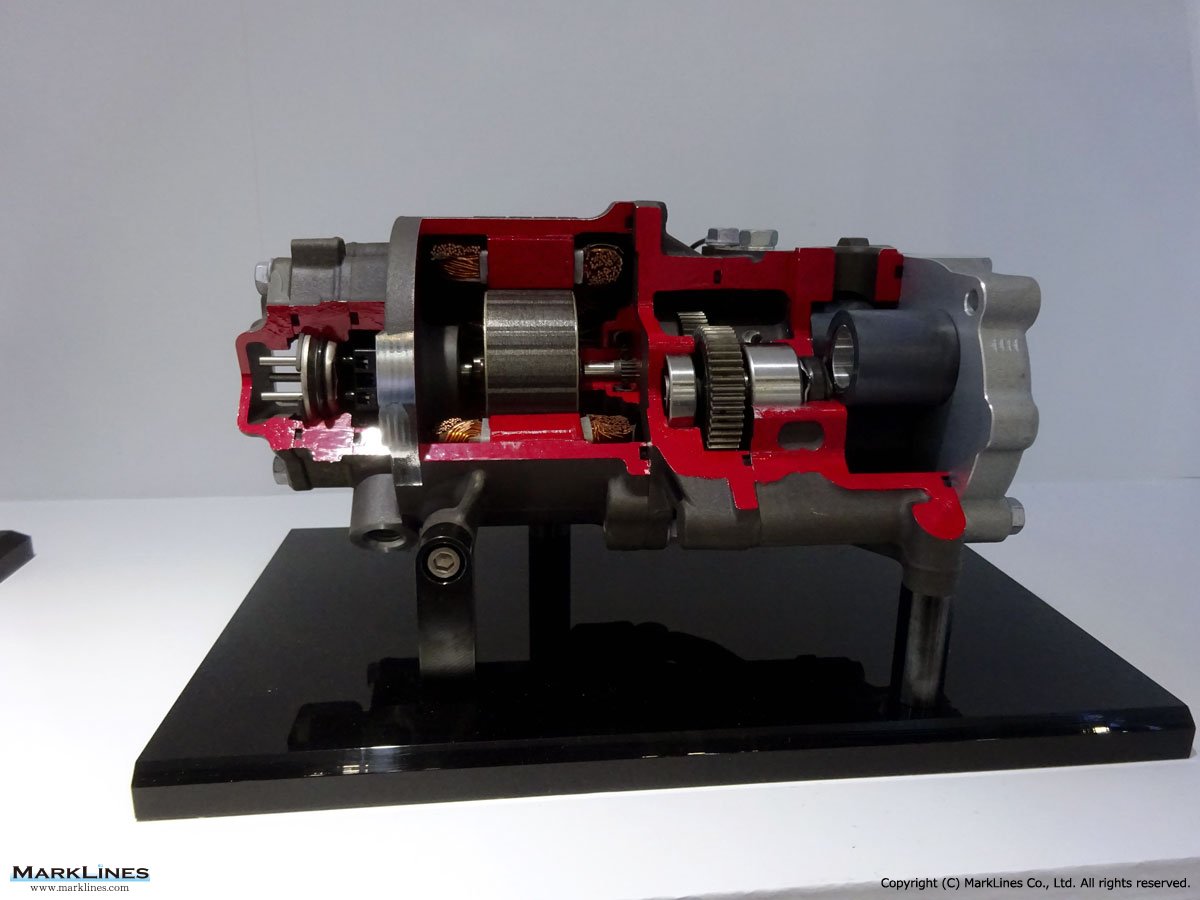
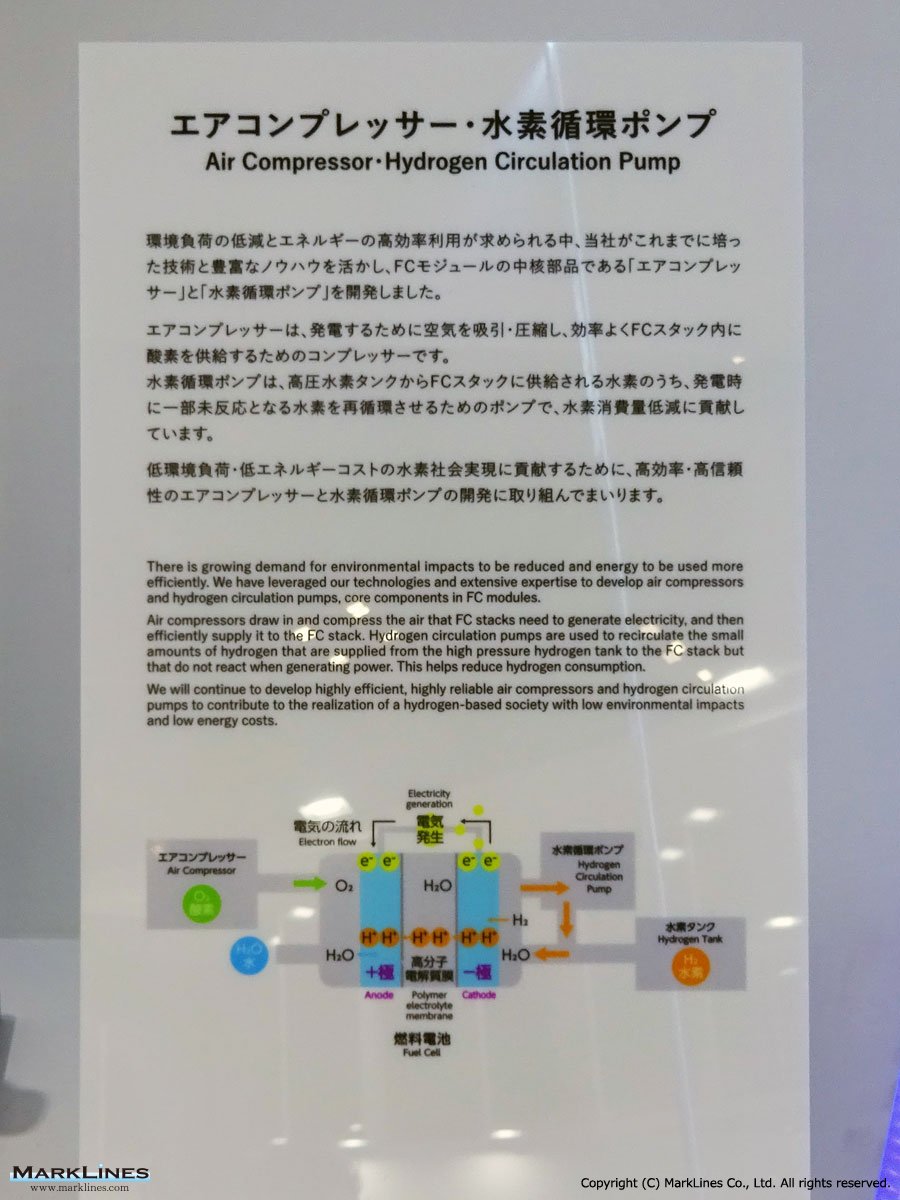
Air Compressor
 2
2
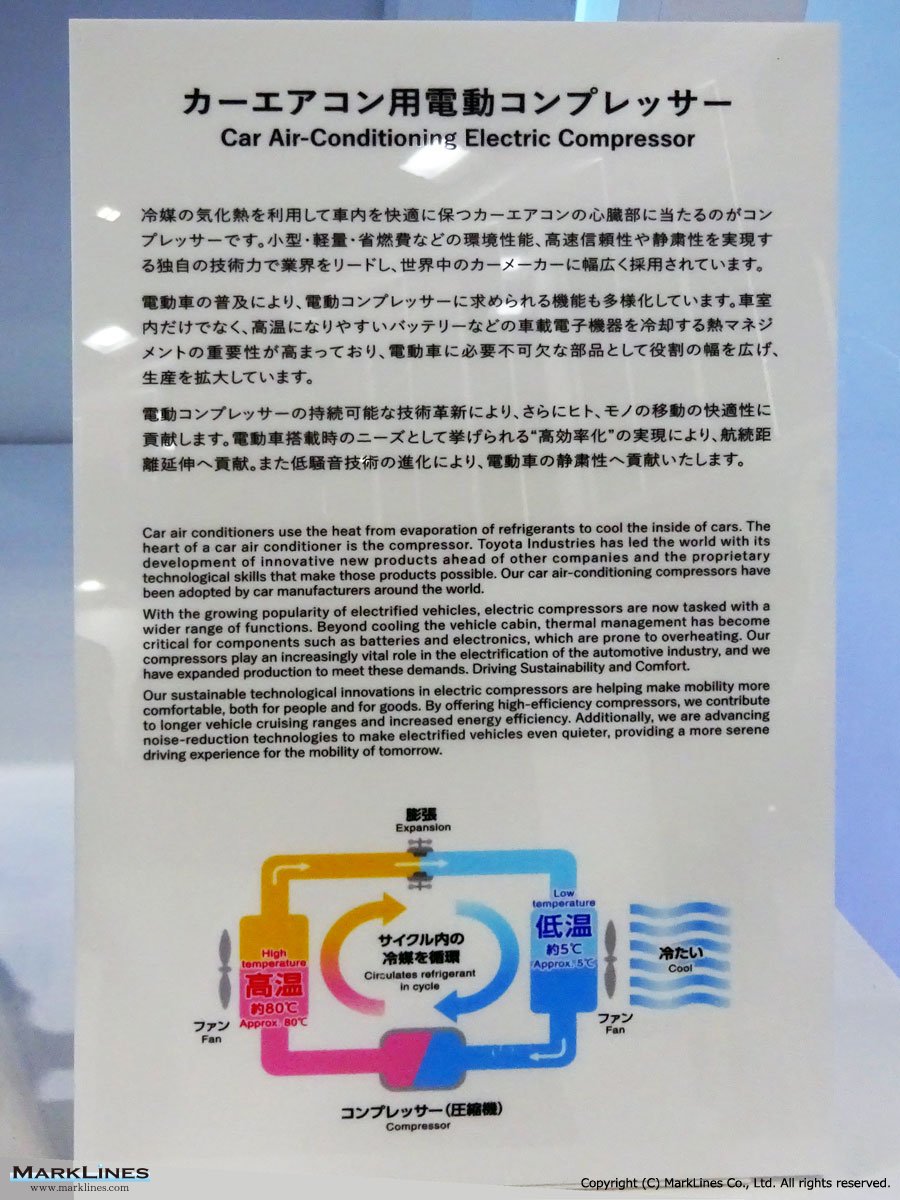
Car Air-Conditioning Electric Compressor
 4
4
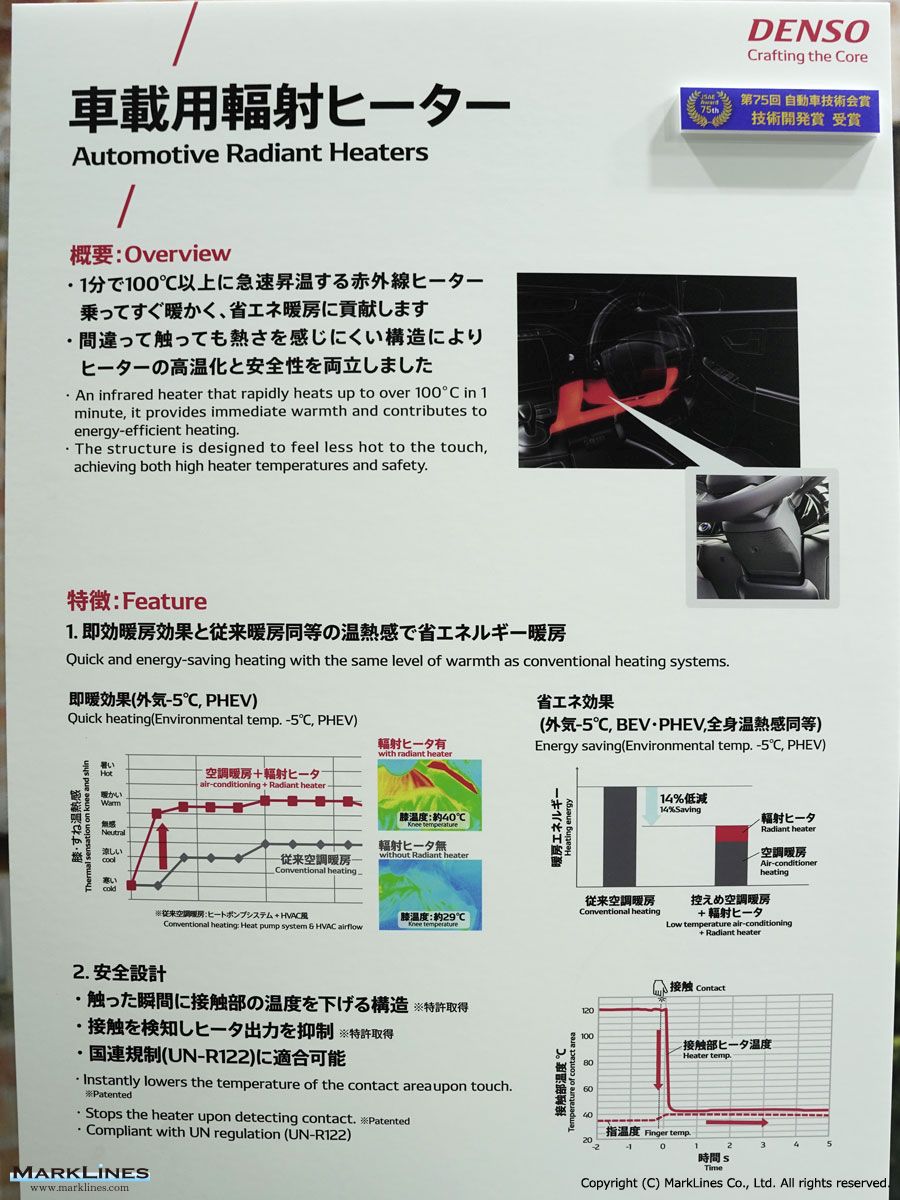
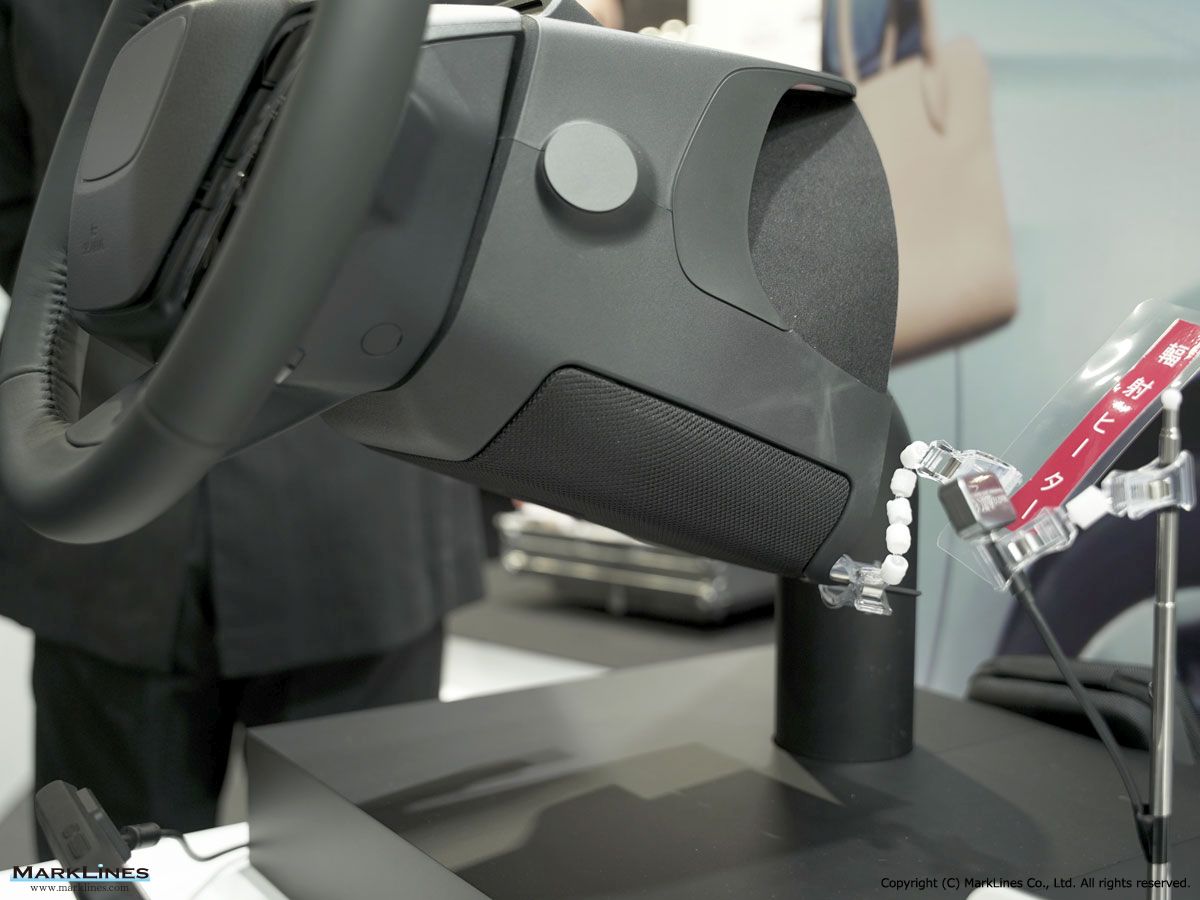
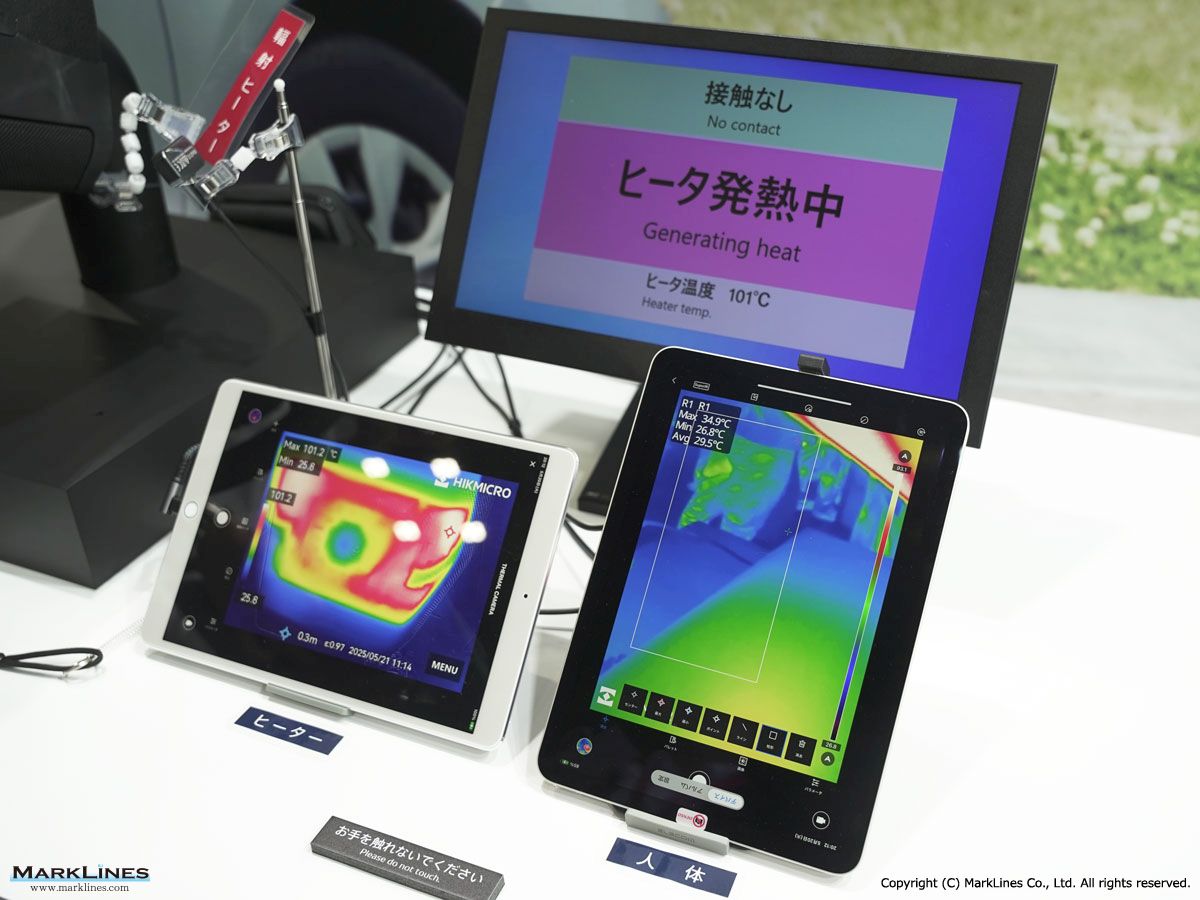
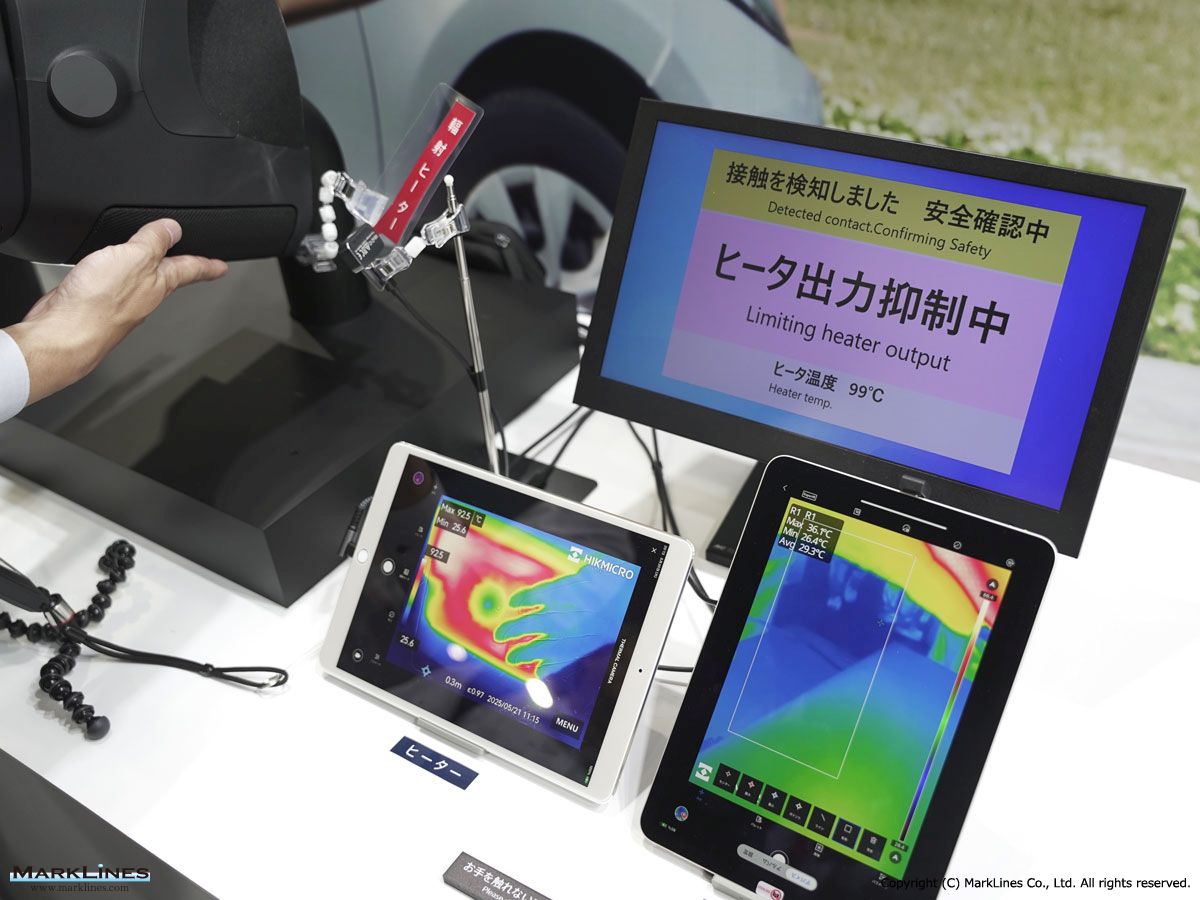
Automotive radiant heaters
 1
1
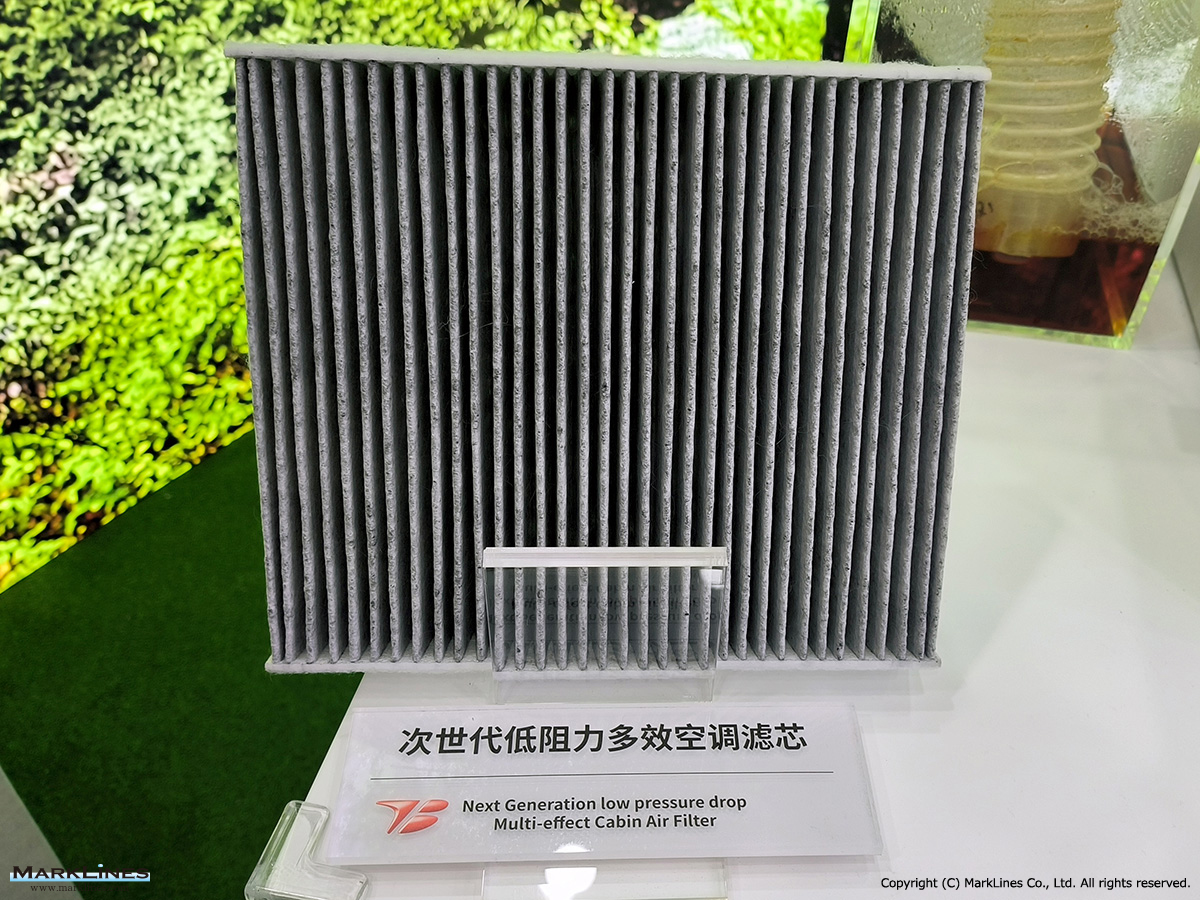
Next generation low pressure multi-effect cabin air filter
 1
1
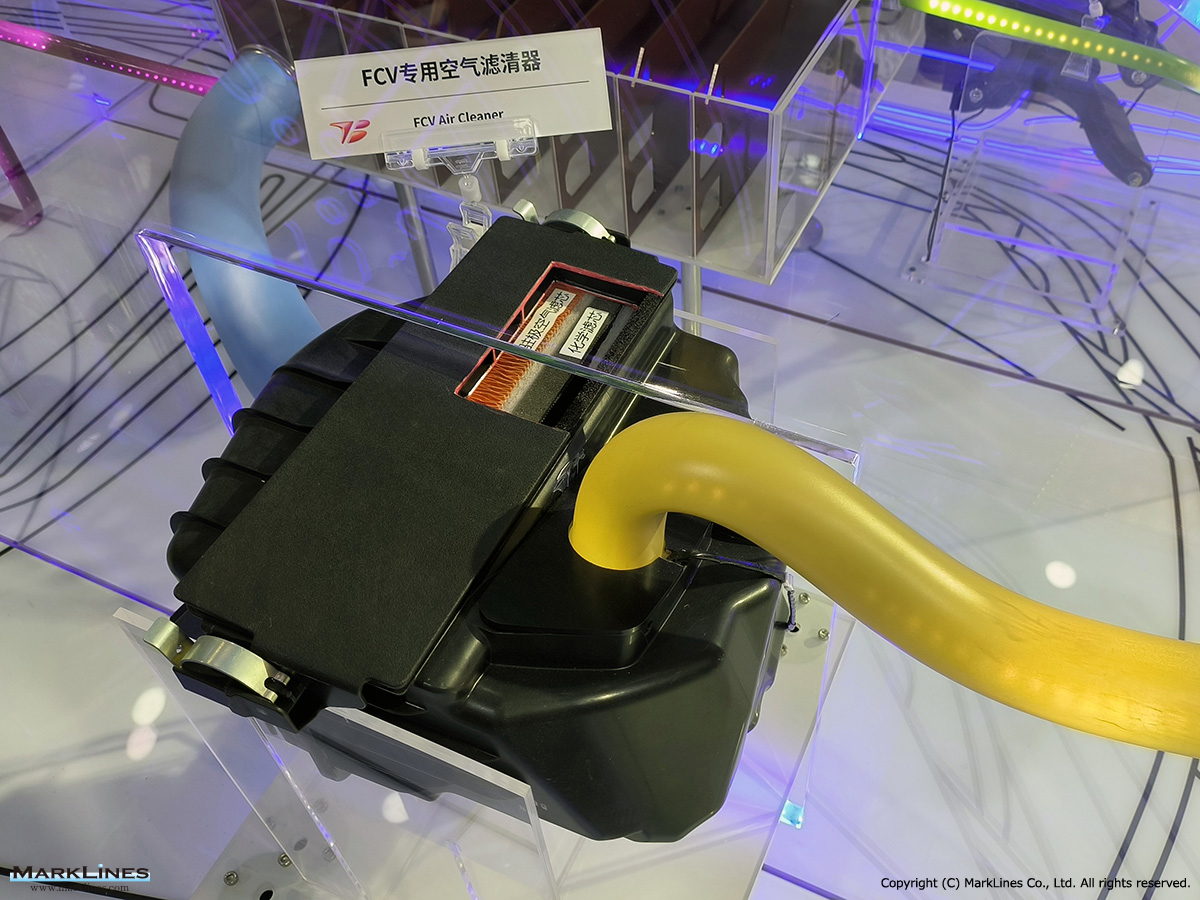
FCV Air Cleaner
 3
3
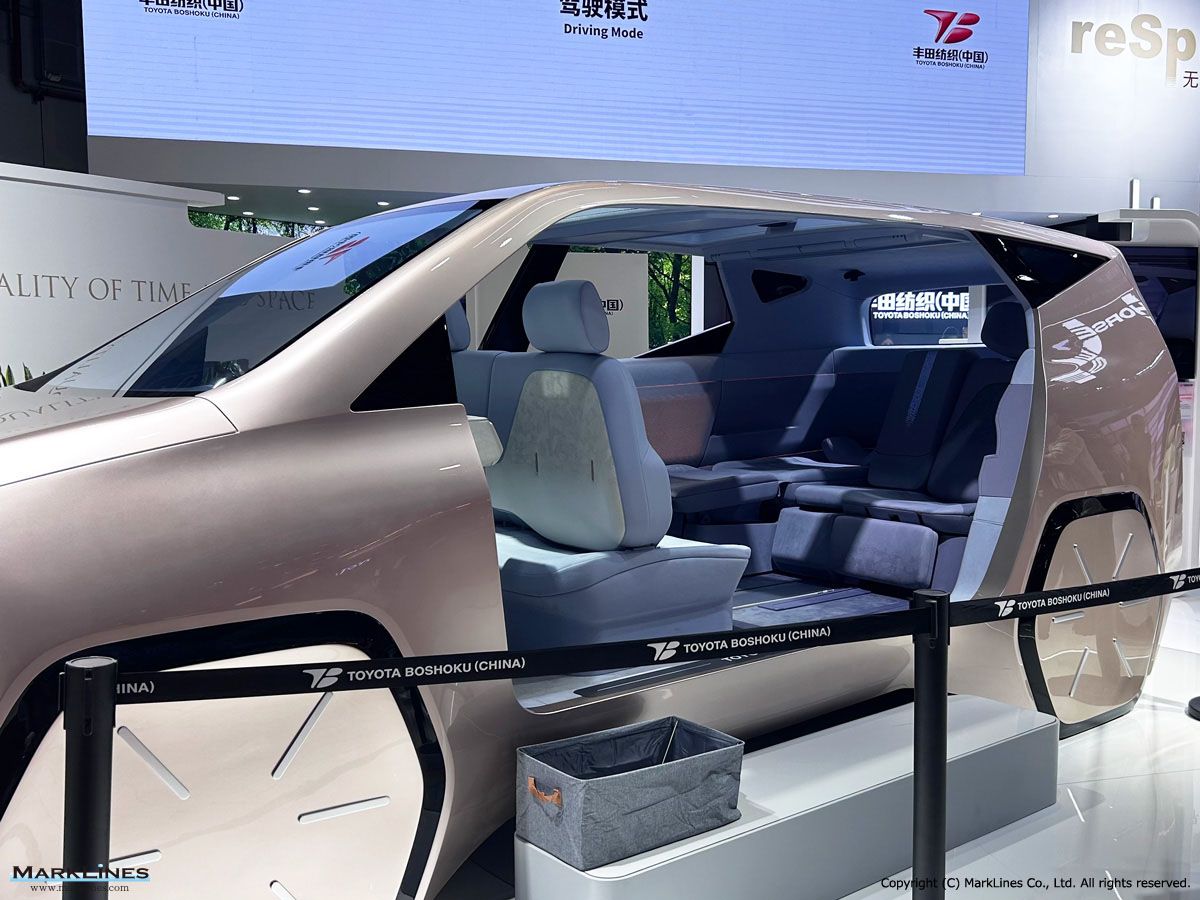
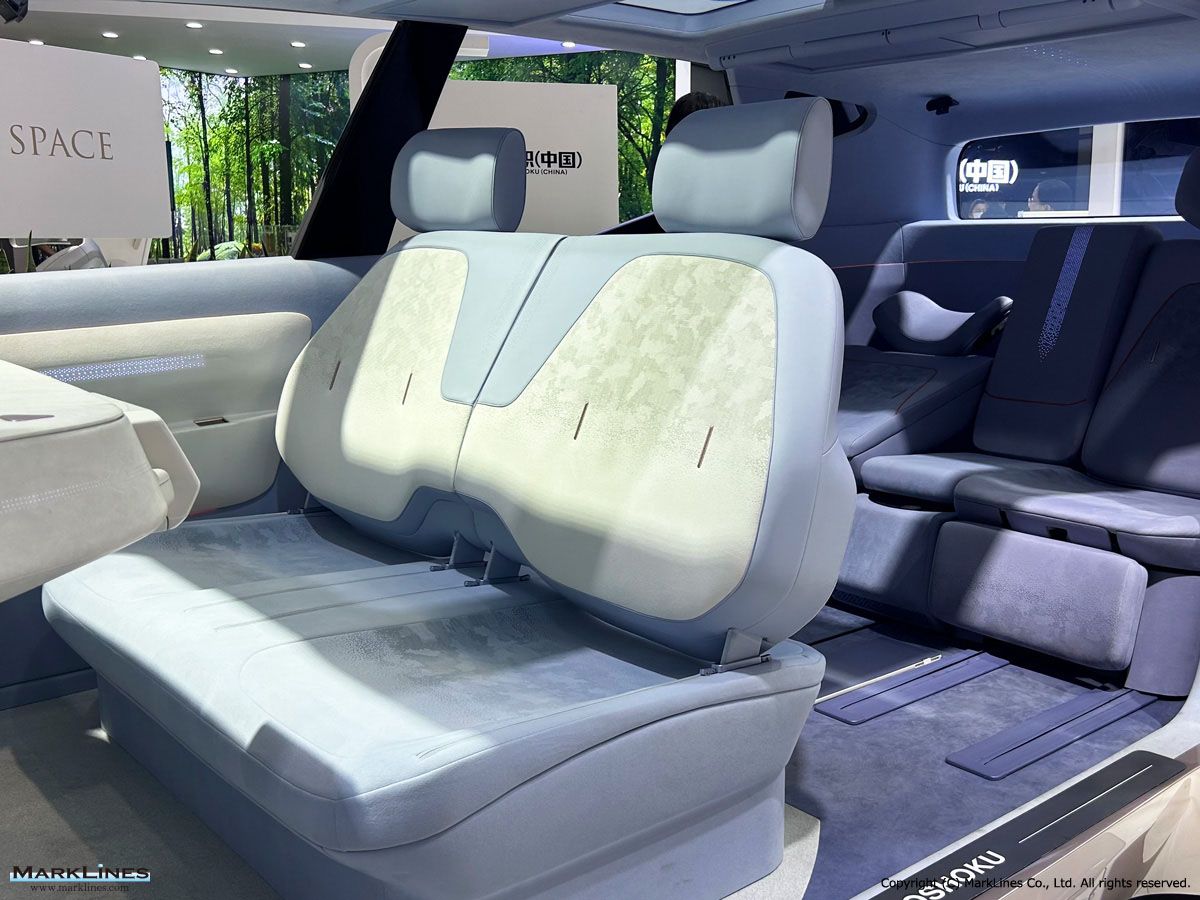
MX OASIS 2030 Smart Cockpit Mobility Space
 1
1
Aroma Cabin Air Filter
 1
1
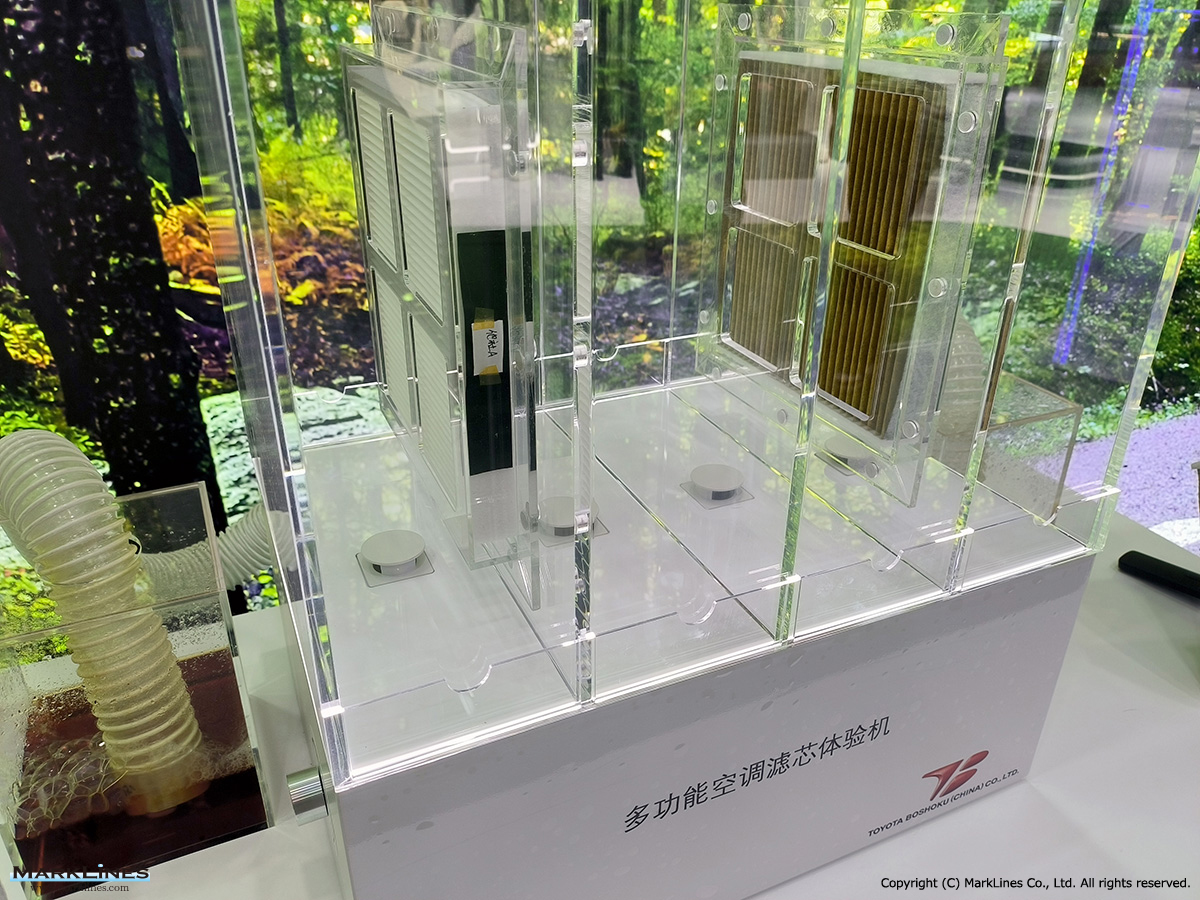
Multi-function Air Filter
 3
3
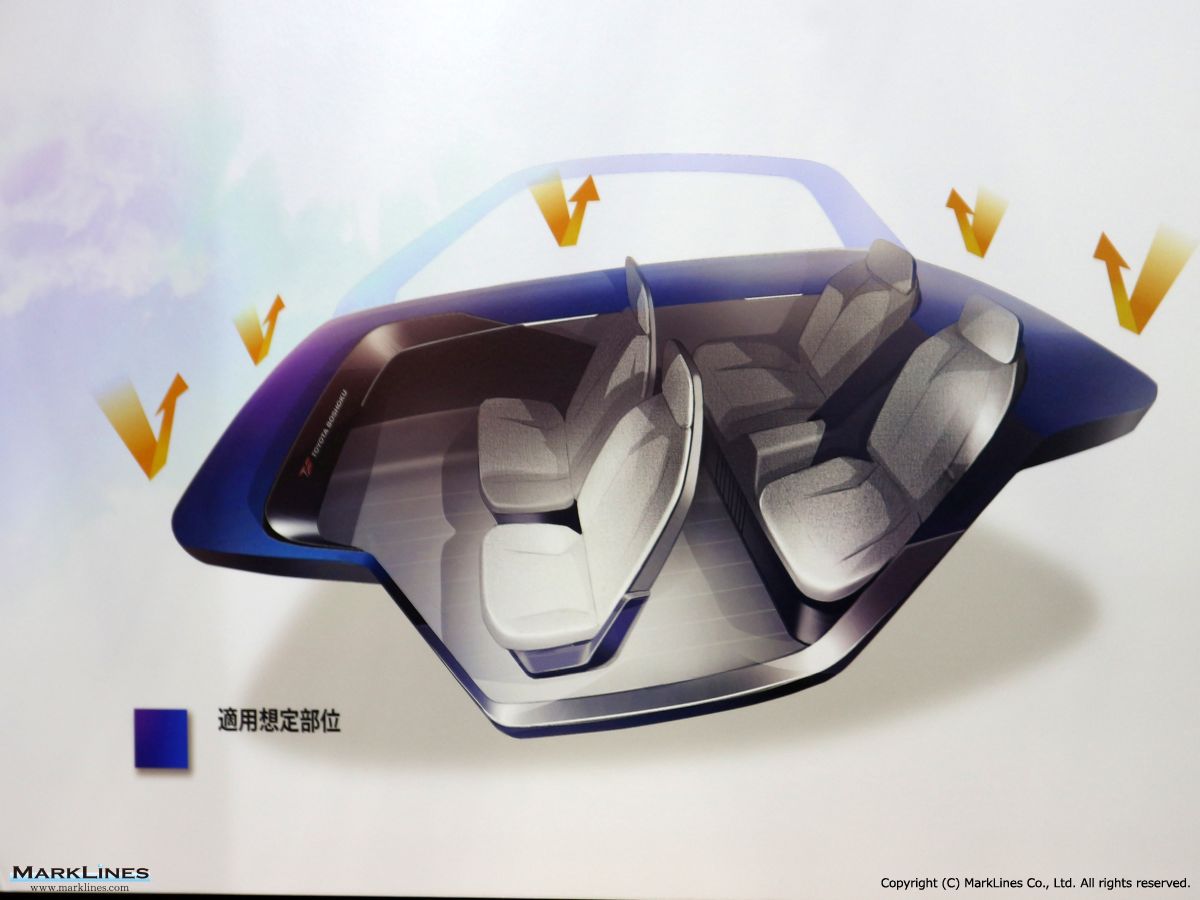
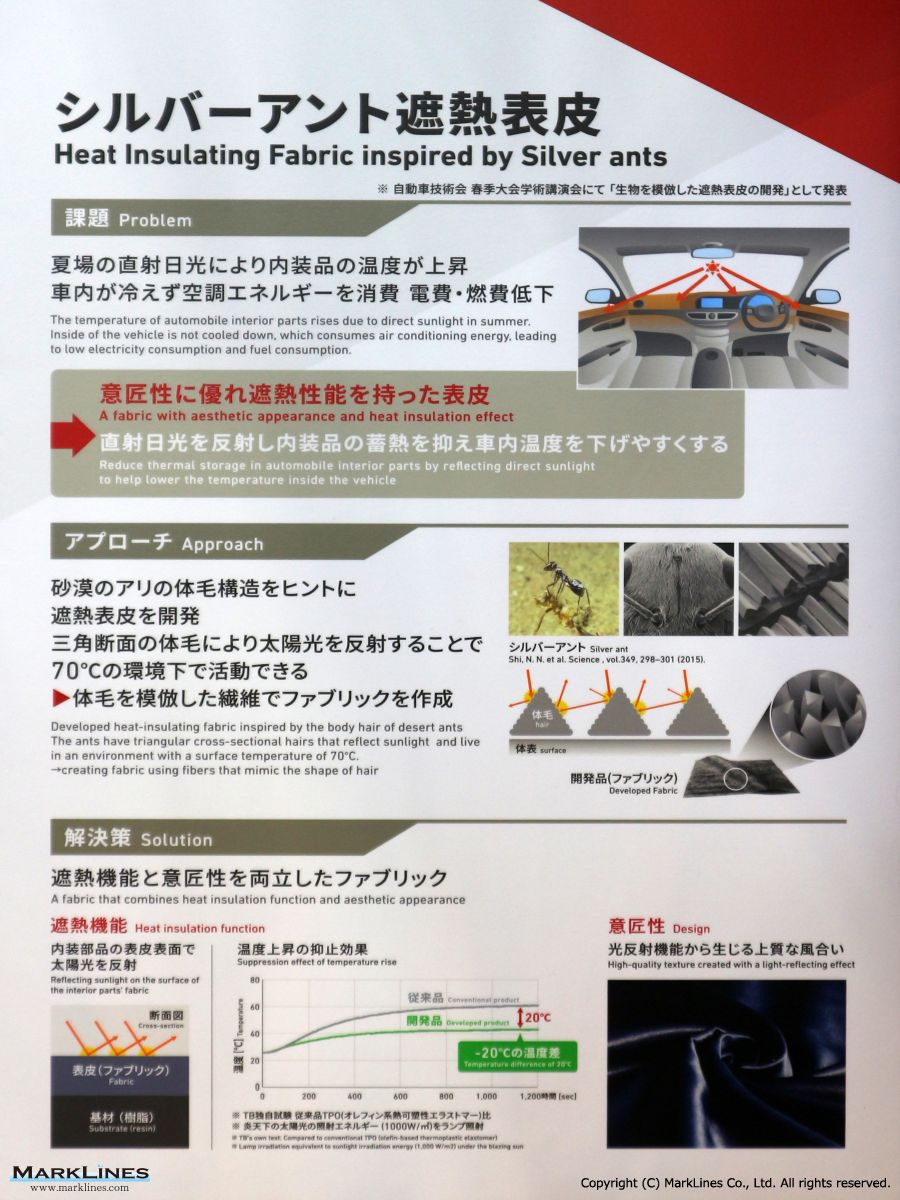
Heat insulating fabric inspired by silver ants
 2
2
Thermal comfort seat
Sort by :
1 - 4 of 4 results
UK - Flash report, Sales volume, 2020
7% -26.1% BMW 10,305 7.8% 14,117 9.5% -27.0% 115,476 7.1% 169,753 7.3% -32.0% Mercedes-Benz 7,480 5.6% 9,623 6.5% -22.3% 110,883 6.8% 171,823 7.4% -35.5% Audi 7,435 5.6% 8,701 5.8% -14.6% 107,842 6.6% 138,924 6.0% -22.4% Vauxhall 7,283 5.5% 6,212 4.2% 17.2% 95,444 5.9% 159,830 6.9% -40.3% Toyota 5,711 4.3% 4,726 3.2% 20.8% 91,793 5.6% 105,192 4.6% -12.7% Nissan 7,124 5.4% 5,309 3.6% 34.2% 71,932 4.4% 92,372 4.0% -22.1% Kia 3,589 2.7...
Automotive Sales Data Updated at: 2025/06/04
UK - Flash report, Sales volume, 2019
167.7% to 1,028 units in December.Sales of taxis decreased 29.6% in December to 152 units.Mike Hawes, CEO of SMMT said "A third year of decline for the UK new car market is a significant concern for industry and the wider economy. Political and economic uncertainty, and confusing messages on clean air zones have taken their toll on buyer confidence, with demand for new cars at a six-year low. A stalling market will hinder industry’s ability to...
Automotive Sales Data Updated at: 2020/01/10
UK - Flash report, Sales volume, 2018
7.7% -9.1% Mercedes-Benz 11,365 7.9% 10,427 6.8% 9.0% 172,238 7.3% 180,970 7.1% -4.8% BMW 11,600 8.1% 13,471 8.8% -13.9% 172,048 7.3% 175,101 6.9% -1.7% Audi 6,310 4.4% 10,671 7.0% -40.9% 143,739 6.1% 174,982 6.9% -17.9% Nissan 5,294 3.7% 7,759 5.1% -31.8% 102,637 4.3% 151,156 5.9% -32.1% Toyota 2,936 2.0% 5,188 3.4% -43.4% 101,922 4.3% 101,985 4.0% -0.1% Kia 3,810 2.6% 3,773 2.5% 1.0% 95,764 4.0% 93,222 3.7% 2.7% Hyundai 4,009 2.8%...
Automotive Sales Data Updated at: 2019/01/08
UK - Flash report, Sales volume, 2017
9.3% -22.2% Mercedes-Benz 10,427 6.8% 10,220 5.7% 2.0% 180,970 7.1% 169,828 6.3% 6.6% BMW 13,471 8.8% 15,066 8.5% -10.6% 175,101 6.9% 182,593 6.8% -4.1% Audi 10,671 7.0% 11,319 6.4% -5.7% 174,982 6.9% 177,304 6.6% -1.3% Nissan 7,759 5.1% 10,628 6.0% -27.0% 151,156 5.9% 152,525 5.7% -0.9% Toyota 5,188 3.4% 4,642 2.6% 11.8% 101,985 4.0% 96,746 3.6% 5.4% Hyundai 5,026 3.3% 5,625 3.2% -10.6% 93,403 3.7% 92,419 3.4% 1.1% Kia 3,773 2.5% ...
Automotive Sales Data Updated at: 2018/07/24


 Japan
Japan USA
USA Mexico
 Germany
 China (Shanghai)
 Thailand
 India
India