


Search Results by Category
All information related to {{ key_word }}.
AI Navigator will guide you. Click here for information about {{ key_word }}.
Images
 1
1
R-Car X5H multi-domain SoC demo
 3
3
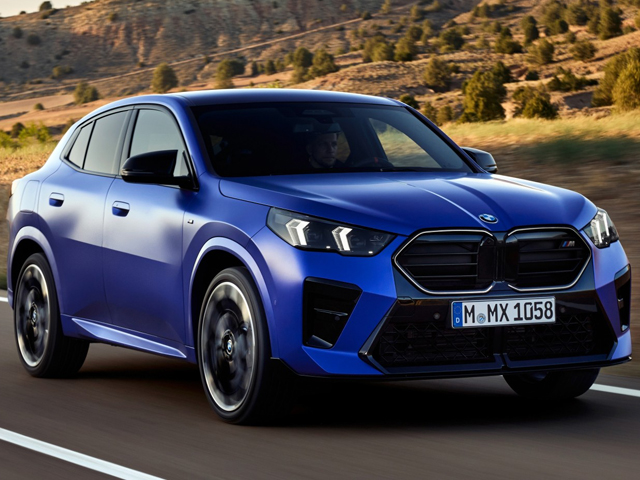
X2
 7
7
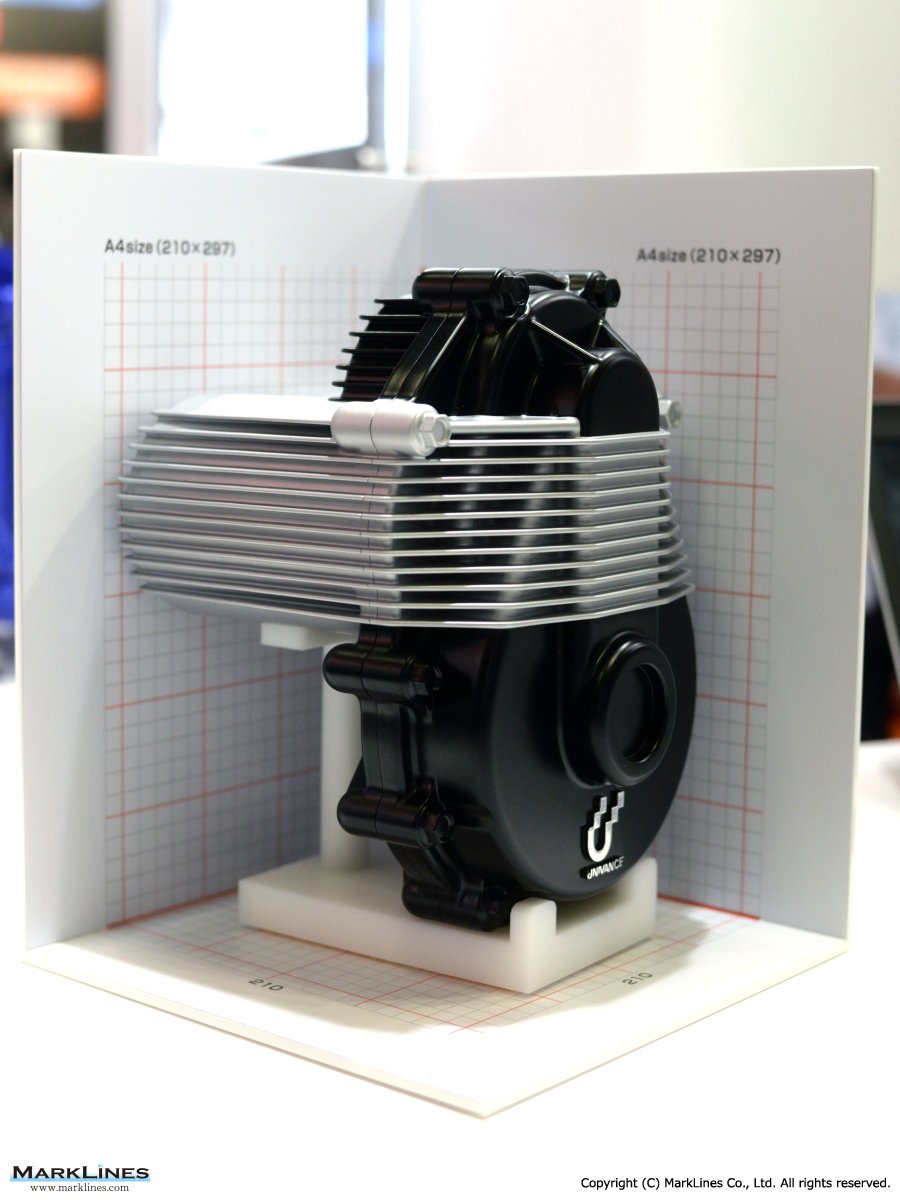
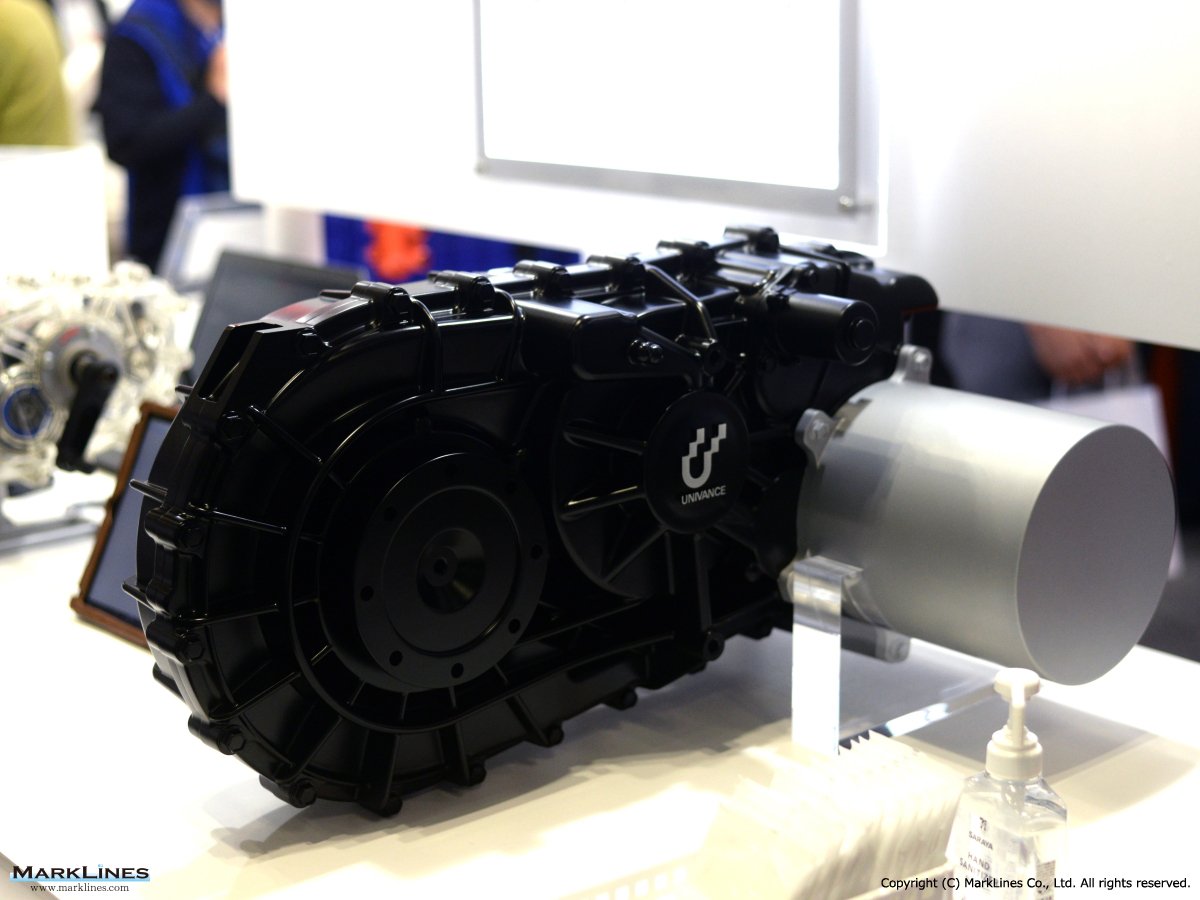
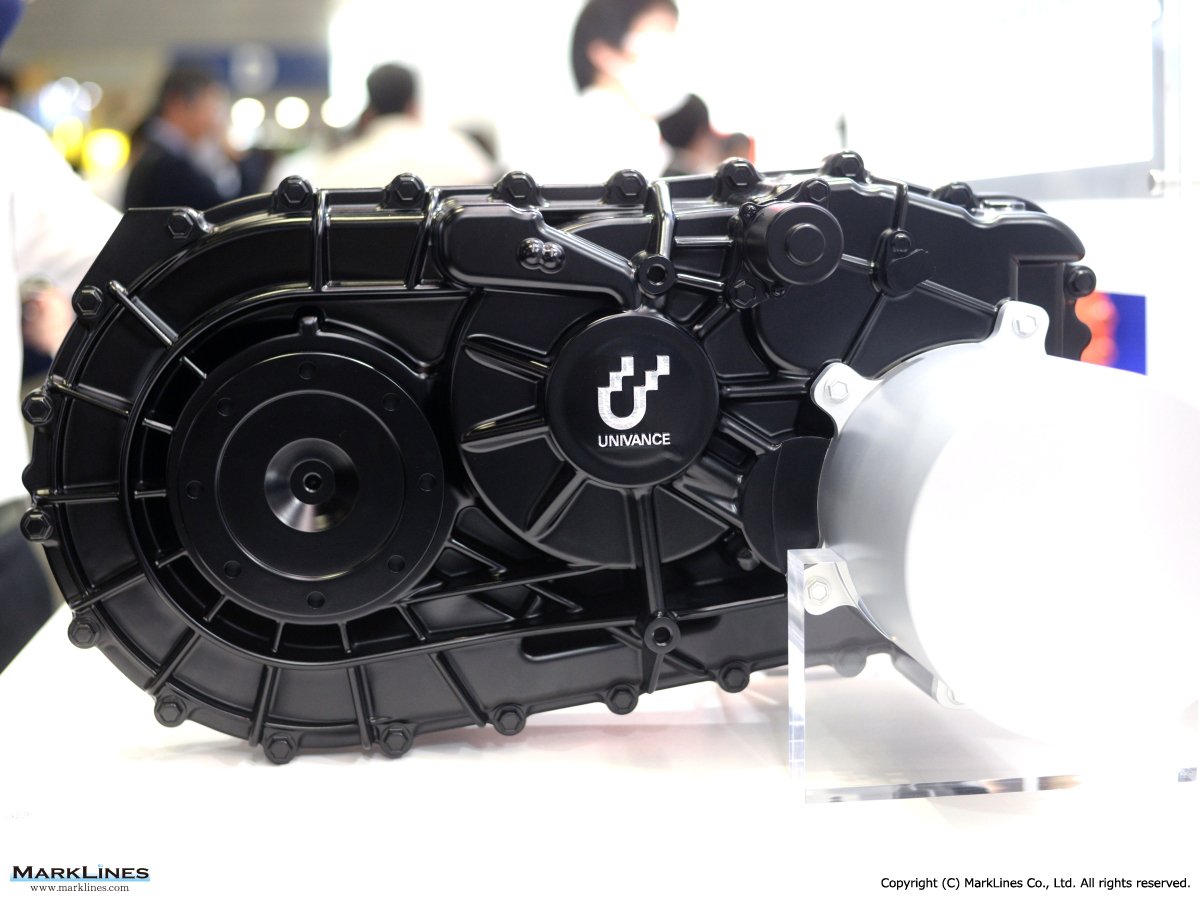
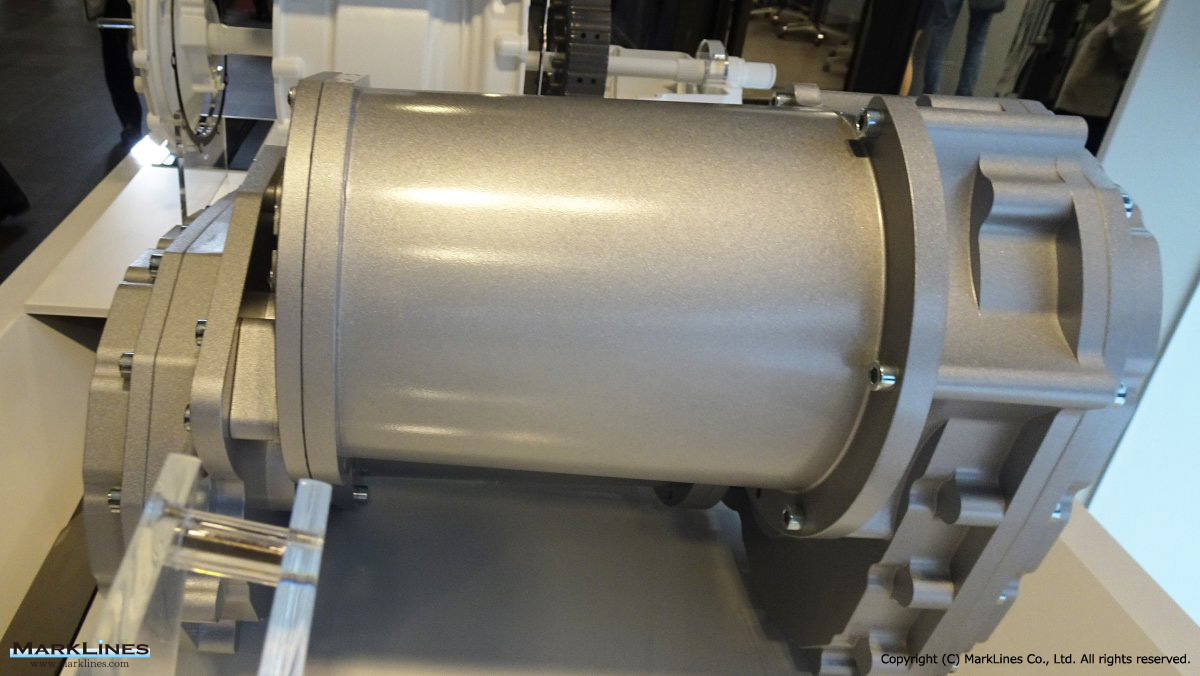
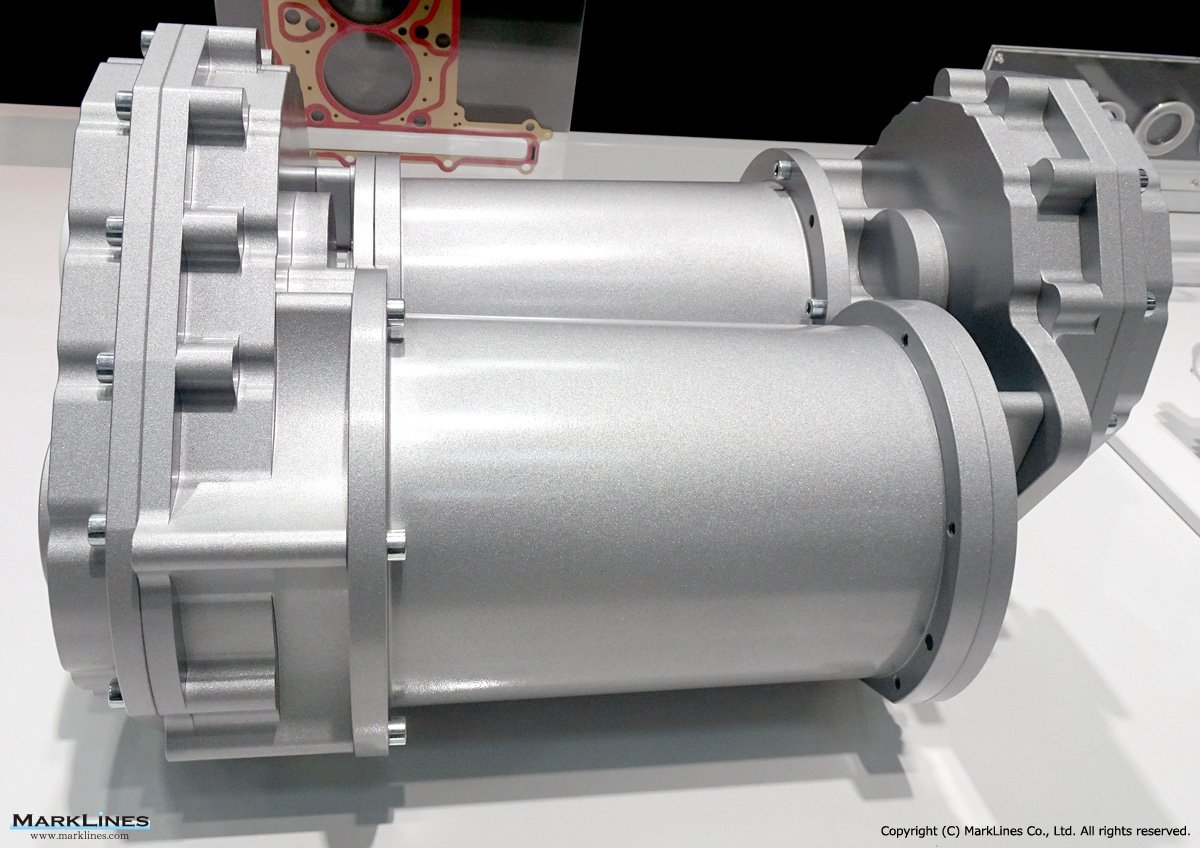
DMM Axle
 4
4
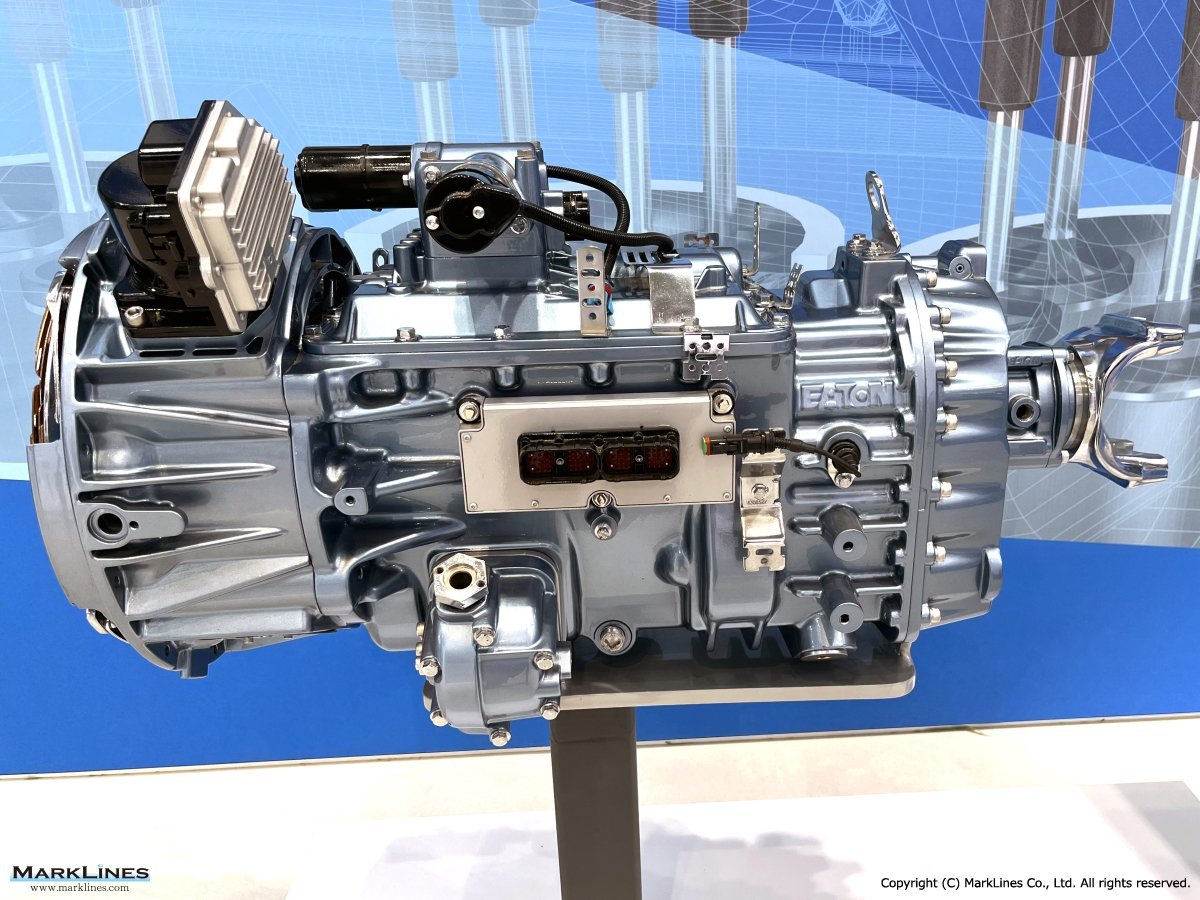
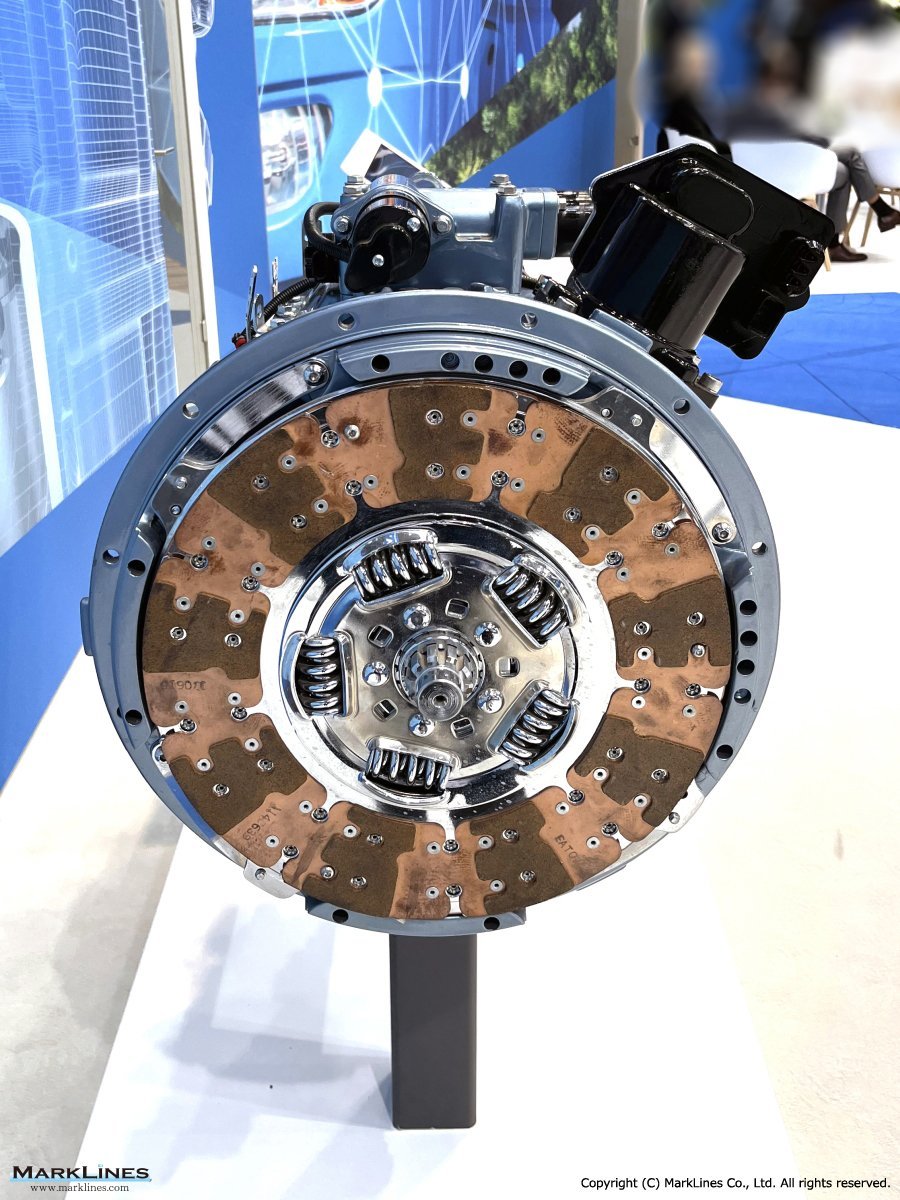
Automated transmission Ultrashift PLUS MHD-10
 1
1
High Compact Torque Vectoring EDU
 1
1
High compact torque vectoring EDU
 1
1
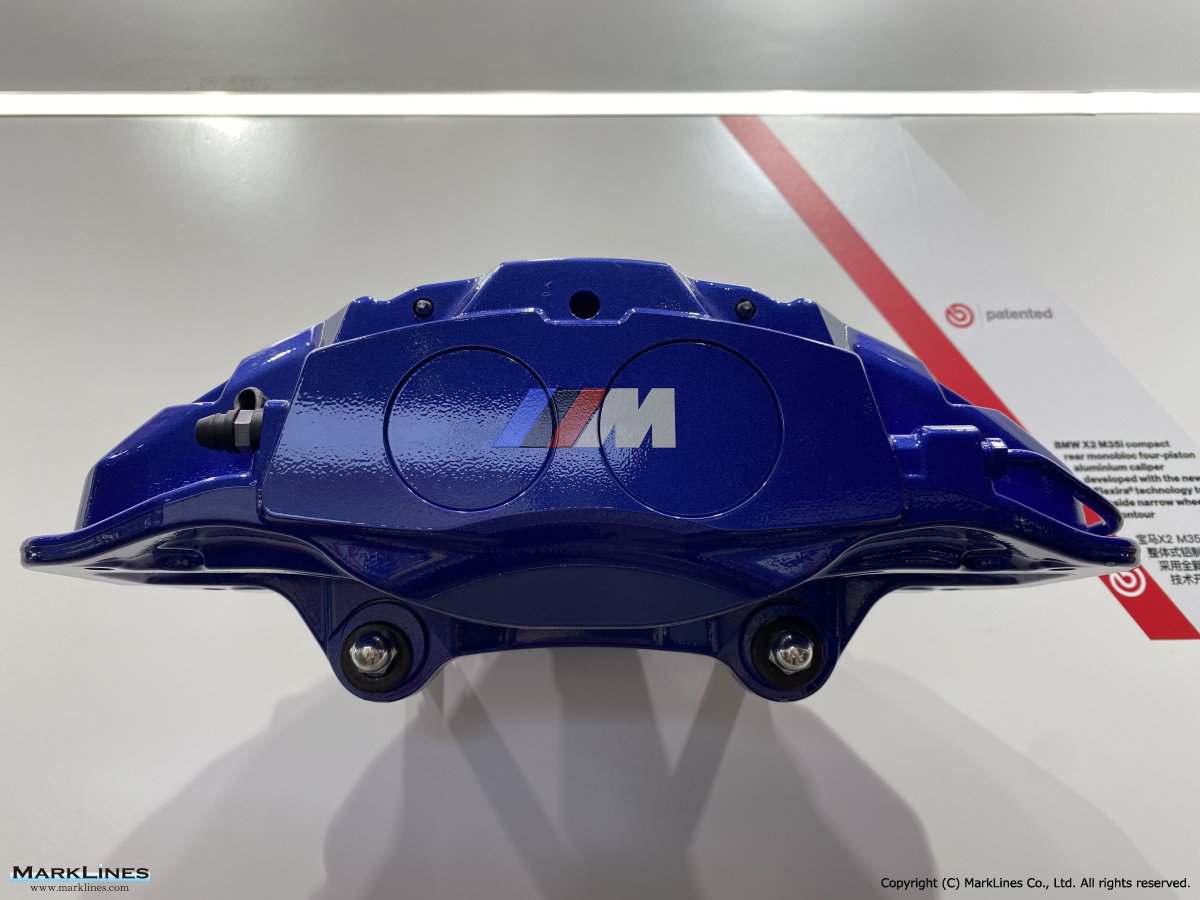
BMW X2 M35i compact rear monobloc four-piston aluminium caliper
 1
1
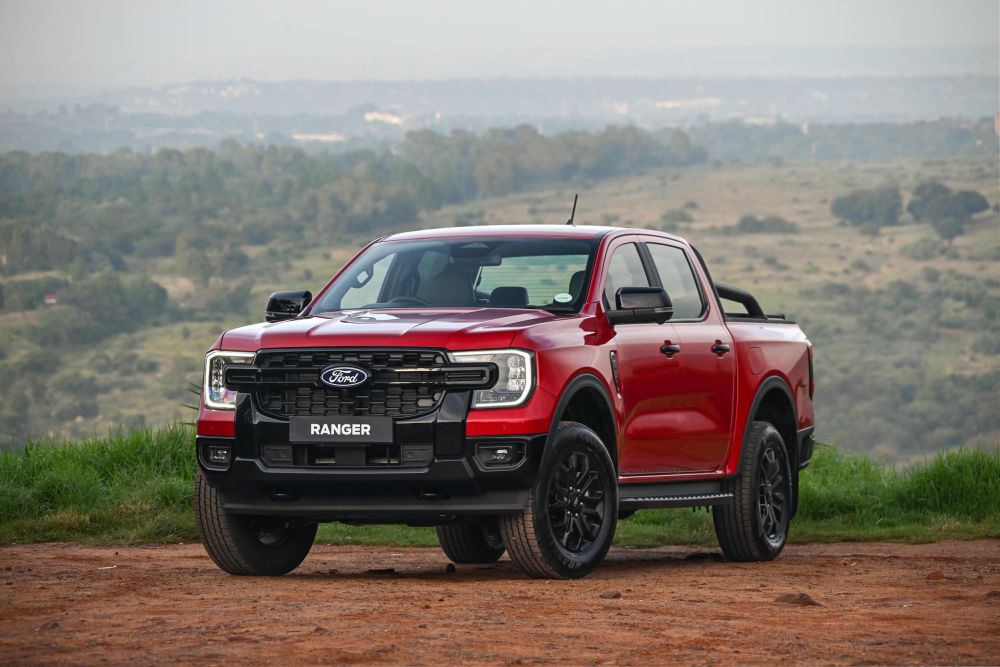
Ford South Africa upgrades Ranger lineup with new engine options
 1
1
JSW MG Motor India unveils MG Majestor, D+ segment SUV
 1
1
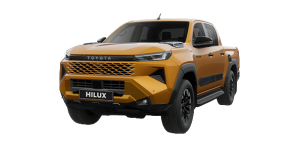
Toyota Vietnam launches 2026 Hilux pickup imported from Thailand
Sort by :
1 - 4 of 4 results
Thailand - Flash report, Automotive sales volume, 2023
Thailand - Flash report, Automotive sales volume, 2023 Flash report, Automotive sales volume, 2023 Jan. Feb. Mar. Apr. May Jun. Jul. Aug. Sep. Oct. Nov. Dec. Flash report, December 2023 Jan 29, 2024 *There are cases where recently released data and detailed information in the database do not match up for reasons including different information sources, and discrepancies between preliminary reports and confirmed data.2023 vehicle sales in Thailan...
Automotive Sales Data Updated at: 2025/06/04
Indonesia - Flash report, Sales volume, 2013
7 173,368 -1.4% Export (CKD) 7,813 6,864 13.8% 105,380 100,122 5.3% Import (CBU) 6,134 7,105 -13.7% 154,014 125,873 22.4% Source:GAIKINDOSales of new vehicles by category Category 2013Dec. 2012Dec. Y-o-Y 2013Jan.-Dec. 2012Jan.-Dec. Y-o-Y Sedan 1,447 2,844 -49.1% 34,199 34,221 -0.1% 4X2 53,433 59,603 -10.4% 787,712 739,168 6.6% 4X4 462 275 68.0% 6,416 7,396 -13.3% Bus 543 471 15.3% 4,054 4,472 -9.3% Pick up/Truck 26,365 24,62...
Automotive Sales Data Updated at: 2016/05/02
Indonesia - Flash report, Sales volume, 2015
23.2% 5,719 7,444 -23.2% Import (CBU) 5,621 7,929 -29.1% 5,621 7,929 -29.1% Source: GAIKINDO *Y-o-Y is based on MarkLines' own calculation. Sales of new vehicles by category Category 2015Jan. 2014Jan. Y-o-Y 2015Jan.-Jan. 2014Jan.-Jan. Y-o-Y Sedan 1,005 1,743 -42.3% 1,005 1,743 -42.3% 4X2 51,086 59,145 -13.6% 51,086 59,145 -13.6% 4X4 291 499 -41.7% 291 499 -41.7% Bus 68 169 -59.8% 68 169 -59.8% Pick up/Truck 27,011 26,961 0.2% ...
Automotive Sales Data Updated at: 2016/04/25
Indonesia - Flash report, Sales volume, 2014
.2% 108,580 105,380 3.0% Import (CBU) 5,337 6,134 -13.0% 104,751 154,014 -32.0% Source: GAIKINDO*Y-o-Y is based on MarkLines' own calculation.Sales of new vehicles by category Category 2014Dec. 2013Dec. Y-o-Y 2014Jan.-Dec. 2013Jan.-Dec. Y-o-Y Sedan 981 1,447 -32.2% 21,614 34,199 -36.8% 4X2 39,136 53,433 -26.8% 679,856 787,712 -13.7% 4X4 363 462 -21.4% 5,871 6,416 -8.5% Bus 253 543 -53.4% 3,834 4,054 -5.4% Pick up/Truck 25,130 26...
Automotive Sales Data Updated at: 2015/01/20


 Japan
Japan USA
USA Mexico
 Germany
 China (Shanghai)
 Thailand
 India
India