


Search Results by Category
All information related to {{ key_word }}.
AI Navigator will guide you. Click here for information about {{ key_word }}.
Images
 2
2
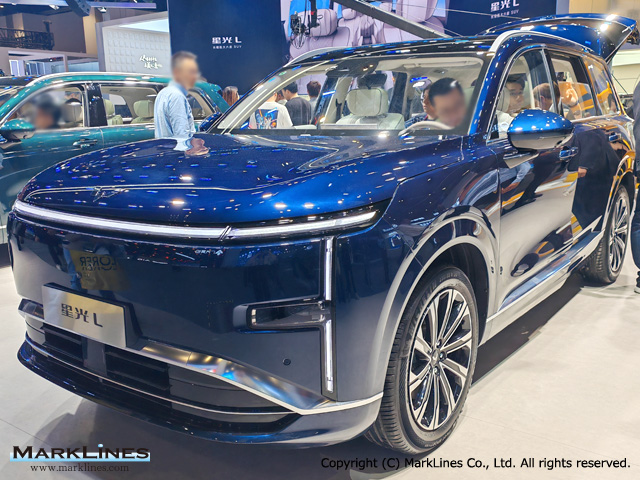
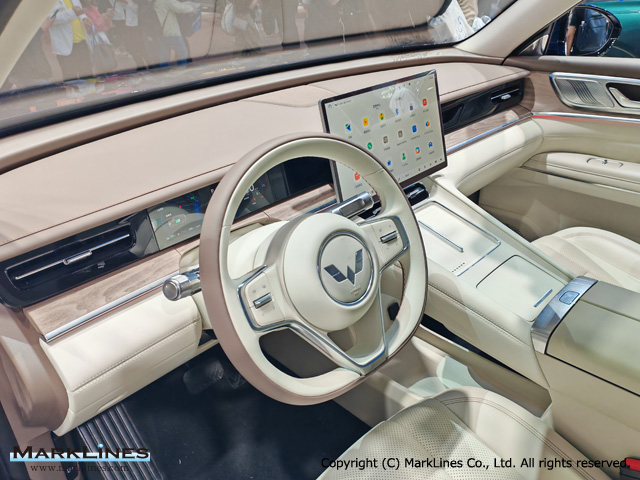
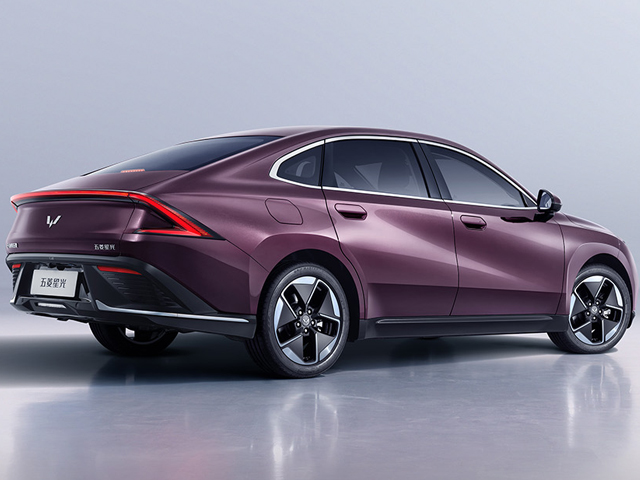
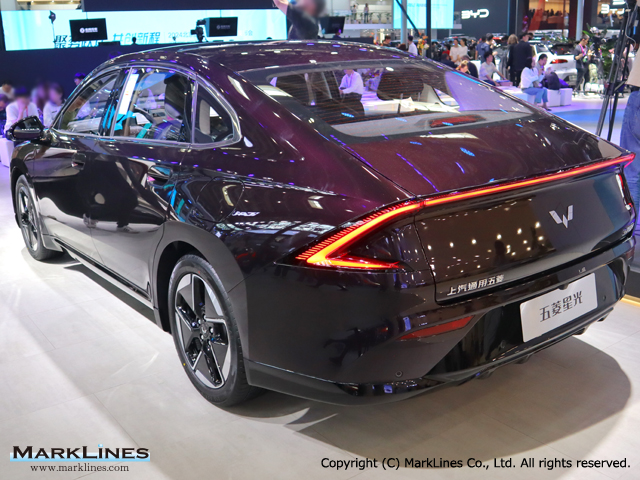
Wuling Xingguang L
 3
3
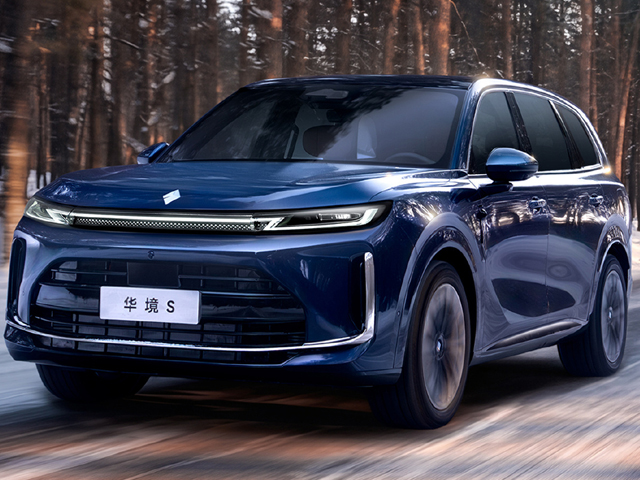
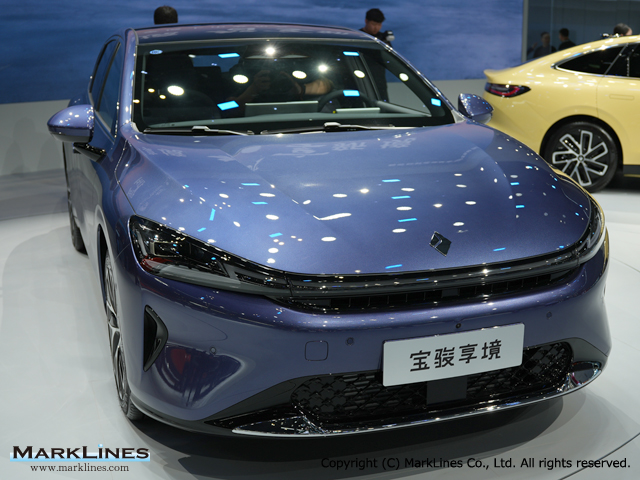
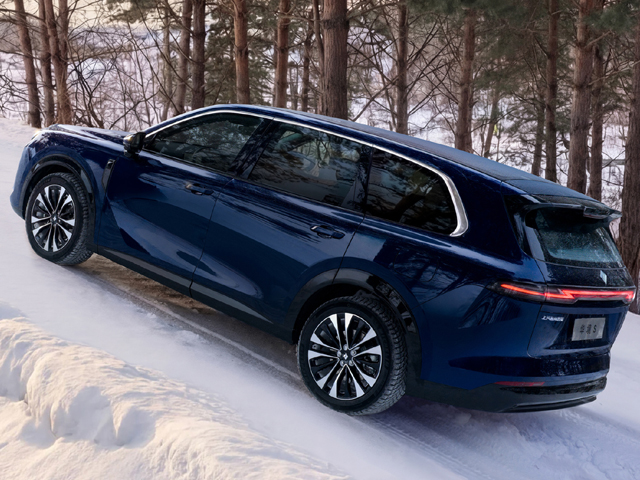
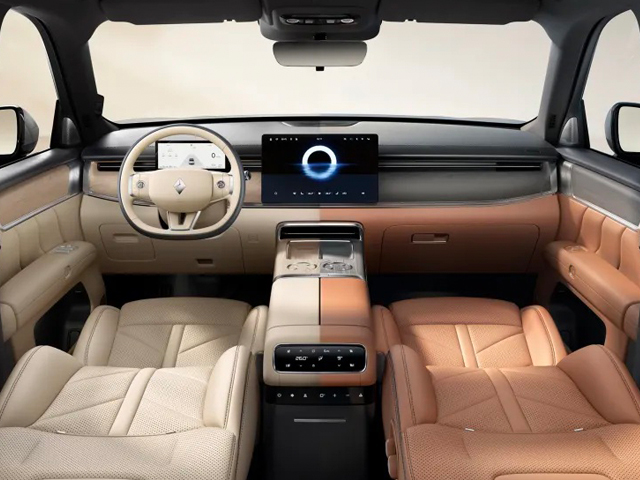
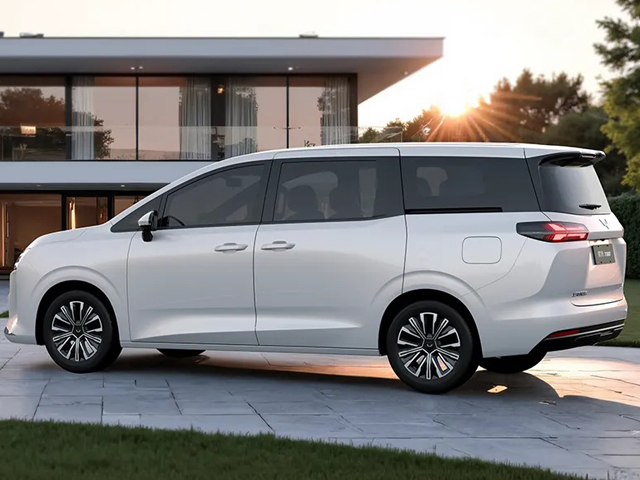
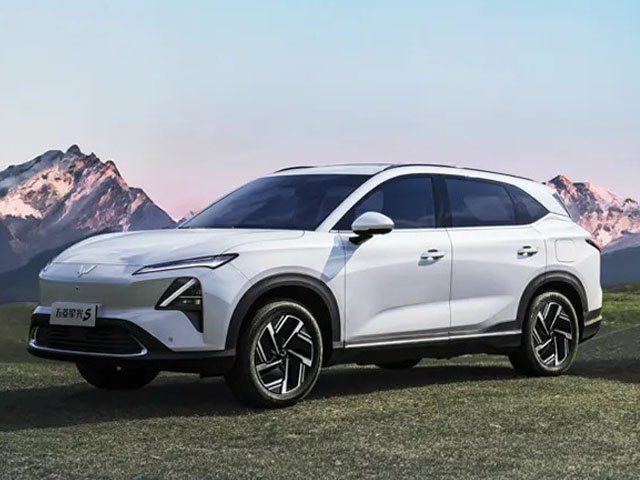
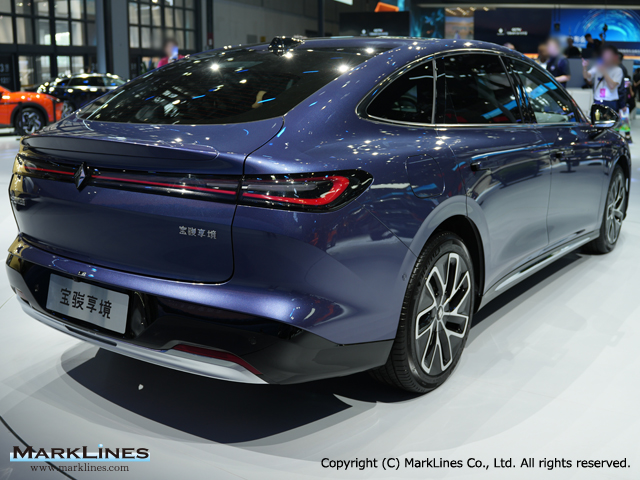
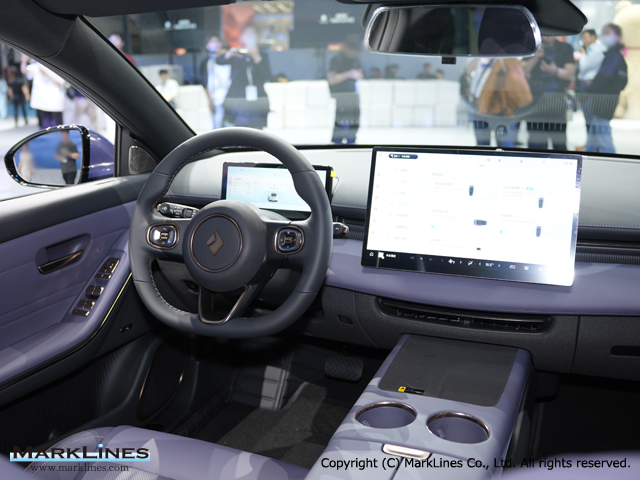
Baojun Huajing S PHEV
 7
7
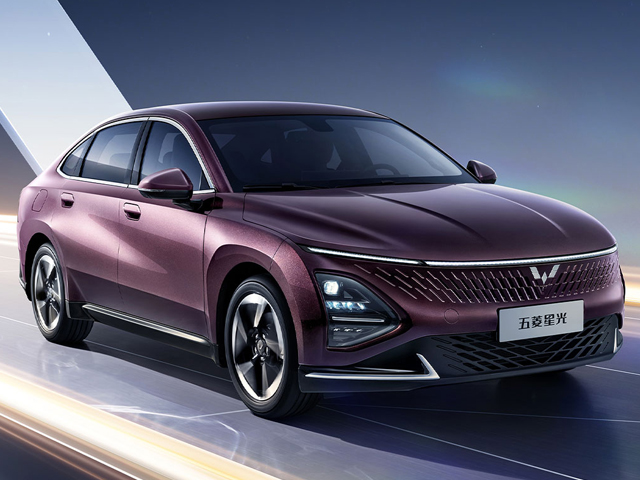
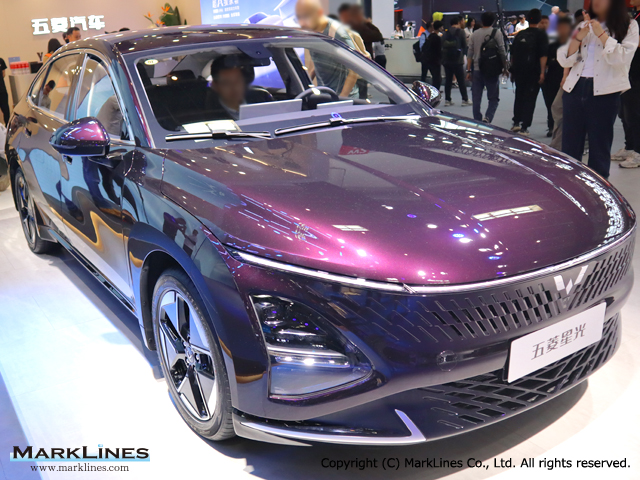
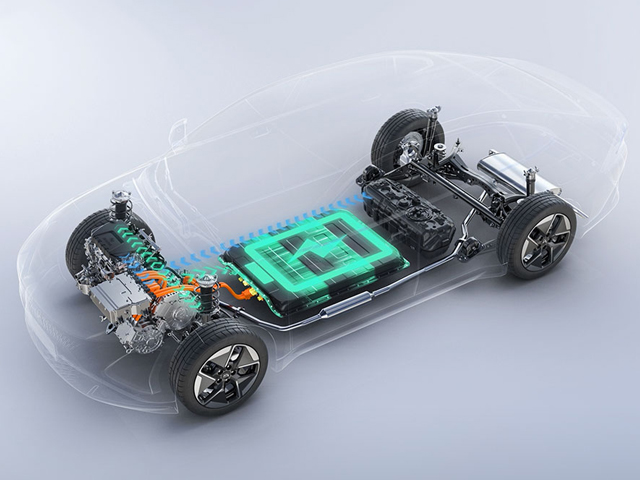
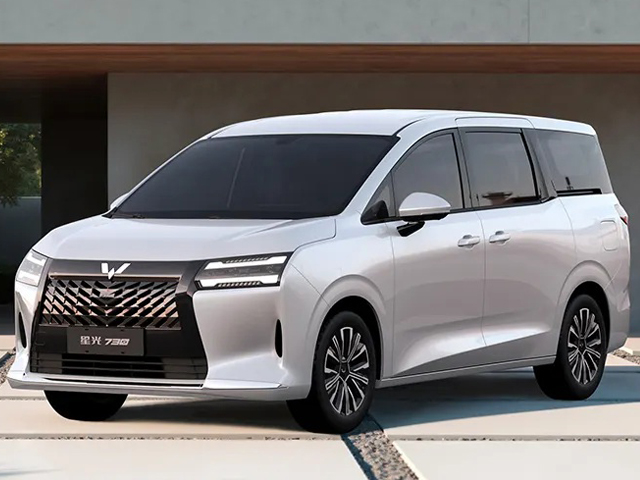
Wuling Xingguang, Xingguang S/560, Xingguang 730 PHEV
 5
5
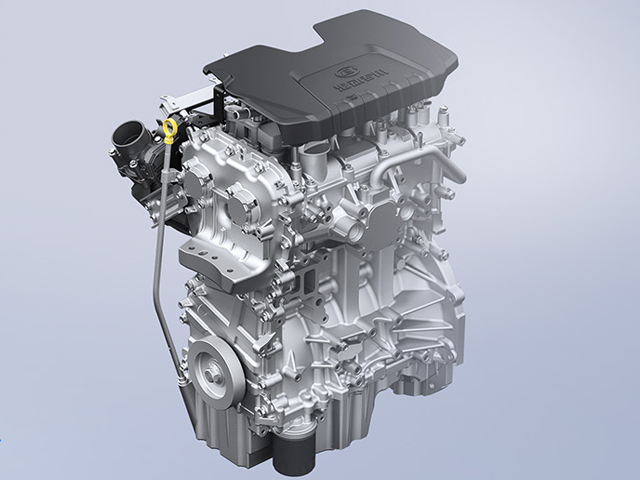
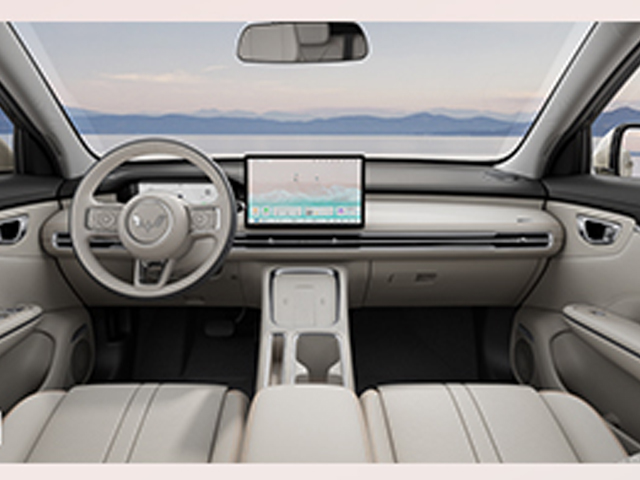
Wuling Xingguang, Xingguang S/560, Xingguang 730 EV
 2
2
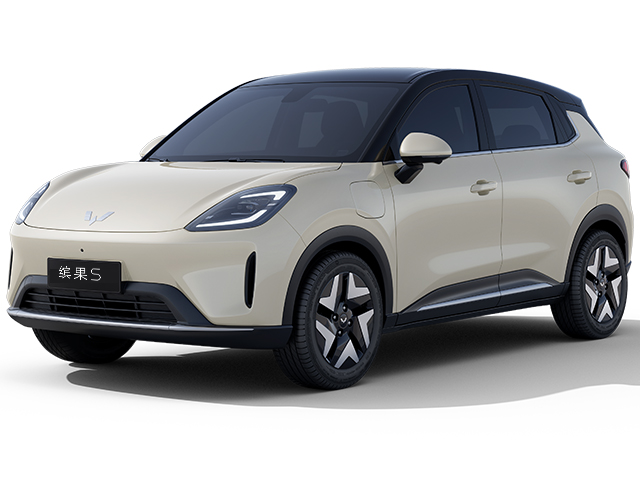
Wuling Bingo S
 1
1
Wuling Hongguang REEV
 5
5
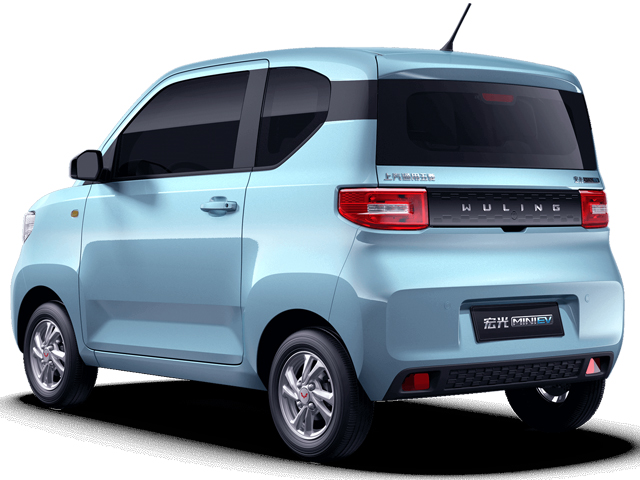
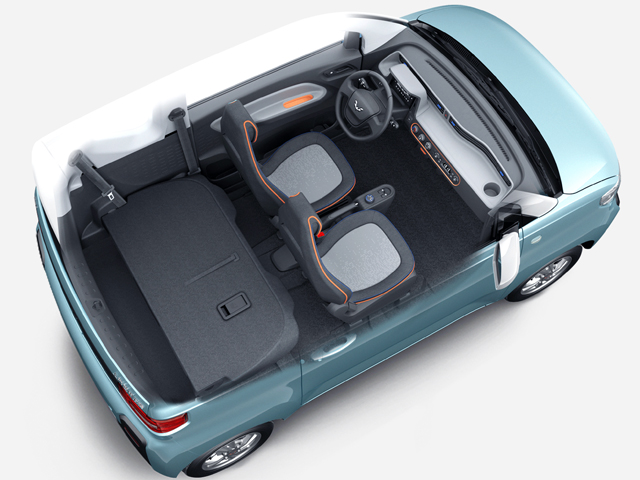
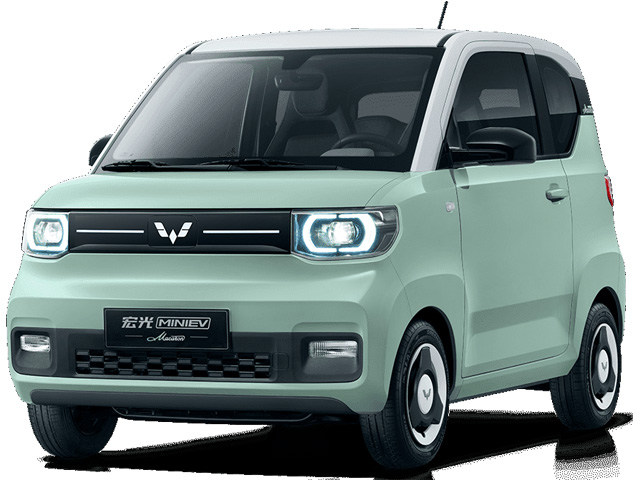
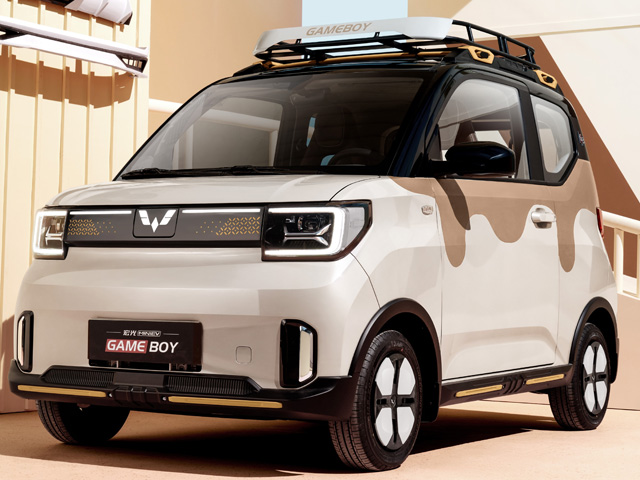
Wuling Hongguang MINI EV/Macaron/Gameboy/Convertible/4-door
 4
4
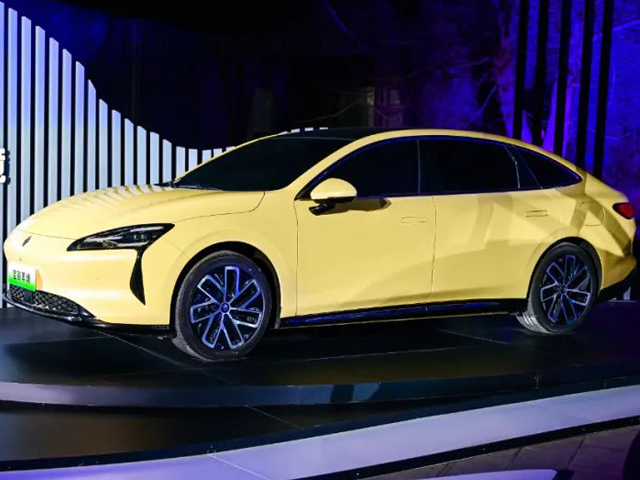
Baojun Xiangjing EV
 2
2
Baojun Xiangjing PHEV
 2
2
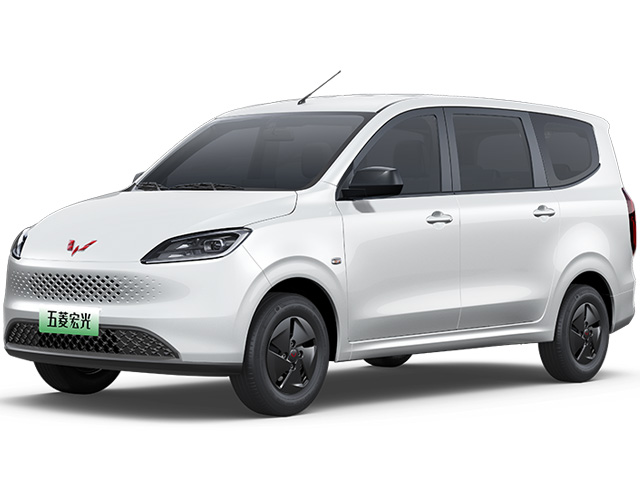
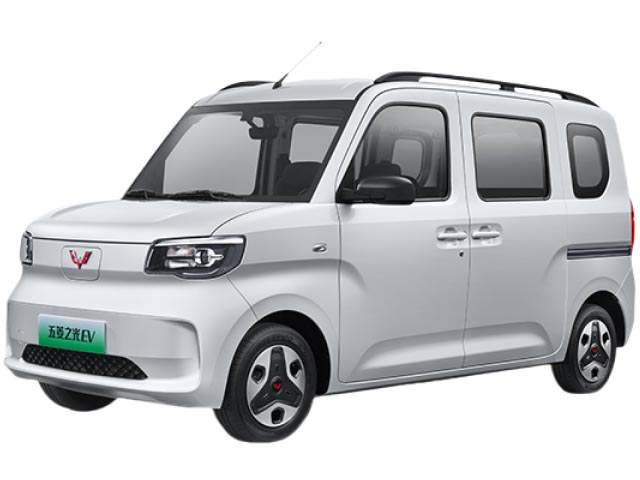
Wuling Sunshine EV
Sort by :
1 - 20 of 35 results
Data changes for Sales Statistics
changes: List of all changes made in reverse chronological order Area/Country: Changes made for specific countries and regions Maker/Brand Dates of changes Remarks February 27, 2026 The group of some makers and brands has been changed. As a result, by-group figures will also change.- Baojun, Wuling, SAIC-GM-Wuling AutomotivePrevious Group: GM GroupNew Group: SAIC (Shanghai Automotive Industry Corporation (Group)) October 29, 2025 The "Hy...
Automotive Sales Data Updated at: 2026/05/19
China - New car sales in 2026 by OEM, model, vehicle type
rence in calculation methods. Passenger Car retail sales by Chinese Makers Top10 - Maker Apr. 2026 (10,000) Y-o-Y 1 BYD Auto 18.2 -32.3% 2 Geely Automobile 15.2 -27.4% 3 Changan Automobile 9.5 -11.0% 4 FAW-VW 7.5 -32.1% 5 Chery Automobile 6.8 -30.5% 6 Leapmotor 5.7 63.5% 7 SAIC-GM-Wuling 5.4 -30.3% 8 GAC Toyota 5.4 -9.9% 9 SAIC VW 4.6 -44.8% 10 Great Wall 4.4 -19.6% Source: CPCAThree Japanese OEMs release April 2026 new...
Automotive Sales Data Updated at: 2026/05/15
Indonesia - New car sales in 2026 by OEM
s up 72.7% to 7,160 units with a 8.9% market share. Mitsubishi was up 36.7% to 5,183 units with a 6.4% market share. BYD was up 32.3% to 4,625 units with a 5.7% market share.Jaecoo sold 3,219 units with 4.0% market share, while Geely’s sales increased by 966.3% to 1,738 units (2.2% market share). Wuling was up to 27.7% to 1,584 units with 2.0% market share, while Chery was down 29.8% to 1,137 units with 1.4% market share.2026 January- April sal...
Automotive Sales Data Updated at: 2026/05/13
Mexico - New car sales in 2026 by OEM, vehicle type
interest rates low in anticipation of the Banco de Mexico’s policy rate cut implemented.Momentum among Chinese automakers such as MG and Geely was particularly notable within the top 10 rankings. Amid an upcoming review of customs agreements, recent reports have highlighted discussions by SAIC GM Wuling regarding potential vehicle production in Mexico, along with announcements of new plant openings by major global auto parts suppliers. The entr...
Automotive Sales Data Updated at: 2026/05/12
Representative models for each segment
Representative models for each segment Home Representative models for each segment Representative models for each segment These are typical models included in each segment. (Refer to sales volume in 2025) Segment Representative models North America Europe China Japan Other Sedan/Hatchback A (Basic) Fiat 500, JAC E10X, Auteco D2S Fiat Panda, Hyundai i10, Kia Morning BYD Seagull, Wuling Hongguang MINIEV, Changan Lumin Honda N-BOX, Su...
Automotive Sales Data Updated at: 2026/03/10
Monthly Sales by Major Automakers and Groups, 2025
288.3 3.5% Source: MarkLines Data Center *Includes some estimated figures. *The sales volume (shipment volume) for China are aggregate figures excluding exports and including imports. *Values may differ from those announced by automaker. *Volume data may be revised in the future.*The SAIC-GM-Wuling brand is included in SAIC. Top 10 Annual Sales Volume 2025 Top 10 Annual Sales Volume 2025 (000 units) - 2025 2024 Group Units Sha...
Automotive Sales Data Updated at: 2026/03/10
Indonesia - New car sales in 2025 by OEM
71,781 units (8.9% market share), Suzuki decreased 0.7% to 66,345 units (8.3% market share) and Honda decreased 40.4% to 56,500 units (7.0% market share).BYD's sales increased significantly by 202.7% to 46,711 units (5.8% market share), while Chery was up 111.0% to 19,391 units (2.4% market share). Wuling's sales decreased by 15.1% to 18,605 units (2.3% market share).Mitsubishi and Suzuki experienced significant sales increases in December, maint...
Automotive Sales Data Updated at: 2026/02/12
China - New car sales in 2025 by OEM, model, vehicle type
t selling models - Maker/Brand Model Dec. 2025 Dec. 2024 Y-o-Y Jan.- Dec. 2025 Jan.- Dec. 2024 Y-o-Y 1 Tesla Model Y 66,189 61,984 6.8% 538,994 556,689 -3.2% 2 BYD Auto Seagull 44,627 57,087 -21.8% 529,537 479,294 10.5% 3 Geely Geely Xingyuan 41,619 16,491 152.4% 478,960 52,659 809.6% 4 Wuling Wuling Hongguang MINIEV 18,526 44,903 -58.7% 440,687 225,371 95.5% 5 BYD Auto Song PLUS 21,223 60,142 -64.7% 400,920 510,463 -21.5% 6 BYD A...
Automotive Sales Data Updated at: 2026/02/10
Indonesia - New car sales in 2024 by OEM
14.2% to 288,982 units (33.4% market share), Daihatsu sales decreased 13.3% to 163,032 units (18.8% market share), Honda decreased 31.8% to 94,742 units (10.9% market share), Mitsubishi decreased 6.7% to 72,217 units (8.3% market share) and Suzuki decreased 17.6% to 66,809 units (7.7% market share).Wuling's sales decreased by 6.9% to 21,923 units (2.5% market share), while BYD sold 15,429 units (1.8% market share). Chery's sales increased signifi...
Automotive Sales Data Updated at: 2025/07/02
China - New car sales in 2024 by OEM, model, vehicle type
fference in calculation methods. Passenger Car retail sales by Chinese Makers Top10 - Maker Dec. 2024 (10,000) Y-o-Y 1 BYD Auto 40.3 34.3% 2 Chery Automobile 19.9 77.3% 3 Geely Automobile 18.6 46.9% 4 FAW-VW 16.1 -24.8% 5 Changan Automobile 15.7 25.0% 6 SAIC VW 15.1 2.8% 7 SAIC-GM-Wuling 12.8 22.2% 8 FAW Toyota 9.7 13.2% 9 Great Wall 8.6 22.3% 10 Tesla 8.3 9.4% Source: CPCA Three Japanese OEMs’ Chinese sales figures ...
Automotive Sales Data Updated at: 2025/07/02
Indonesia - Flash report, Automotive sales volume, 2023
67 13.8% 5.9% Suzuki 7,402 8.7% -25.9% 81,057 8.1% -10.3% Mitsubishi 6,330 7.4% -41.5% 77,416 7.7% -21.8% Hyundai 2,908 3.4% 39.1% 35,500 3.5% 11.1% Mitsubishi Fuso 2,800 3.3% -27.0% 31,553 3.1% -16.1% Isuzu 2,400 2.8% -17.4% 31,427 3.1% -14.2% Hino 2,891 3.4% -11.3% 28,449 2.8% -7.8% Wuling 4,218 4.9% -21.2% 23,540 2.3% -21.5% Mercedes Benz 671 0.8% -15.0% 5,498 0.5% -12.4% Mazda 464 0.5% 11.0% 5,320 0.5% 36.8% BMW 402 0.5% 7...
Automotive Sales Data Updated at: 2025/06/04
China - Flash report, Automotive sales volume, 2023
fference in calculation methods. Passenger Car retail sales by Chinese Makers Top10 - Maker Dec. 2023 (10,000) Y-o-Y 1 BYD Auto 30.0 34.2% 2 FAW-VW 21.3 18.3% 3 SAIC VW 14.7 2.2% 4 Geely Automobile 12.9 2.1% 5 Changan Automobile 12.4 -26.8% 6 Chery Automobile 11.2 36.6% 7 SAIC-GM-Wuling 10.5 16.0% 8 Dongfeng Nissan 9.5 42.8% 9 FAW Toyota 8.5 -16.6% 10 GAC Toyota 7.6 -24.0% Source: CPCA * EstimatesThree Japanese OEMs...
Automotive Sales Data Updated at: 2025/06/04
Indonesia - Flash report, Automotive sales volume, 2022
131,280 12.5% 44.1% Mitsubishi 10,812 10.3% -24.2% 99,051 9.5% -7.9% Suzuki 9,990 9.5% 2.2% 90,408 8.6% -1.5% Mitsubishi Fuso 3,837 3.6% -2.9% 37,586 3.6% 2.9% Isuzu 2,905 2.8% 11.3% 36,646 3.5% 37.6% Hyundai 2,090 2.0% 697.7% 31,966 3.1% 910.3% Hino 3,261 3.1% 28.3% 30,853 2.9% 49.2% Wuling 5,352 5.1% 79.8% 29,989 2.9% 17.3% Mercedes Benz 789 0.7% 72.6% 6,277 0.6% 60.7% Mazda 418 0.4% 125.9% 3,888 0.4% 14.6% BMW 235 0.2% 15.8...
Automotive Sales Data Updated at: 2025/06/04
China - Flash report, Automotive sales volume, 2022
546.7 77.5 83.4 PHV 19.4 24.4 132.4 158.8 22.5 164.1 FCV 0.1 0.13 4.1 0.4 0.06 105.4 Total 79.5 100.0 51.8 705.8 100.0 96.9 Source:CAAM, Each maker's press releasesChina - Top 10 best selling models - Maker/Brand Model Dec. 2022 Dec. 2021 Y-o-Y Jan.- Dec. 2022 Jan.- Dec. 2021 Y-o-Y 1 Wuling Wuling Hongguang MINIEV 82,340 55,742 47.7% 572,757 426,482 34.3% 2 Tesla Model Y 35,750 40,558 -11.9% 455,091 200,131 127.4% 3 BYD Auto So...
Automotive Sales Data Updated at: 2025/06/04
China - Flash report, Automotive sales volume, 2021
0.8 82.1 7.1 Commercial Vehicles Total 38.0 13.1 -25.3 467.4 17.9 -10.7 Grand Total 290.7 100.0 2.4 2,608.2 100.0 3.4 Source:CAAM, Each maker's press releasesChina - Top 10 best selling models - Maker/Brand Model Dec. 2021 Dec. 2020 Y-o-Y Jan.- Dec. 2021 Jan.- Dec. 2020 Y-o-Y 1 Wuling Wuling Hongguang MINIEV 55,742 32,097 73.7% 426,482 126,603 236.9% 2 VW Lavida 35,905 36,369 -1.3% 391,362 417,324 -6.2% 3 Haval Haval H6 4...
Automotive Sales Data Updated at: 2025/06/04
Indonesia - Flash report, Sales volume, 2020
.8% -46.6% Suzuki 7,868 13.8% -22.2% 66,130 12.4% -34.1% Mitsubishi 6,964 12.2% -29.1% 57,906 10.9% -51.3% Mitsubishi Fuso 2,260 4.0% -35.6% 21,359 4.0% -50.0% Isuzu 1,786 3.1% -30.5% 16,422 3.1% -35.0% Hino 1,692 3.0% -45.7% 12,621 2.4% -59.4% Nissan 30 0.1% -94.9% 10,849 2.0% -11.8% Wuling 2,135 3.7% -53.7% 6,581 1.2% -70.5% Mazda 323 0.6% -5.6% 2,660 0.5% -45.5% Mercedes Benz 118 0.2% -89.1% 2,357 0.4% -60.7% BMW 206 0.4% 1...
Automotive Sales Data Updated at: 2025/06/04
China - Flash report, Sales volume, 2020
1,295 -1.6% 332,386 334,668 -0.7% 5 VW Sagitar 27,295 31,789 -14.1% 299,839 307,323 -2.4% 6 Buick Excelle GT 42,233 26,083 61.9% 295,857 279,280 5.9% 7 Nissan Bluebird Sylphy/Sylphy 28,561 26,950 6.0% 282,960 346,551 -18.3% 8 Changan/Chana CS75 24,011 28,620 -16.1% 266,824 193,227 38.1% 9 Wuling Wuling Hongguang 39,184 53,336 -26.5% 261,914 374,878 -30.1% 10 Nissan 14th Sylphy/Sylphy 33,778 26,738 26.3% 259,765 124,255 109.1% Sourc...
Automotive Sales Data Updated at: 2025/06/04
China - Flash report, Sales volume, 2019
100.0 -7.5 Source:CAAM, Each maker's press releasesChina - Top 10 best selling models - Maker/Brand Model Dec. 2019 Dec. 2018 Y-o-Y Jan.- Dec. 2019 Jan.- Dec. 2018 Y-o-Y 1 VW Lavida 62,644 40,320 55.4% 517,192 468,792 10.3% 2 Haval Haval H6 41,706 50,303 -17.1% 386,405 452,552 -14.6% 3 Wuling Wuling Hongguang 53,336 59,673 -10.6% 374,878 476,537 -21.3% 4 Toyota Corolla/New Corolla 32,505 27,755 17.1% 357,798 376,077 -4.9% 5 Nissa...
Automotive Sales Data Updated at: 2020/05/12
Indonesia - Flash report, Sales volume, 2019
2% -12.6% Honda 12,305 14.0% -6.0% 137,339 13.3% -15.3% Mitsubishi 9,816 11.2% 10.4% 119,011 11.6% -16.7% Suzuki 10,116 11.5% 21.6% 100,383 9.7% -14.9% Mitsubishi Fuso 3,511 4.0% -1.7% 42,754 4.2% -16.9% Hino 3,115 3.6% -19.7% 31,068 3.0% -21.8% Isuzu 2,568 2.9% 3.1% 25,270 2.5% -3.2% Wuling 4,612 5.3% 98.4% 22,343 2.2% 31.4% Nissan 589 0.7% 16.2% 12,302 1.2% 78.7% Datsun 128 0.1% -44.6% 6,487 0.6% -37.8% Mazda 342 0.4% -17.2%...
Automotive Sales Data Updated at: 2020/02/14
China - Flash report, Sales volume, 2018
nd Total 248.22 100.00 -18.39 2,780.92 100.00 -4.16 Source:CAAM, Each maker's press releases China - Top 10 best selling models - Maker/Brand Model Dec. 2018 Dec. 2017 Y-o-Y Jan.- Dec. 2018 Jan.- Dec. 2017 Y-o-Y 1 Nissan Bluebird Sylphy/Sylphy 56,339 44,141 27.6% 481,216 405,854 18.6% 2 Wuling Wuling Hongguang 59,673 63,590 -6.2% 476,537 533,950 -10.8% 3 VW Lavida 40,320 44,703 -9.8% 468,792 457,114 2.6% 4 Haval Haval H6 50,303 55...
Automotive Sales Data Updated at: 2019/01/31


 Japan
Japan USA
USA Mexico
 Germany
 China (Shanghai)
 Thailand
 India
India