


Search Results by Category
All information related to {{ key_word }}.
AI Navigator will guide you. Click here for information about {{ key_word }}.
Images
 5
5
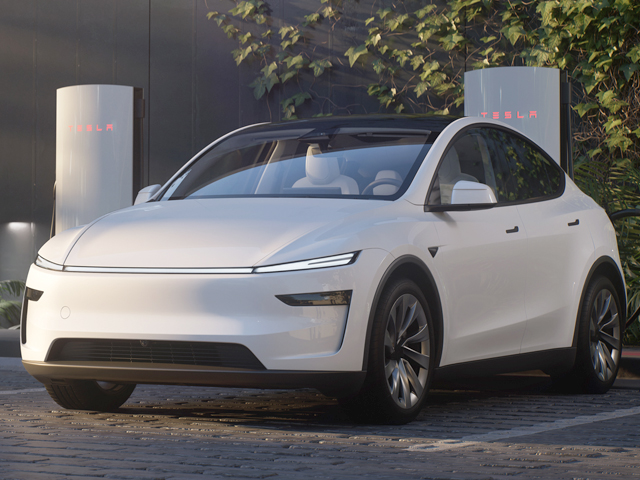
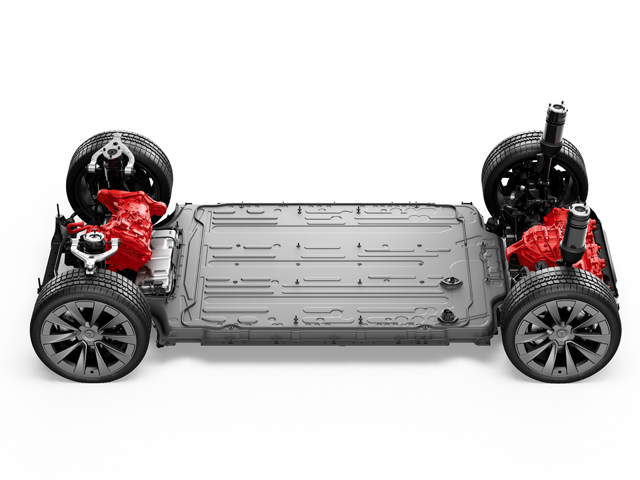
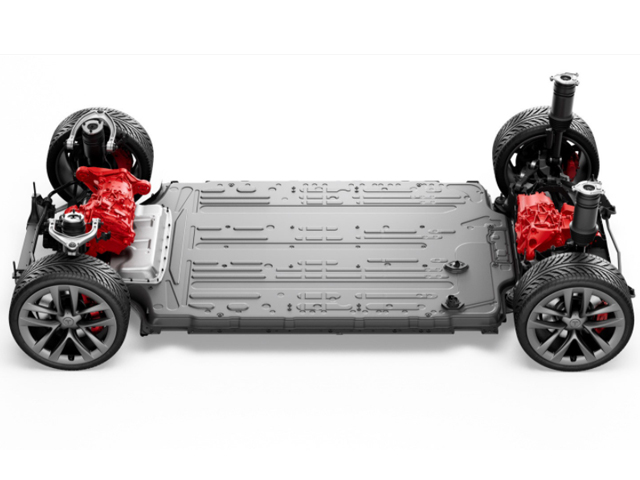
Model Y/Model Y L
 3
3
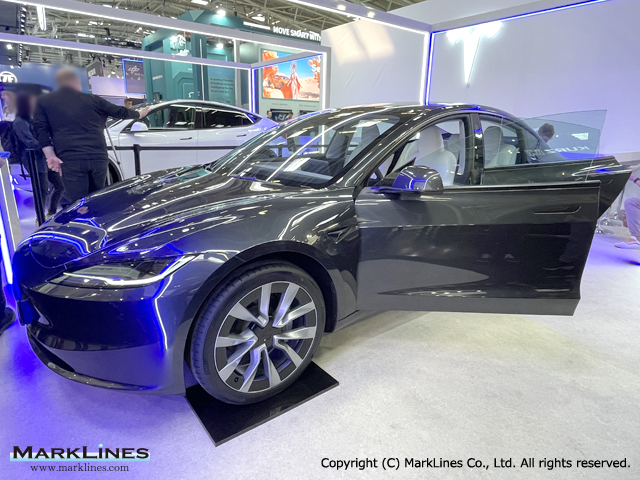
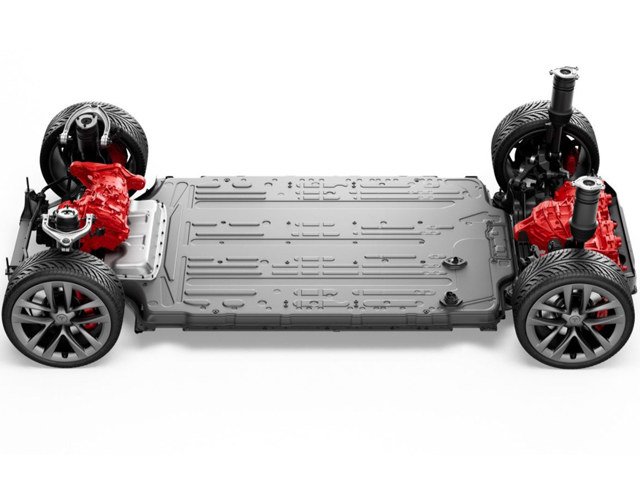
Model 3
 2
2
Brembo Xtra line
 1
1
Dedicated solutions for BMW and Tesla
 3
3
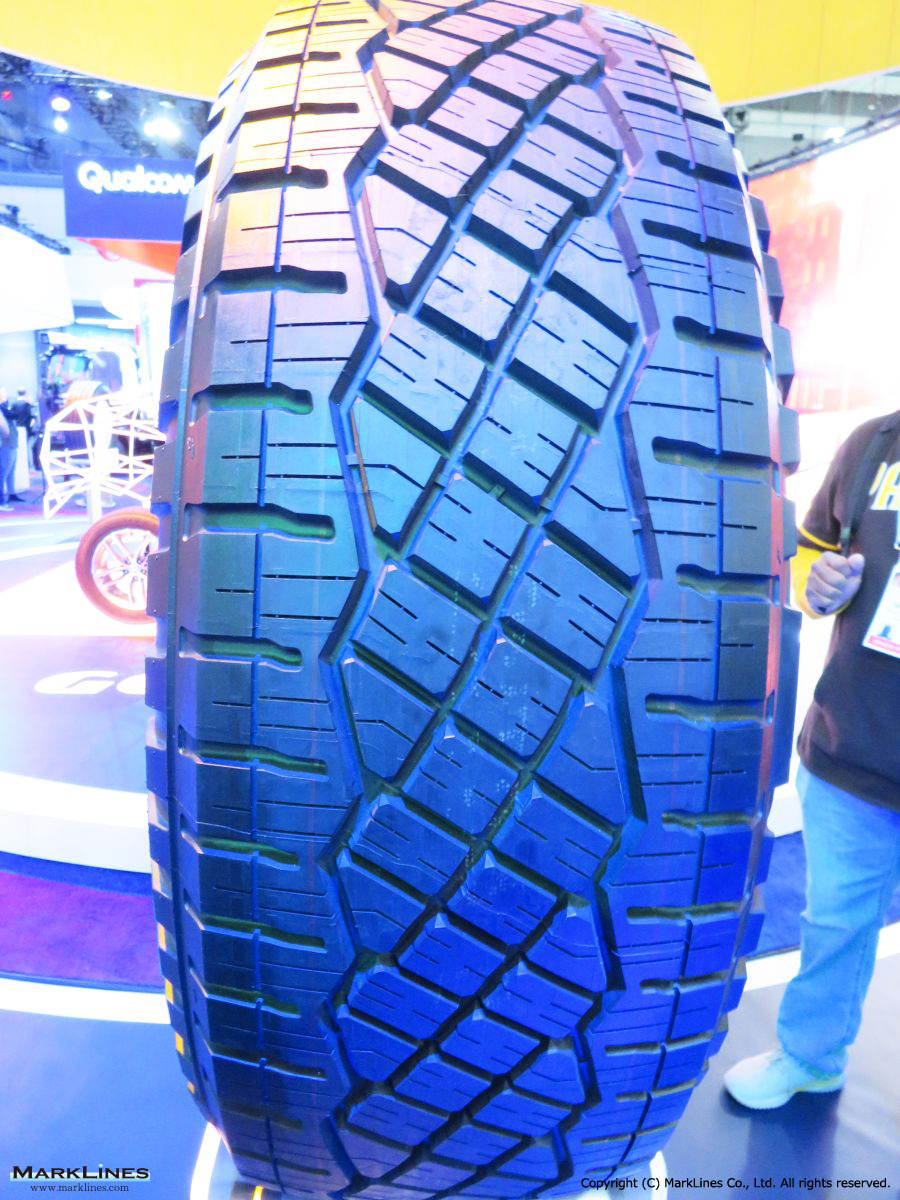
Tesla "Cybertruck" tire
 7
7
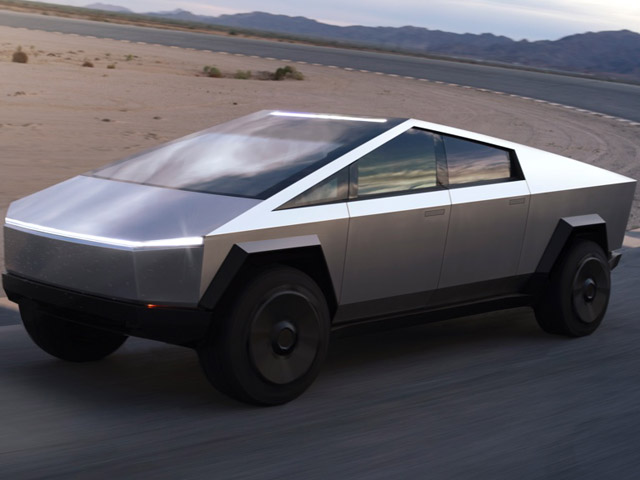
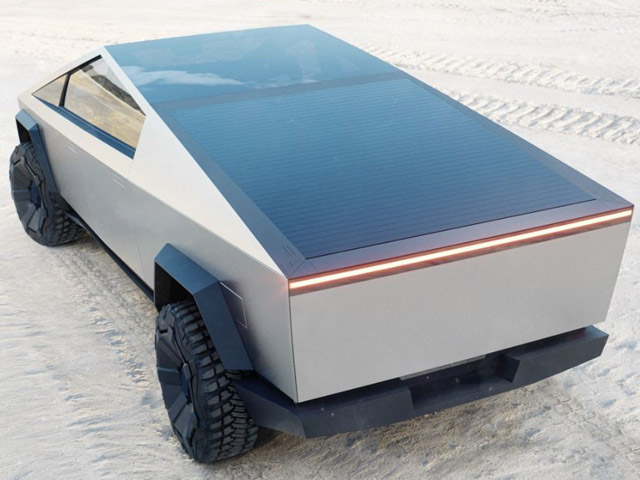
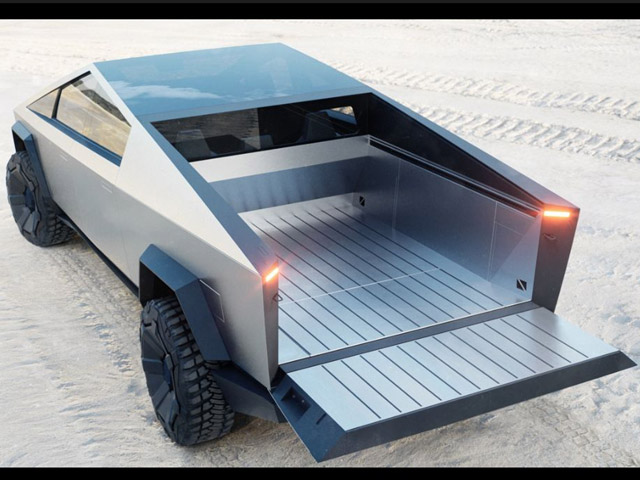
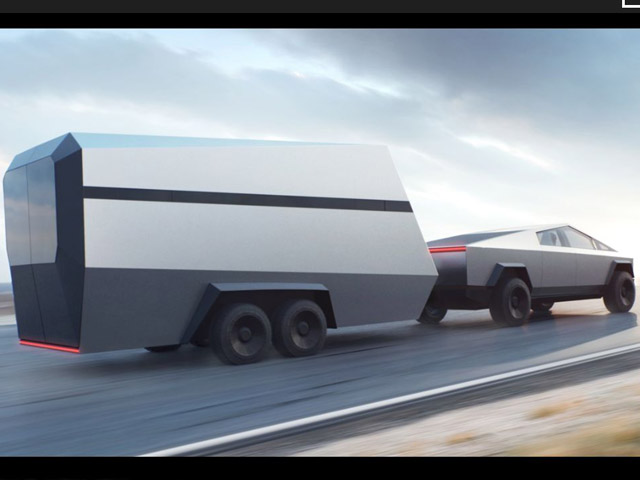
Cybertruck
 2
2
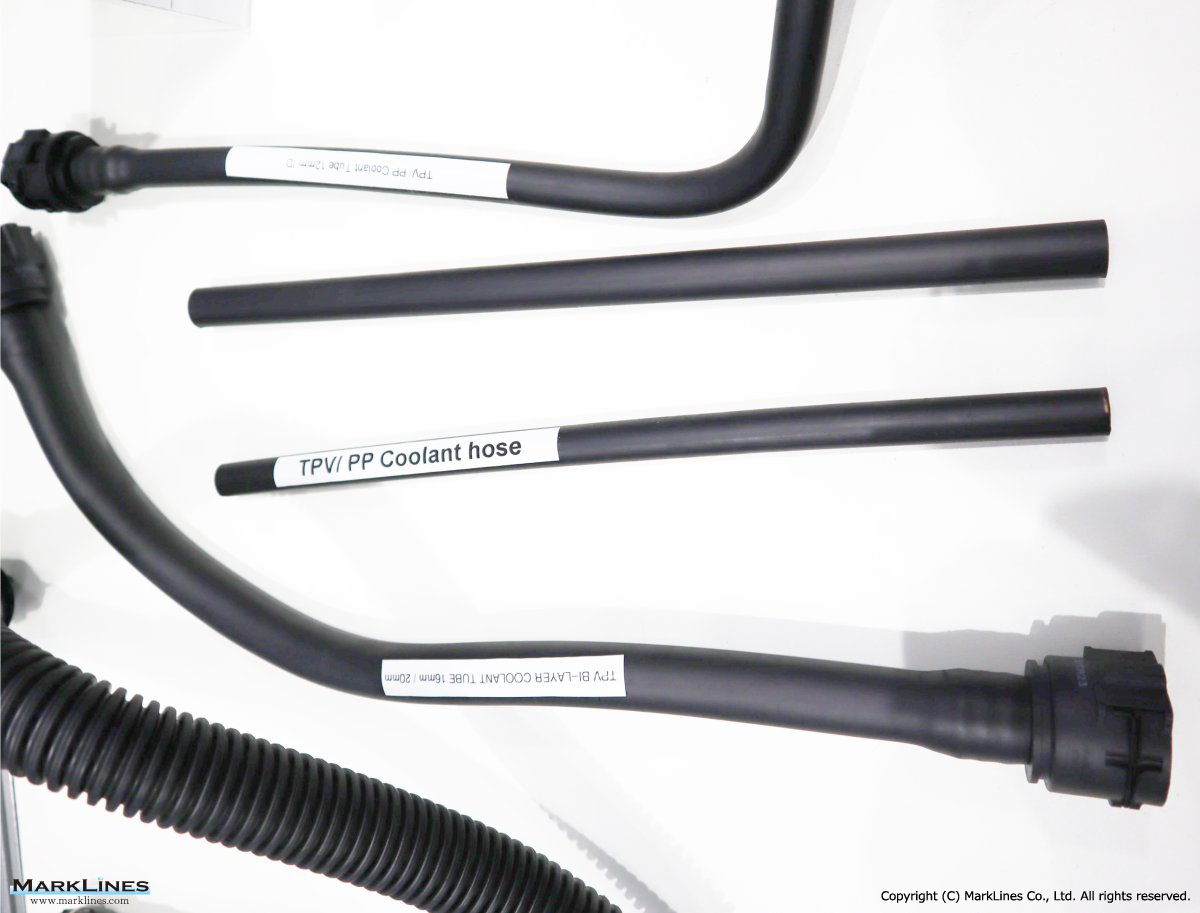
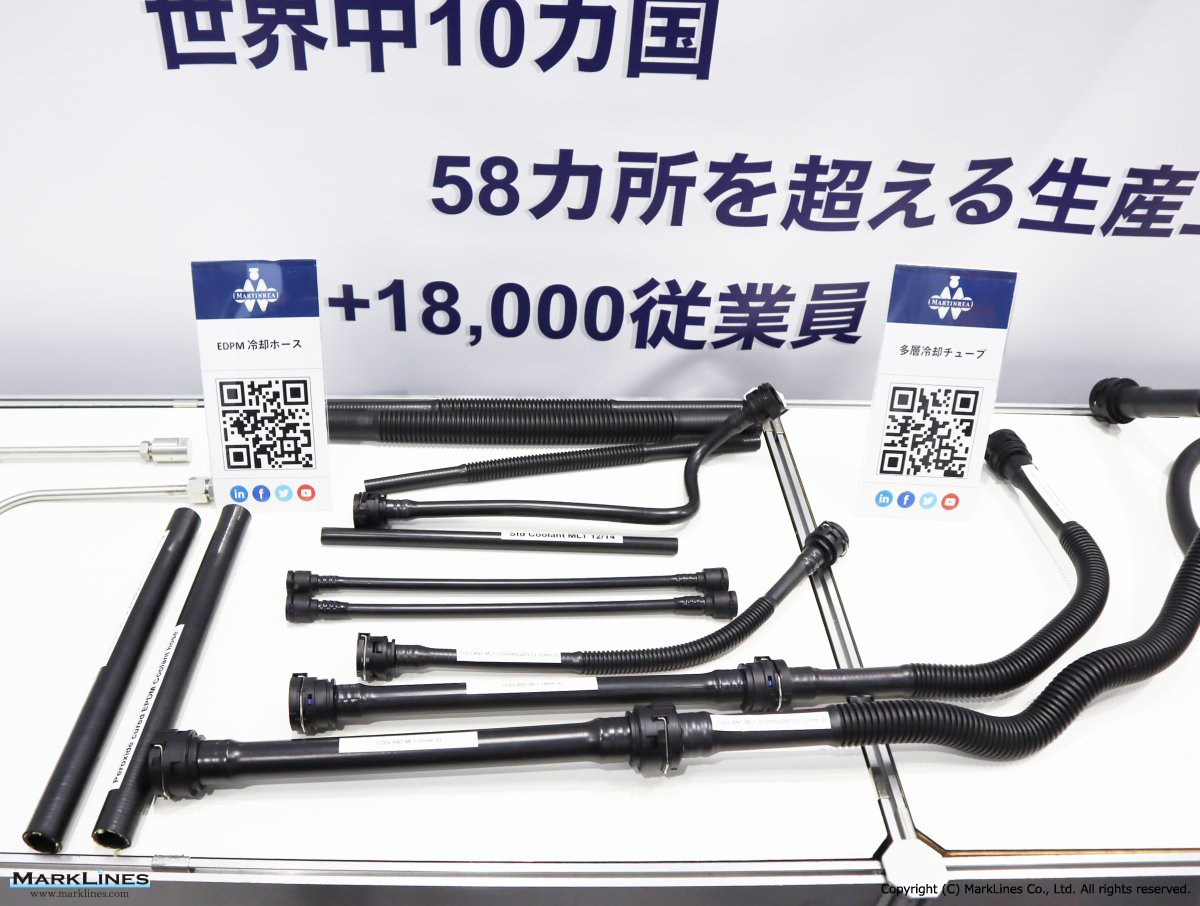
EDPM (Ethylene propylene rubber) cooling hoses, multi-layer cooling tubes
 3
3
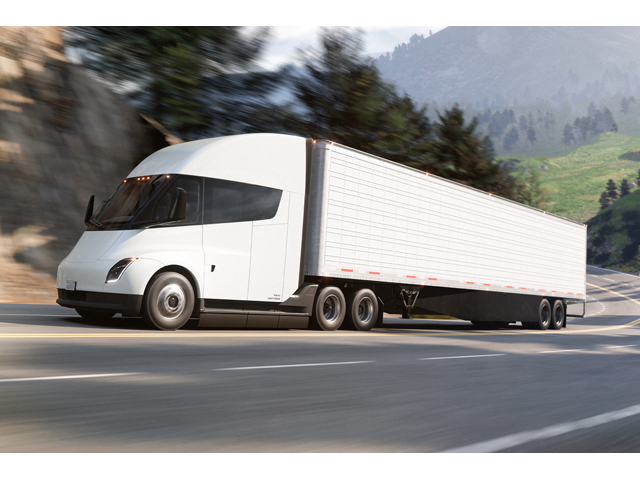
Semi
 7
7
Model X
 7
7
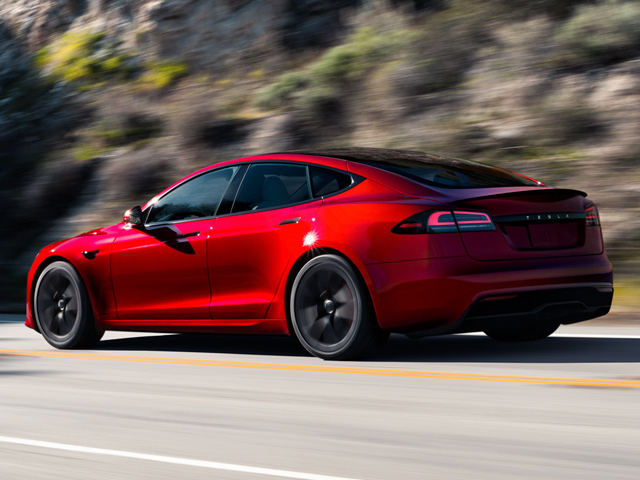
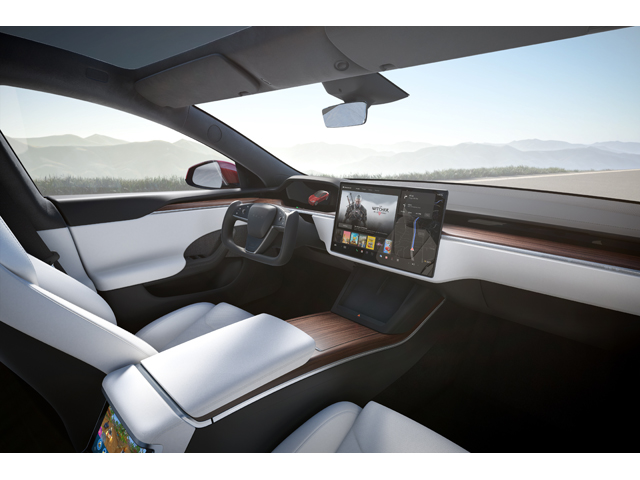
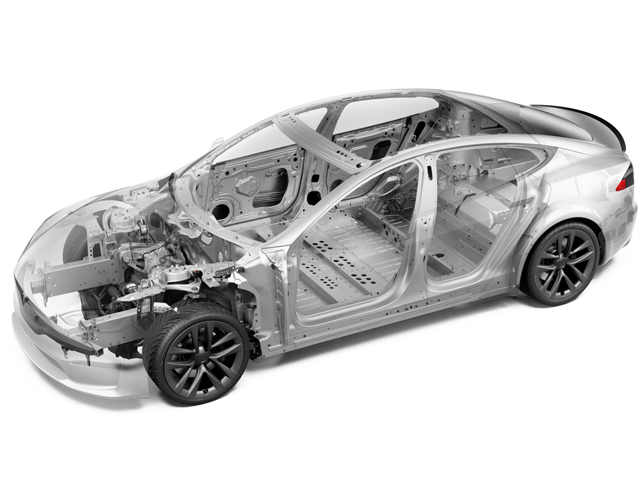
Model S
Sort by :
1 - 20 of 233 results
China - New car sales in 2026 by OEM, model, vehicle type
65.3 -4.4 PHV 41.3 33.5 -5.9 102.9 34.7 -11.1 FCV 0.01 0.01 -62.7 0.03 0.01 -53.9 Total 123.1 100.0 -3.6 296.5 100.0 -6.8 Source:CAAM, Each maker's press releasesChina - Top 10 best selling models - Maker/Brand Model Mar. 2026 Mar. 2025 Y-o-Y Jan.-Mar.2026 Jan.-Mar.2025 Y-o-Y 1 Tesla Model Y 55,856 49,029 13.9% 136,176 89,294 52.5% 2 Geely Geely Xingyuan 40,613 32,490 25.0% 120,148 89,228 34.7% 3 BYD Auto Seagull 30,636 3...
Automotive Sales Data Updated at: 2026/05/15
Singapore - New car sales in 2026 by OEM
ent information sources, and discrepancies between preliminary reports and confirmed data. Singapore - Registrations of new cars Maker/Brand Apr. 2026 Share BYD 1,400 30.7% Toyota 427 9.4% Mercedes-Benz 291 6.4% BMW 287 6.3% GAC 214 4.7% Honda 202 4.4% Chery Automobile 200 4.4% Tesla 168 3.7% M.G. 163 3.6% ZEEKR 156 3.4% Xpeng 152 3.3% Hyundai 98 2.2% Kia 82 1.8% Nissan 81 1.8% Volvo Cars 66 1.4% Audi 60 1.3% ...
Automotive Sales Data Updated at: 2026/05/12
New Zealand - New car sales in 2026 by OEM, vehicle type
.4% Audi 145 2.0% 471 1.4% BMW 133 1.9% 623 1.9% Subaru 128 1.8% 644 1.9% Lexus 106 1.5% 529 1.6% Dongfeng 102 1.4% 497 1.5% Nissan 93 1.3% 686 2.1% Land Rover 92 1.3% 437 1.3% VW 90 1.3% 460 1.4% Mercedes-Benz 88 1.2% 439 1.3% ZEEKR 84 1.2% 246 0.7% Porsche 79 1.1% 194 0.6% Tesla 77 1.1% 680 2.0% MINI 68 1.0% 349 1.0% Geely 64 0.9% 257 0.8% BAIC Motor 64 0.9% 174 0.5% Denza 55 0.8% 117 0.4% Skoda 54 0.8% 278 0.8...
Automotive Sales Data Updated at: 2026/05/12
Data changes for Sales Statistics
are available. February 27, 2026 Peru Starting from January 2026, passenger vehicle sales figures will be changed from OEM-based data to model-based data. February 13, 2026 China The number of commercial vehicles for January 2026 has been updated by OEM. February 12, 2026 USA Sales figures of Tesla in January 2026 have been updated. February 10, 2026 New Zealand The number of vehicles by vehicle type from October to December 2025 has been...
Automotive Sales Data Updated at: 2026/05/12
Germany - New car sales in 2026 by OEM, model, vehicle type
ng to the German Federal Land Transport Authority (KBA).Battery-electric vehicle (BEV) sales rose by 41.3%, following a significant increase in March. This is likely due to the effects of newly introduced EV purchase subsidies and the Middle East conflict. Benefiting from these incentives, sales of Tesla and Chinese makers, including BYD, continued to surge. BEVs now account for 25.8% of total sales, surpassing the market share of gasoline vehicl...
Automotive Sales Data Updated at: 2026/05/11
USA - New car sales in 2026 by OEM, model, vehicle type
down 6.0% in April, rising gasoline prices above USD 4 boost demand for sedans and electrified vehiclesNote: Some figures were updated on May 8.According to preliminary figures compiled by MarkLines as of May 2, U.S. new‐vehicle sales in April 2026 (including estimated figures for GM, Stellantis, Tesla, etc.) totaled 1,374,365 units, down 6.0% year on year. The number of selling days in April was the same as a year earlier, at 26 days.According...
Automotive Sales Data Updated at: 2026/05/11
France - New car sales in 2026 by OEM, vehicle type
AN Total 2,784 2,467 12.8% 8,309 9,644 -13.8% Share 2.0% 1.8% 0.2 pt 1.5% 1.8% -0.2 pt GROUP FORD Total 2,485 3,211 -22.6% 10,824 12,669 -14.6% Share 1.8% 2.3% -0.5 pt 2.0% 2.3% -0.3 pt - FORD Total 2,485 3,211 -22.6% 10,824 12,669 -14.6% Share 1.8% 2.3% -0.5 pt 2.0% 2.3% -0.3 pt GROUP TESLA Total 1,829 863 111.9% 15,774 7,556 108.8% Share 1.3% 0.6% 0.7 pt 2.9% 1.4% 1.5 pt - TESLA Total 1,829 863 111.9% 15,774 7,556 108.8% Sha...
Automotive Sales Data Updated at: 2026/05/08
Korea - New car sales in 2026 by OEM
rce: Releases by each companies *1: Share is based on MarkLines' own calculation. (calculated from total sales of five Korean makers) *2: Exclude sales volume of Cadillac *3: Includes Nissan RogueRegistrations of new imported passenger cars Maker/Brand 2026 2025 Y-o-Y Apr. Share Apr. Share Tesla 13,190 38.8% 1,447 6.7% 811.5% BMW 6,658 19.6% 6,710 31.2% -0.8% Mercedes-Benz 4,796 14.1% 4,908 22.8% -2.3% BYD 2,023 6.0% 543 2.5% 272.6...
Automotive Sales Data Updated at: 2026/05/07
Spain - New car sales in 2026 by OEM
.1% Share 0.4% 0.2% 0.3 pt 0.3% 0.1% 0.2 pt HONDA Total 422 394 7.1% 1,777 1,510 17.7% Share 0.4% 0.4% 0.0 pt 0.4% 0.4% 0.0 pt DEEPAL Total 360 0 -% 913 0 -% Share 0.3% 0.0% 0.3 pt 0.2% 0.0% 0.2 pt KGM Total 345 386 -10.6% 1,075 1,588 -32.3% Share 0.3% 0.4% -0.1 pt 0.3% 0.4% -0.2 pt TESLA Total 301 571 -47.3% 4,829 3,740 29.1% Share 0.3% 0.6% -0.3 pt 1.2% 1.0% 0.2 pt SUZUKI Total 298 344 -13.4% 1,904 2,202 -13.5% Share 0.3% ...
Automotive Sales Data Updated at: 2026/05/07
Italy - New car sales in 2026 by OEM
t 0.5% 0.6% -0.1 pt LAND ROVER Total 625 635 -1.6% 2,609 2,915 -10.5% Share 0.4% 0.5% -0.1 pt 0.4% 0.5% -0.1 pt PORSCHE Total 524 525 -0.2% 2,027 2,306 -12.1% Share 0.3% 0.4% 0.0 pt 0.3% 0.4% -0.1 pt LEXUS Total 471 536 -12.1% 2,220 2,290 -3.1% Share 0.3% 0.4% -0.1 pt 0.3% 0.4% 0.0 pt TESLA Total 422 446 -5.4% 4,841 3,916 23.6% Share 0.3% 0.3% 0.0 pt 0.8% 0.7% 0.1 pt EMC Total 338 51 562.7% 1,816 300 505.3% Share 0.2% 0.0% 0.2...
Automotive Sales Data Updated at: 2026/05/07
Finland - New car sales in 2026 by OEM
4% Ford 266 4.7% 915 4.0% 925 4.0% -1.1% BMW 258 4.5% 1,155 5.0% 1,107 4.8% 4.3% Hyundai 161 2.8% 560 2.4% 828 3.6% -32.4% BYD Auto 125 2.2% 398 1.7% 151 0.7% 163.6% smart 113 2.0% 287 1.3% 71 0.3% 304.2% Opel 98 1.7% 273 1.2% 152 0.7% 79.6% Polestar 94 1.6% 352 1.5% 521 2.3% -32.4% Tesla 91 1.6% 1,243 5.4% 546 2.4% 127.7% Peugeot 82 1.4% 269 1.2% 379 1.7% -29.0% Nissan 80 1.4% 691 3.0% 1,052 4.6% -34.3% Citroen 76 1.3% 202 ...
Automotive Sales Data Updated at: 2026/05/07
UK - New car sales in 2026 by OEM, vehicle type
43 0.9% 11.1% 5,223 0.7% 5,447 0.8% -4.1% Honda 1,155 0.8% 1,206 1.0% -4.2% 8,506 1.1% 10,108 1.4% -15.8% Mazda 1,126 0.8% 1,541 1.3% -26.9% 11,669 1.5% 12,537 1.8% -6.9% Polestar 1,076 0.7% 859 0.7% 25.3% 5,227 0.7% 4,554 0.6% 14.8% Jeep 838 0.6% 815 0.7% 2.8% 4,609 0.6% 4,900 0.7% -5.9% Tesla 831 0.6% 512 0.4% 62.3% 12,570 1.6% 12,986 1.9% -3.2% SEAT 790 0.5% 1,842 1.5% -57.1% 5,620 0.7% 8,795 1.3% -36.1% Fiat 708 0.5% 289 0.2% 14...
Automotive Sales Data Updated at: 2026/05/07
Denmark - New car sales in 2026 by OEM, vehicle type
CITROEN 450 2.7% 189 1.3% 138.1% 1,688 2.8% 295 0.6% 472.2% HYUNDAI 445 2.7% 577 3.8% -22.9% 1,283 2.1% 2,439 4.6% -47.4% VOLVO 411 2.5% 346 2.3% 18.8% 1,409 2.3% 1,183 2.3% 19.1% MG 405 2.4% 265 1.8% 52.8% 1,276 2.1% 752 1.4% 69.7% FORD 367 2.2% 417 2.8% -12.0% 1,339 2.2% 1,316 2.5% 1.7% TESLA 363 2.2% 180 1.2% 101.7% 2,687 4.4% 1,728 3.3% 55.5% NISSAN 363 2.2% 380 2.5% -4.5% 1,469 2.4% 1,837 3.5% -20.0% BYD 282 1.7% 227 1.5% 24.2%...
Automotive Sales Data Updated at: 2026/05/07
Israel - New car sales in 2026 by OEM
70 0.1% 148 0.1% 14.9% Ford 54 0.3% 12 0.1% 350.0% 234 0.2% 215 0.2% 8.8% Land Rover 52 0.3% 81 0.4% -35.8% 307 0.3% 284 0.2% 8.1% Foton 44 0.2% 14 0.1% 214.3% 299 0.3% 75 0.1% 298.7% Voyah 31 0.2% 16 0.1% 93.8% 139 0.1% 89 0.1% 56.2% Hongqi 30 0.2% 62 0.3% -51.6% 260 0.2% 252 0.2% 3.2% Tesla 29 0.2% 52 0.3% -44.2% 1,831 1.6% 511 0.4% 258.3% Jeep * 26 0.1% 68 0.4% -61.8% 189 0.2% 392 0.3% -51.8% IM Motors 24 0.1% 0 0.0% -% 140 0.1...
Automotive Sales Data Updated at: 2026/05/07
Canada - New car sales in 2026 by vehicle type
83 million, only slightly below the 1.85 SAAR the month before in March. The relationship between the two months was also evidenced as ZEV sales cooled a bit in April compared to the surge in March, fueled then by the renewed federal incentives. May sales are expected to show increased EV uptake as Tesla’s Chinese-sourced Model 3 RWD will enter the Canadian marketplace at an expected CAD 39,490.Canada - Sales of new vehicles by type Apr. 20...
Automotive Sales Data Updated at: 2026/05/07
Czech Republic - New car sales in 2026 by OEM, vehicle type
1.2% 1,079 1.3% -9.0% Opel 287 1.3% 216 1.0% 32.9% 1,024 1.2% 900 1.1% 13.8% Citroen 258 1.2% 273 1.3% -5.5% 1,076 1.3% 930 1.1% 15.7% Mazda 246 1.1% 127 0.6% 93.7% 781 0.9% 548 0.7% 42.5% Honda 223 1.0% 173 0.8% 28.9% 714 0.9% 567 0.7% 25.9% Chery 190 0.8% 0 0.0% -% 421 0.5% 0 0.0% -% Tesla 175 0.8% 170 0.8% 2.9% 672 0.8% 703 0.9% -4.4% Lexus 174 0.8% 214 1.0% -18.7% 572 0.7% 659 0.8% -13.2% BYD 134 0.6% 1 0.0% 13300.0% 278 0.3%...
Automotive Sales Data Updated at: 2026/05/07
Belgium - New car sales in 2026 by OEM
129 3.0% 1,024 2.7% 10.3% 4,845 3.2% 3,830 2.4% 26.5% Ford 1,094 2.9% 1,147 3.0% -4.6% 4,468 2.9% 5,060 3.2% -11.7% Citroen 1,082 2.9% 980 2.6% 10.4% 4,444 2.9% 4,396 2.8% 1.1% MINI 926 2.4% 598 1.6% 54.8% 2,920 1.9% 2,544 1.6% 14.8% MG 857 2.3% 349 0.9% 145.6% 2,620 1.7% 1,448 0.9% 80.9% Tesla 834 2.2% 570 1.5% 46.3% 4,535 3.0% 3,589 2.3% 26.4% BYD 576 1.5% 295 0.8% 95.3% 2,171 1.4% 1,105 0.7% 96.5% Fiat 420 1.1% 328 0.9% 28.0% 1,7...
Automotive Sales Data Updated at: 2026/05/07
Norway - New car sales in 2026 by OEM
07 4.6% 399 3.5% 27.1% 1,465 3.8% 1,140 2.7% 28.5% XPeng 469 4.2% 333 3.0% 40.8% 1,357 3.5% 1,005 2.3% 35.0% Mercedes-Benz 454 4.1% 295 2.6% 53.9% 863 2.3% 1,749 4.1% -50.7% Ford 421 3.8% 477 4.2% -11.7% 989 2.6% 1,426 3.3% -30.6% Peugeot 416 3.7% 166 1.5% 150.6% 1,117 2.9% 850 2.0% 31.4% Tesla 379 3.4% 976 8.6% -61.2% 7,822 20.4% 4,793 11.2% 63.2% Audi 341 3.1% 641 5.7% -46.8% 872 2.3% 1,995 4.7% -56.3% Kia 317 2.9% 228 2.0% 39.0% ...
Automotive Sales Data Updated at: 2026/05/07
Switzerland - New car sales in 2026 by OEM
9.5% Suzuki 340 1.8% 356 1.9% -4.5% 1,096 1.5% 1,273 1.8% -13.9% MG 331 1.8% 239 1.3% 38.5% 1,413 2.0% 812 1.1% 74.0% Mazda 309 1.7% 268 1.4% 15.3% 1,295 1.8% 1,175 1.6% 10.2% Opel 274 1.5% 247 1.3% 10.9% 1,229 1.7% 918 1.3% 33.9% MINI 269 1.4% 373 2.0% -27.9% 937 1.3% 1,270 1.8% -26.2% Tesla 261 1.4% 227 1.2% 15.0% 1,245 1.7% 1,465 2.1% -15.0% Citroen 248 1.3% 191 1.0% 29.8% 1,073 1.5% 738 1.0% 45.4% Honda 211 1.1% 210 1.1% 0.5% ...
Automotive Sales Data Updated at: 2026/05/07
Austria - New car sales in 2026 by OEM
SEAT 1,474 5.4% Mercedes 1,382 5.0% BYD 1,243 4.5% CUPRA 1,086 3.9% Hyundai 943 3.4% Dacia 940 3.4% Toyota 923 3.4% Ford 881 3.2% Peugeot 834 3.0% Renault 805 2.9% Opel 756 2.7% Kia 754 2.7% Citroen 741 2.7% MG 614 2.2% Mazda 510 1.9% Volvo 404 1.5% Fiat 346 1.3% Tesla 248 0.9% Jeep 220 0.8% Suzuki 219 0.8% MINI 192 0.7% Jaecoo 183 0.7% Nissan 167 0.6% Leapmotor 166 0.6% Mitsubishi 154 0.6% Pors...
Automotive Sales Data Updated at: 2026/05/07


 Japan
Japan USA
USA Mexico
 Germany
 China (Shanghai)
 Thailand
 India
India