


Search Results by Category
All information related to {{ key_word }}.
AI Navigator will guide you. Click here for information about {{ key_word }}.
Images
 2
2
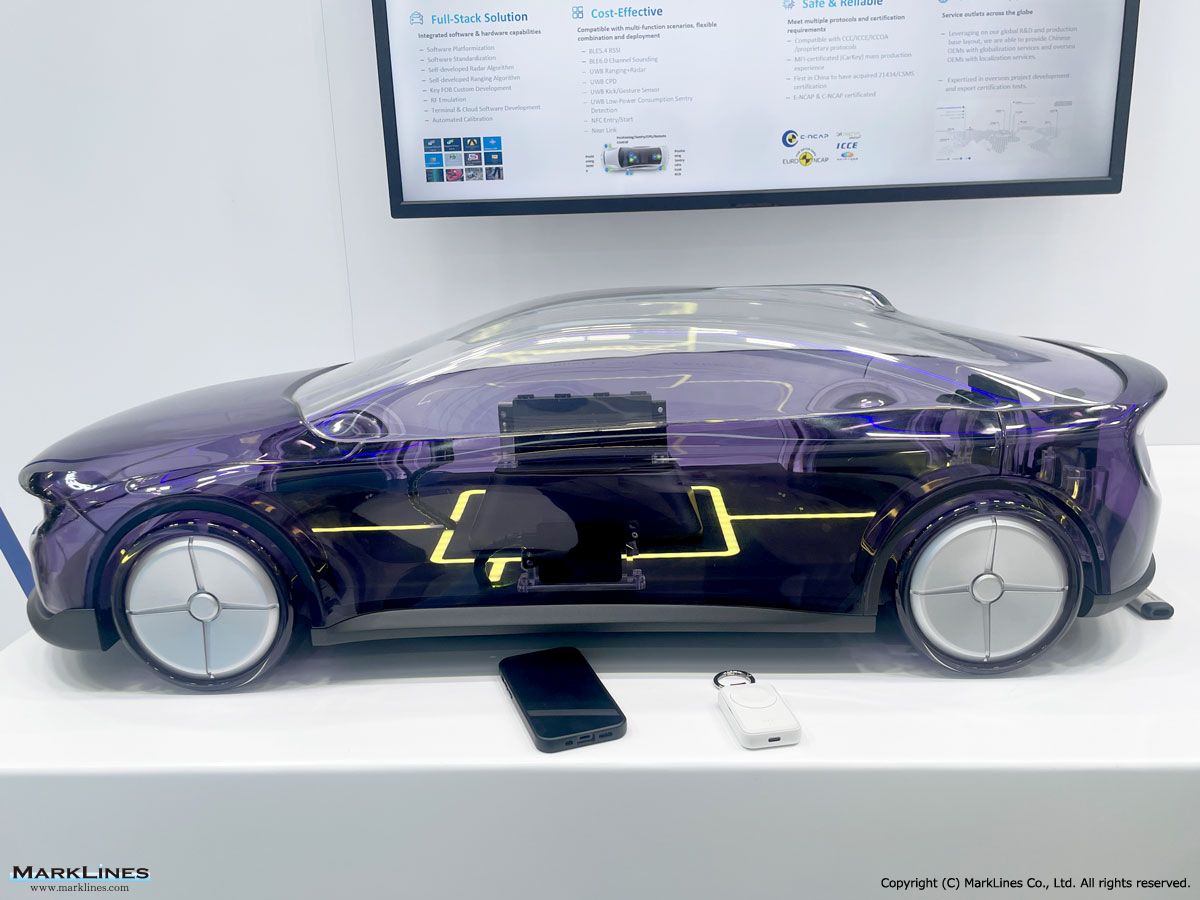
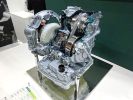
Smart Entry
 2
2
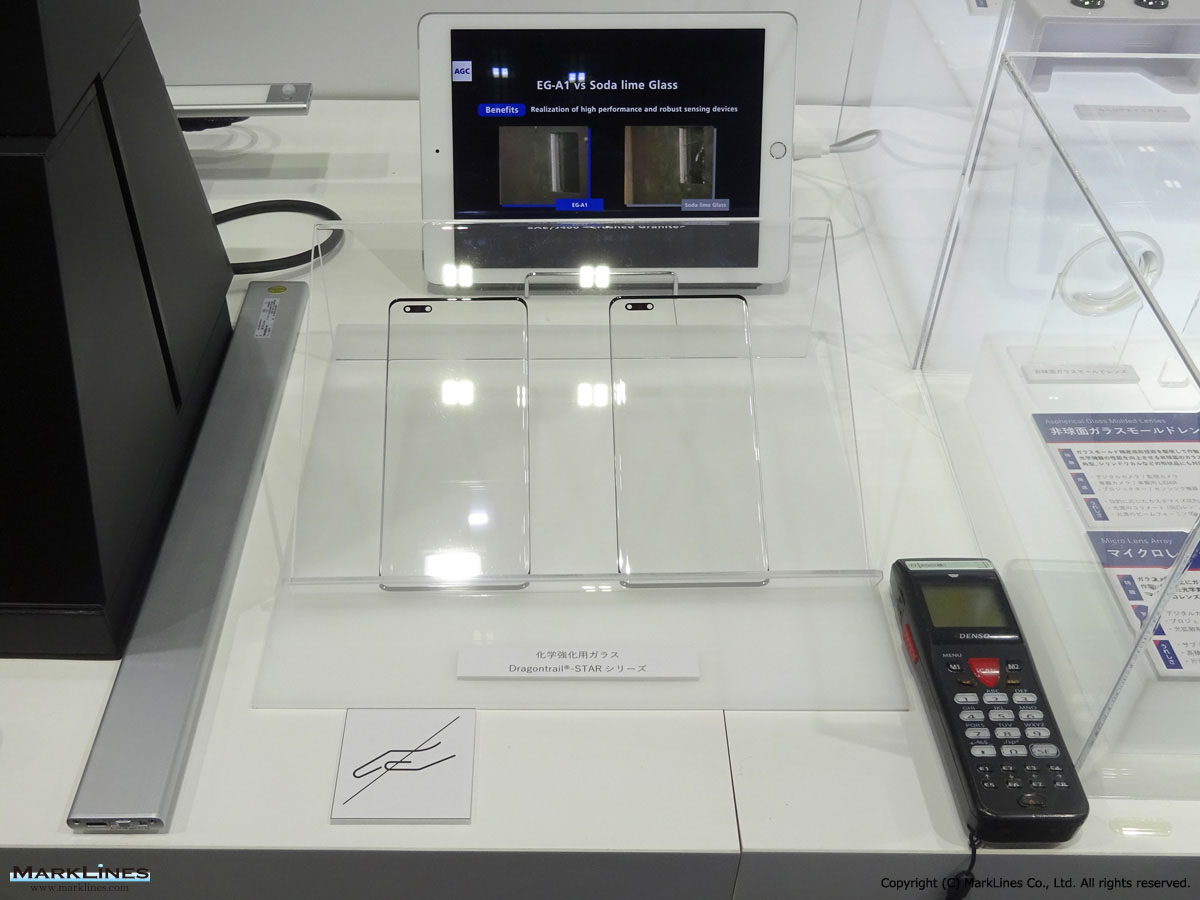
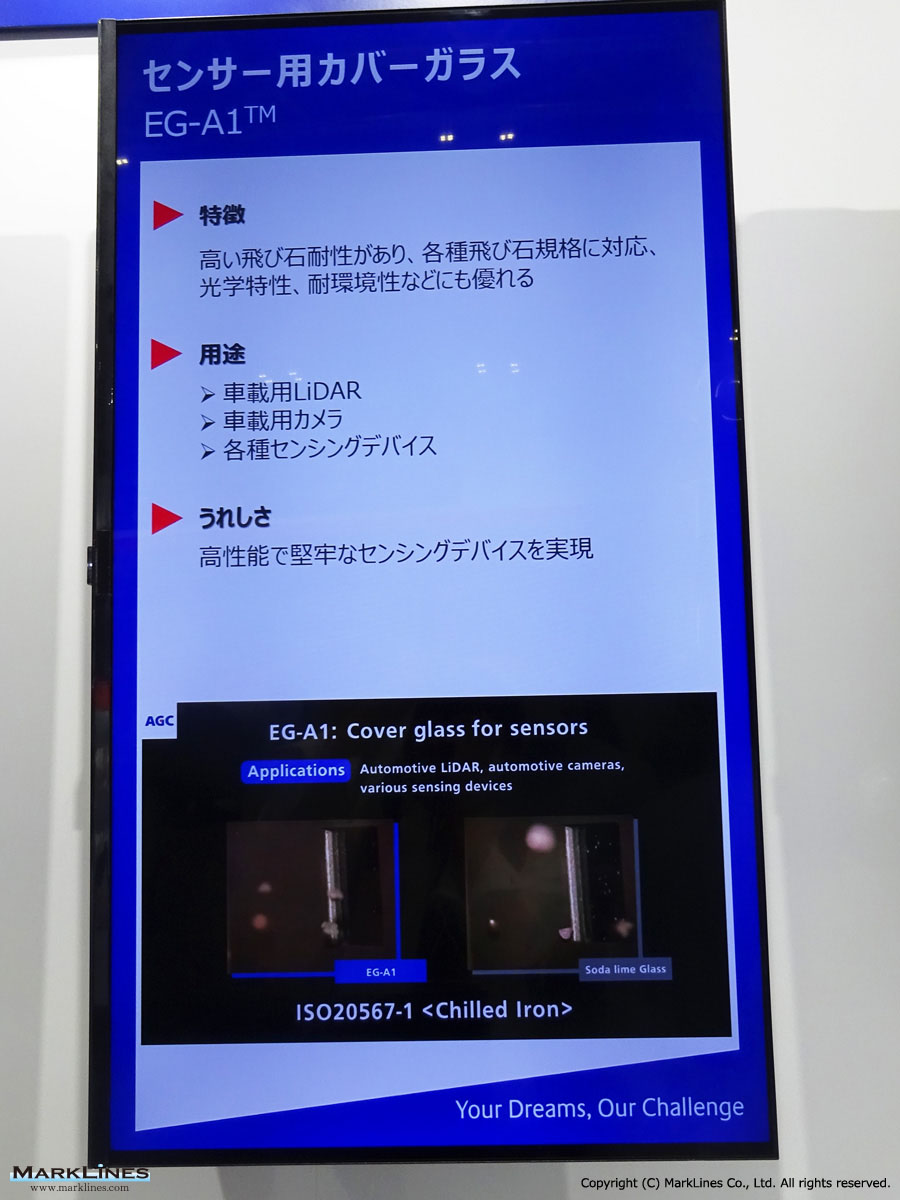
Glass cover for sensor EG-A1
 1
1
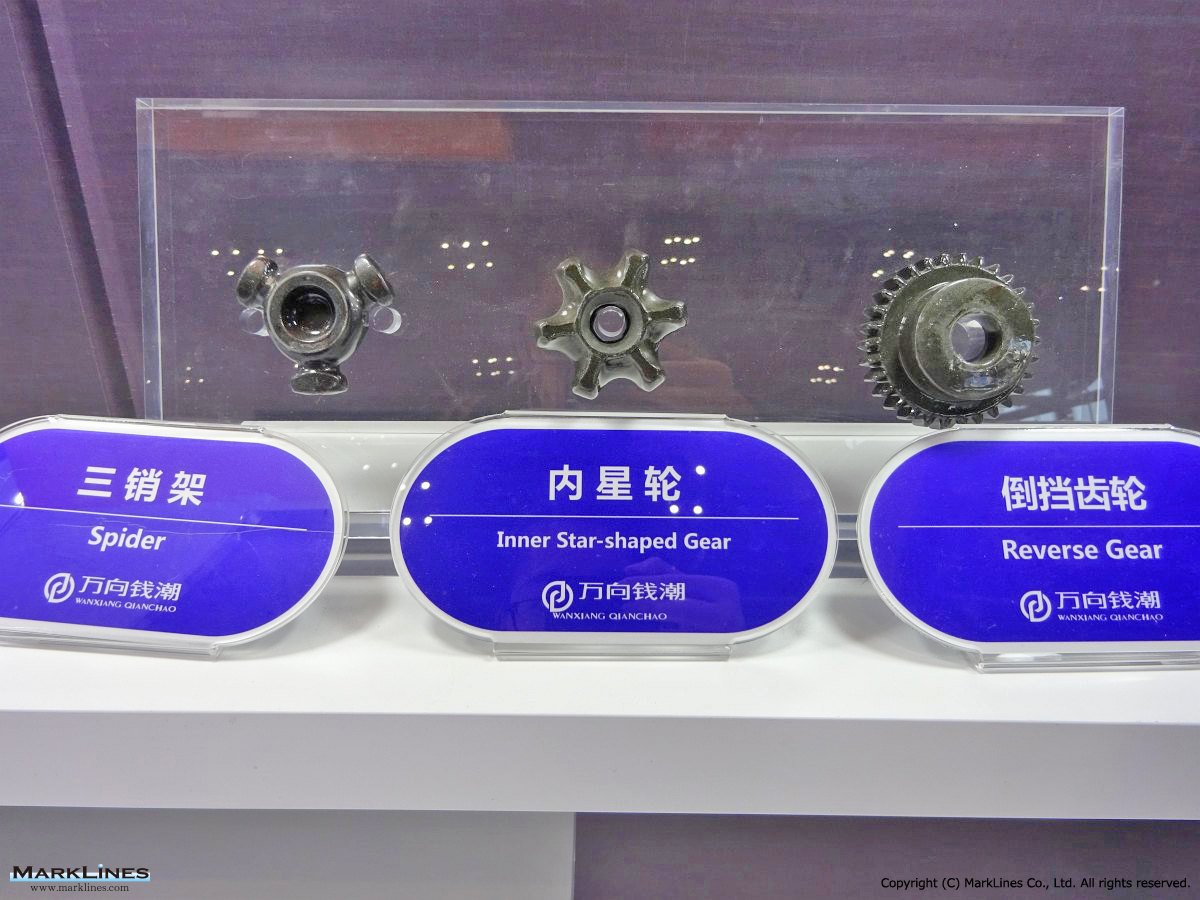
From left to right:Spider, Inner star-shaped Gear, Reverse gear
 4
4
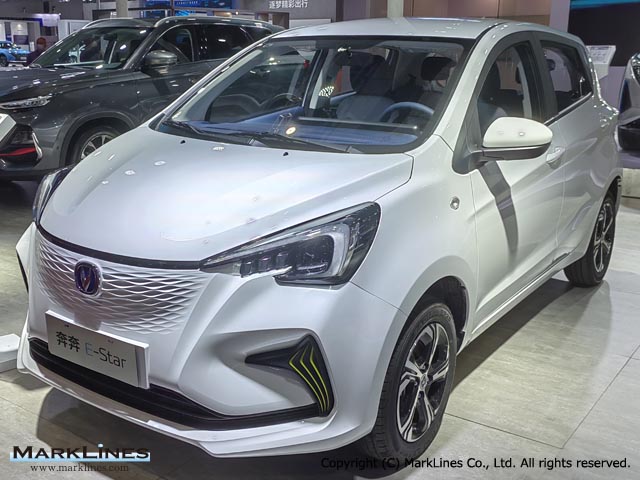
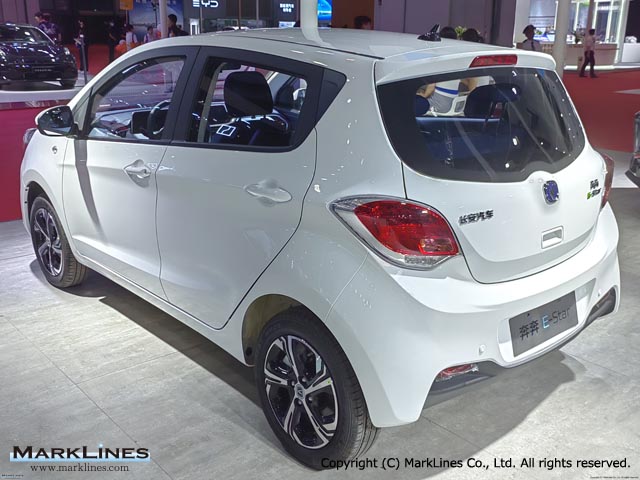
Benni E-Star
 4
4
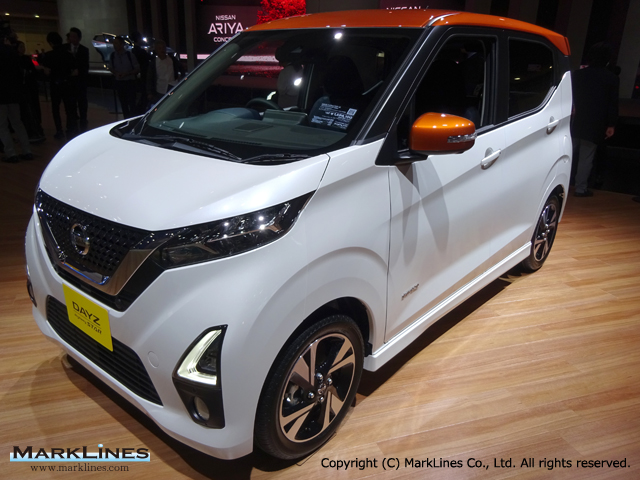
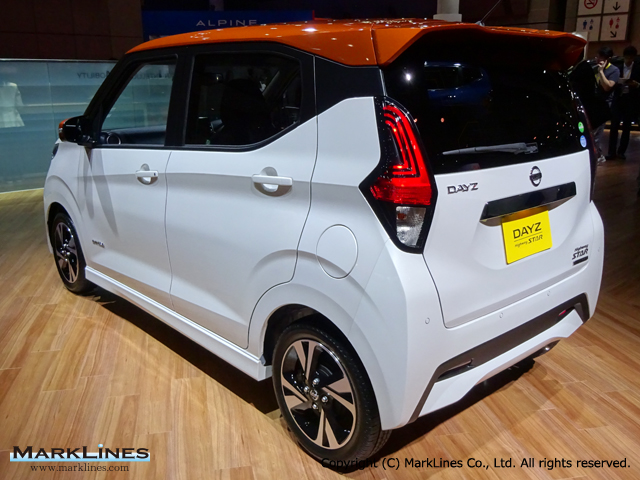
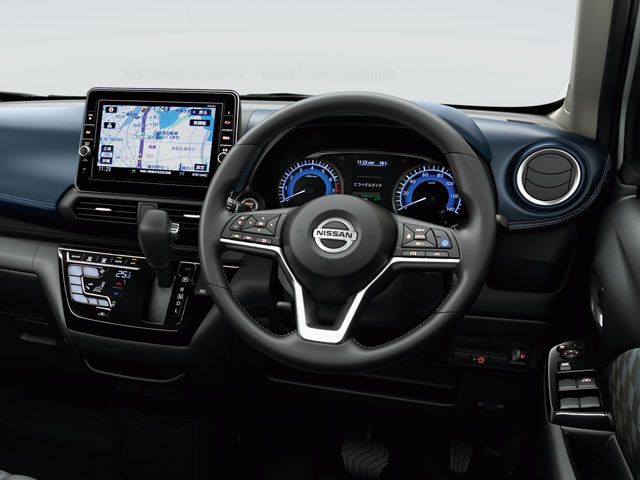
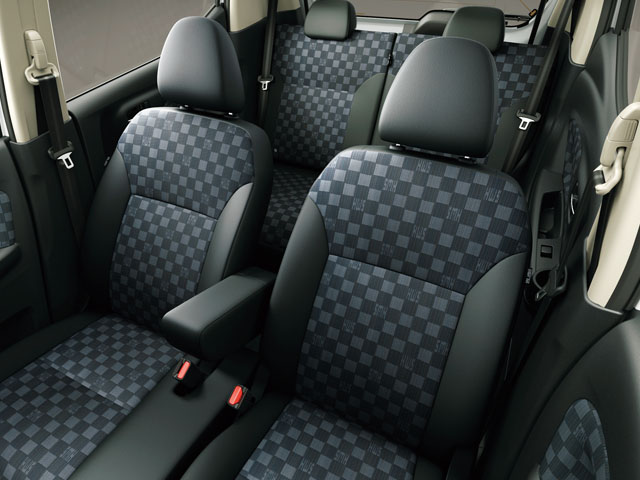
Dayz Highway Star
 6
6
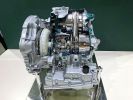
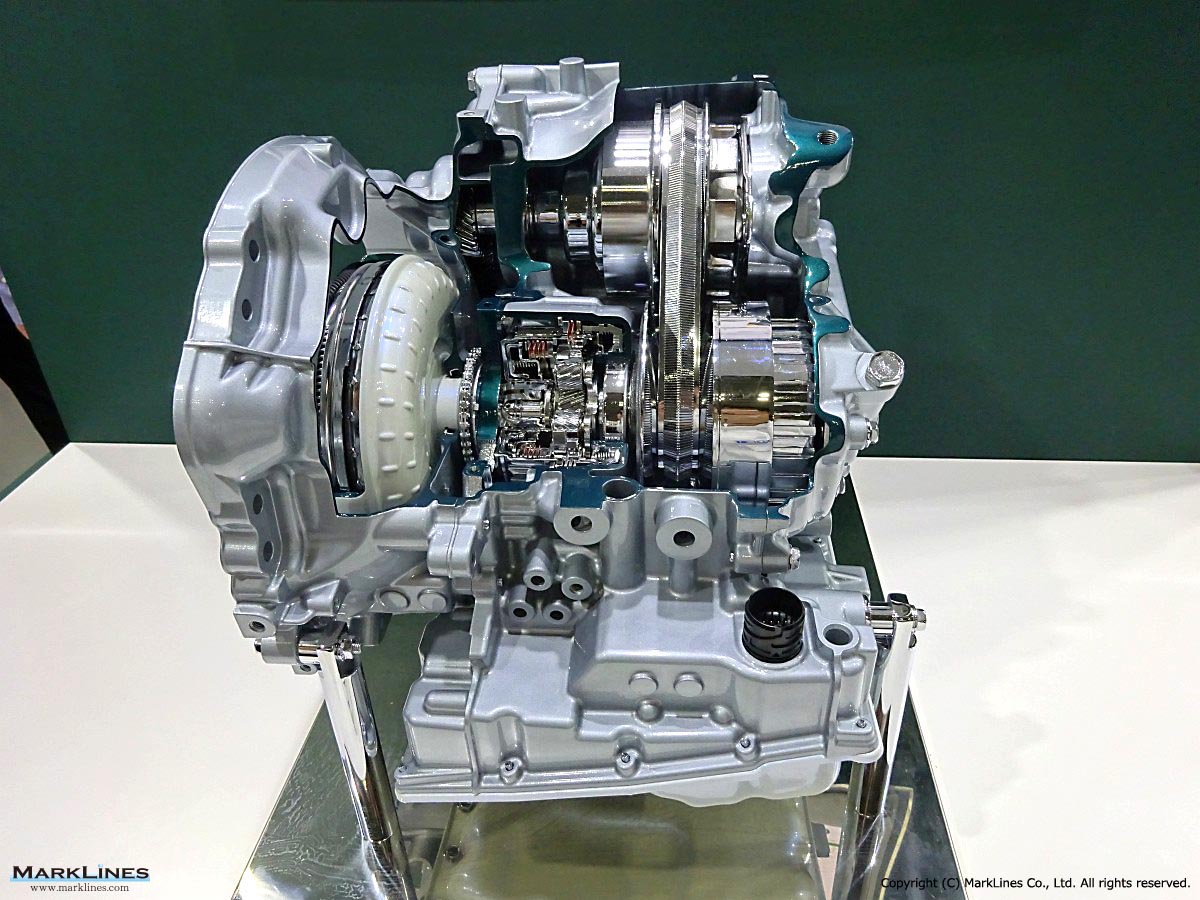
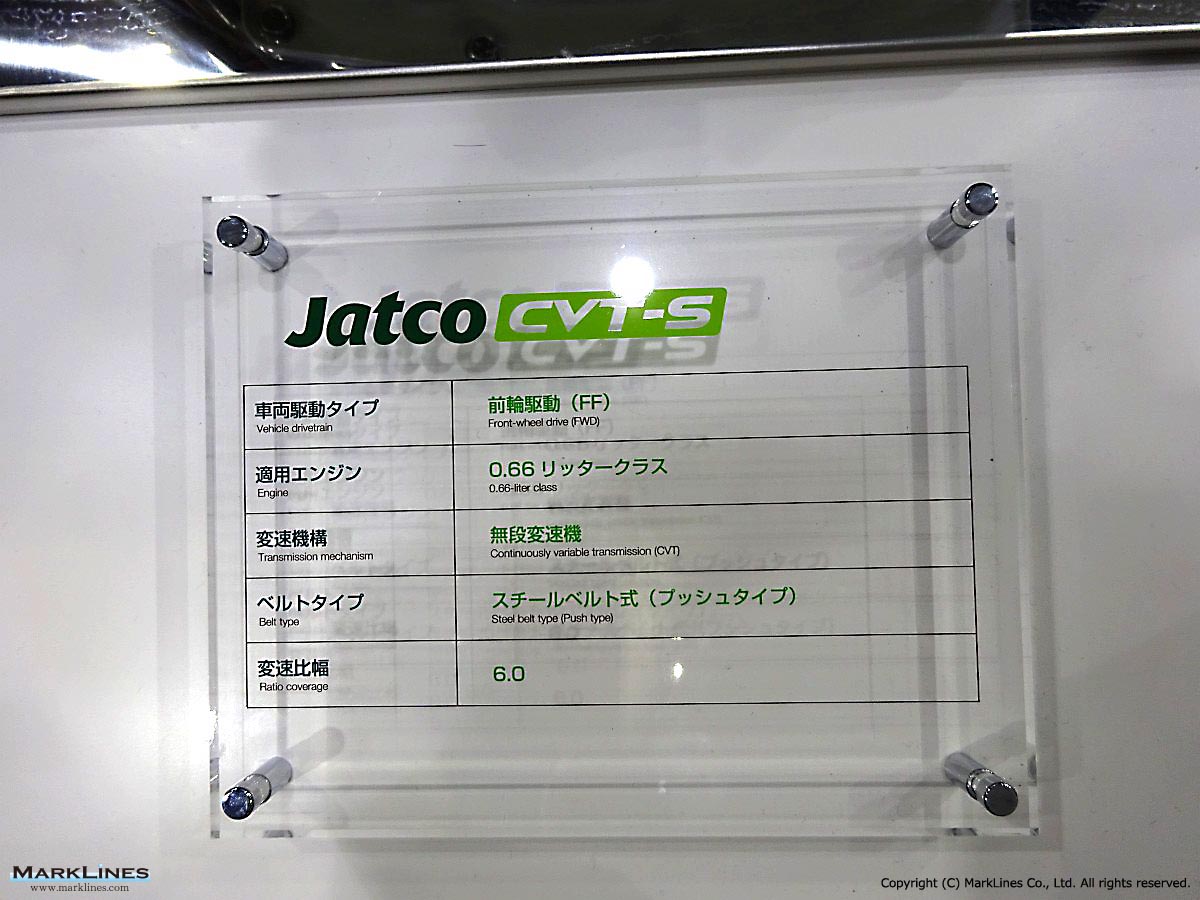
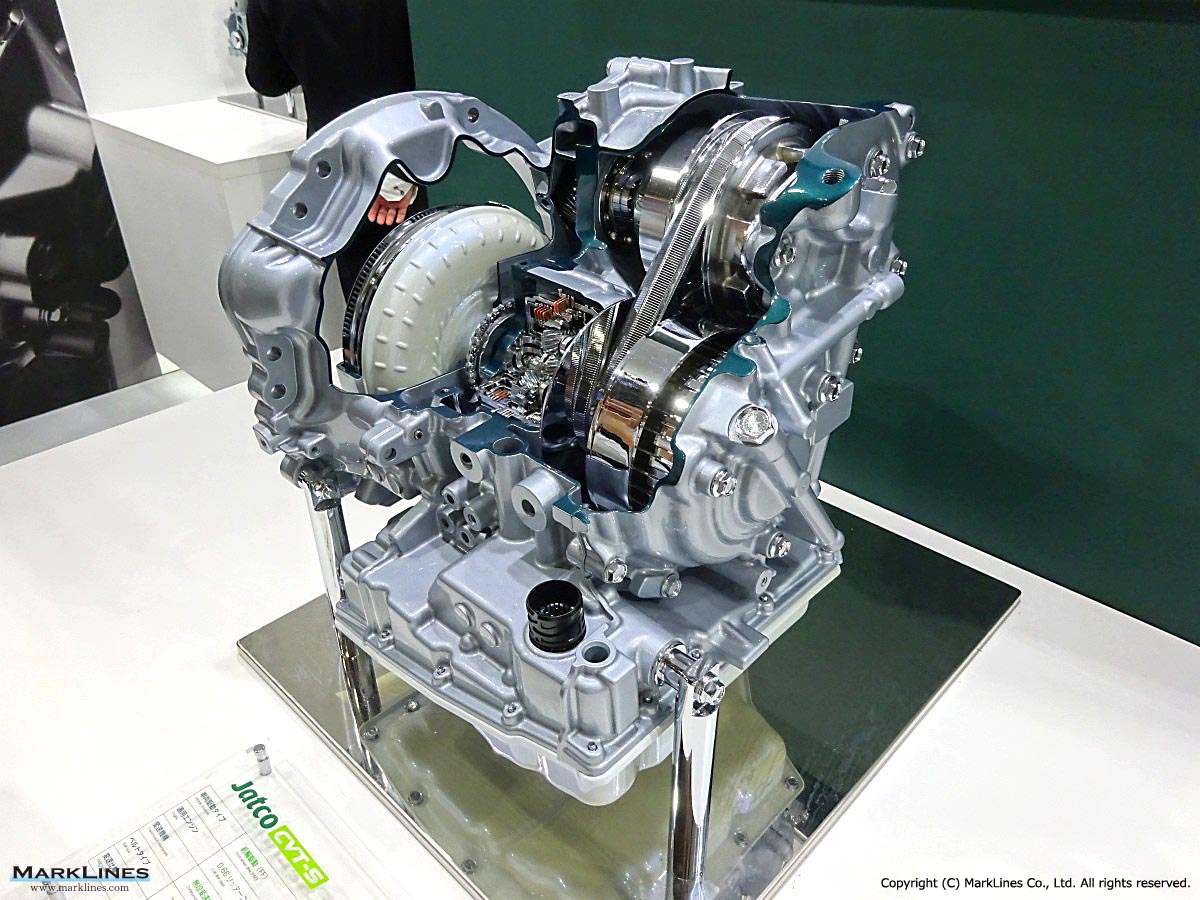
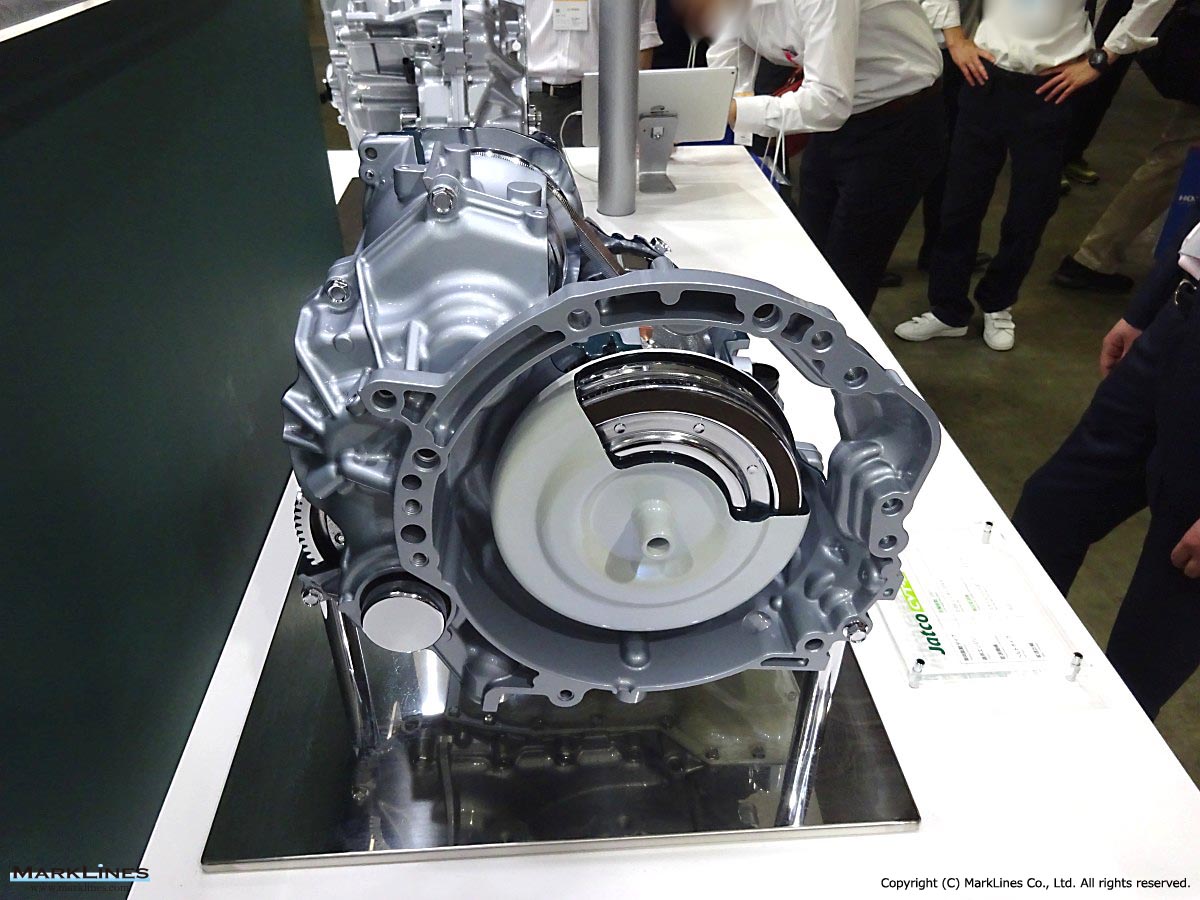
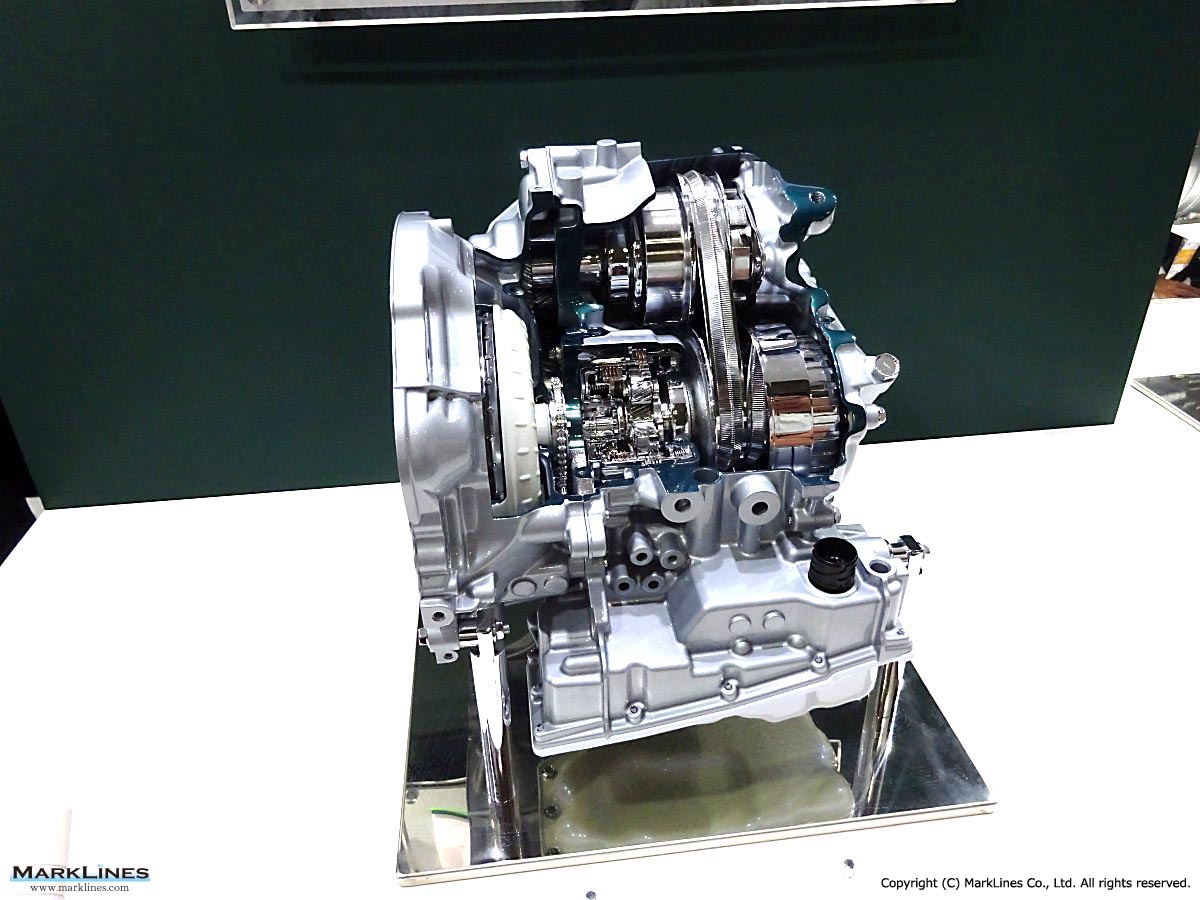
CVT-S
 1
1
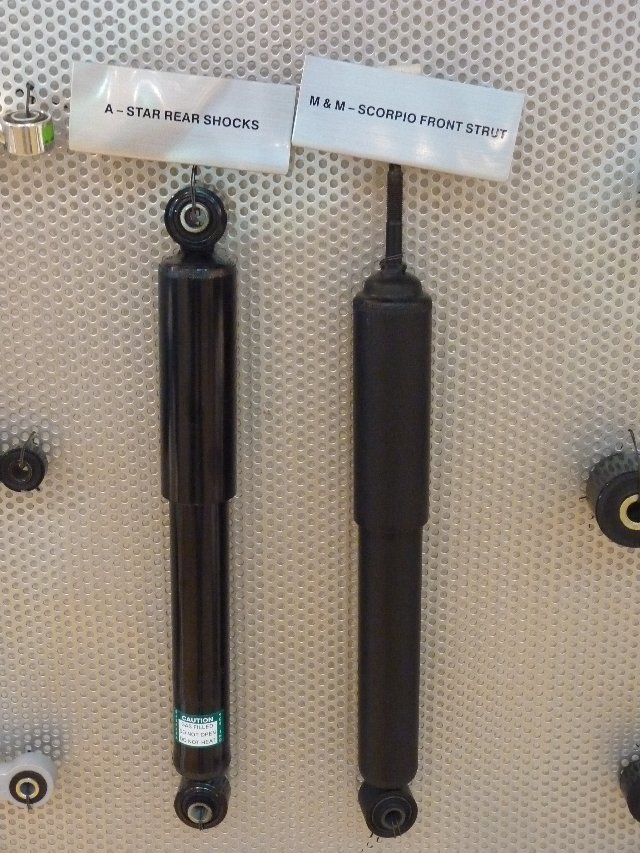
Gabriel India Ltd. Front strut & Rear shock absorber
 1
1
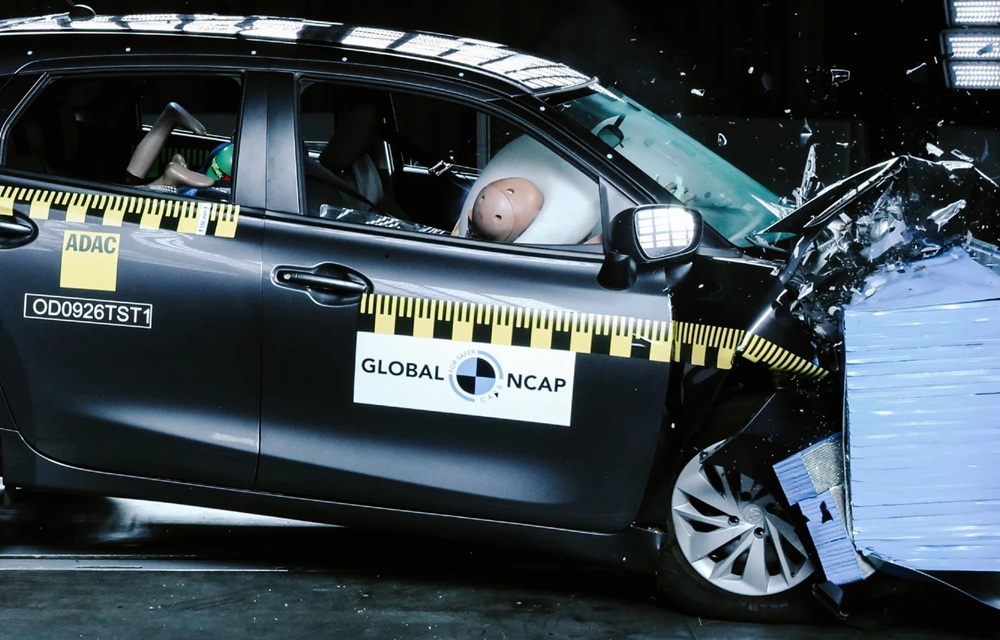
Global NCAP gives zero-star adult safety rating to Toyota Starlet
 1
1
Green SM Laos strengthens electric mobility ecosystem with Umoney Payment integration
 2
2
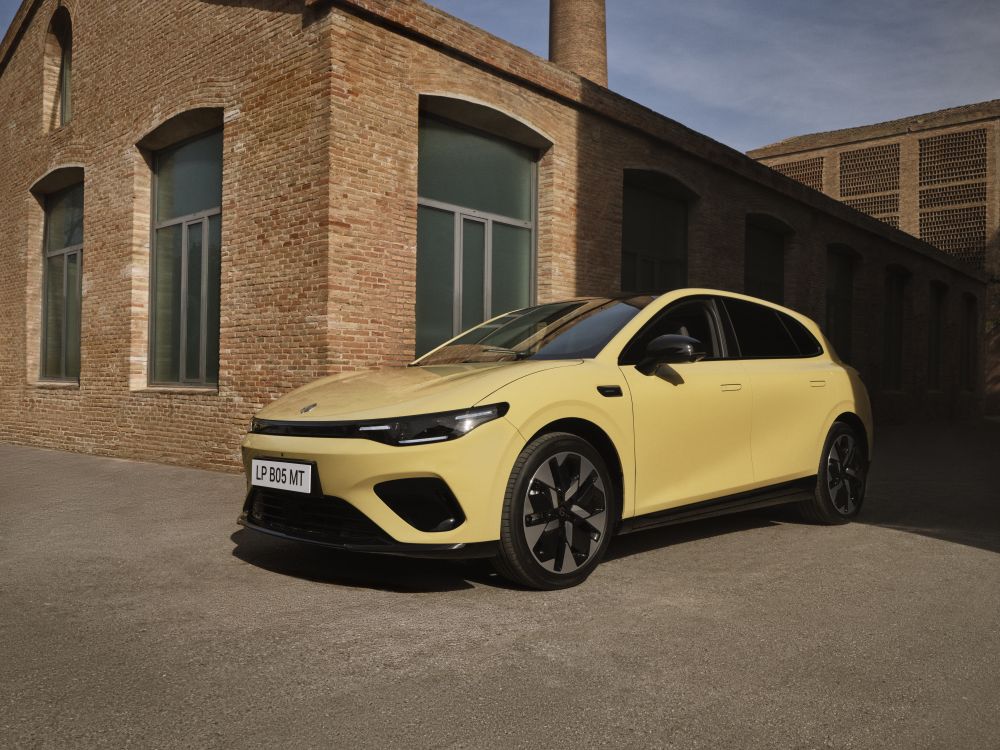
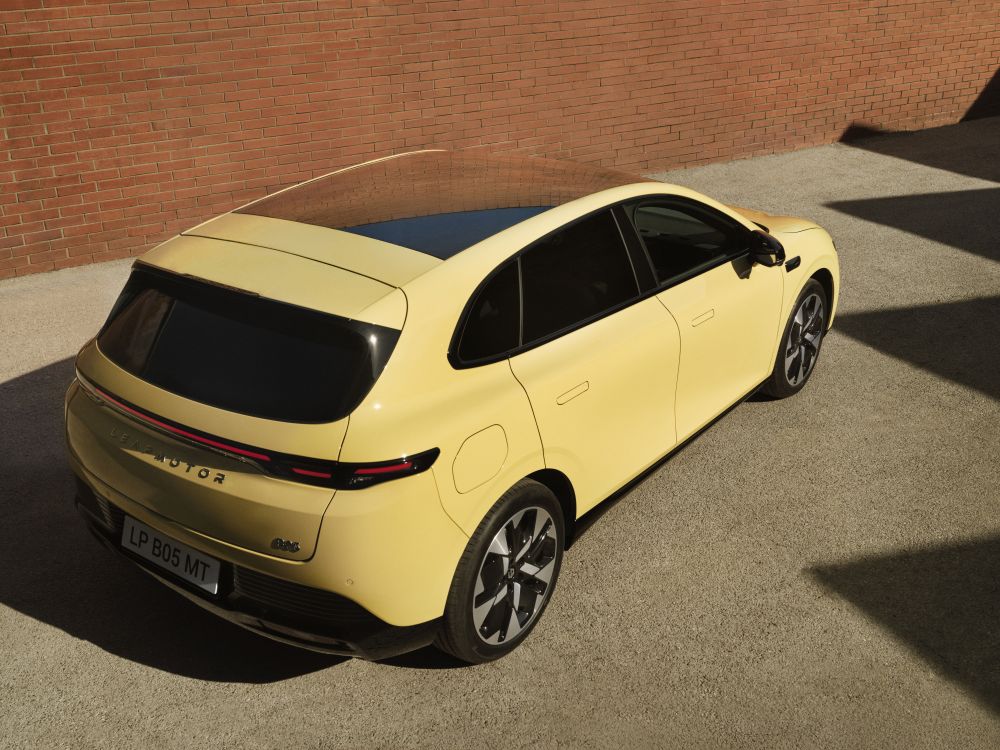
Stellantis launches new Leapmotor B05 C-segment electric hatchback in Europe
Sort by :
1 - 14 of 14 results
New Zealand - Flash report, Automotive sales volume, 2023
,887 1.7% BMW 120 1.4% 1,761 1.6% Skoda 111 1.3% 1,716 1.6% Mercedes-Benz 91 1.1% 1,486 1.3% Audi 44 0.5% 1,372 1.2% Lexus 101 1.2% 1,305 1.2% Land Rover 54 0.6% 1,222 1.1% MINI 93 1.1% 1,039 0.9% Great Wall 220 2.6% 898 0.8% Peugeot 55 0.6% 886 0.8% Volvo 20 0.2% 583 0.5% Polestar 72 0.8% 545 0.5% Jeep 70 0.8% 510 0.5% Porsche 1 0.0% 476 0.4% CUPRA 49 0.6% 471 0.4% KG Mobility / Ssangyong 33 0.4% 364 0.3% Opel 40 ...
Automotive Sales Data Updated at: 2025/06/04
New Zealand - Flash report, Automotive sales volume, 2022
2,397 2.1% Haval 139 1.6% 2,273 2.0% Skoda 174 2.0% 2,242 1.9% Mercedes-Benz 126 1.5% 2,056 1.8% BYD 317 3.7% 1,684 1.5% BMW 102 1.2% 1,656 1.4% Audi 105 1.2% 1,598 1.4% Peugeot 81 1.0% 1,536 1.3% Land Rover 64 0.8% 1,361 1.2% Lexus 51 0.6% 1,020 0.9% MINI 92 1.1% 851 0.7% Polestar 24 0.3% 818 0.7% Volvo 33 0.4% 774 0.7% Ssangyong 25 0.3% 642 0.6% Porsche 16 0.2% 577 0.5% Jeep 23 0.3% 456 0.4% Jaguar 18 0.2% 415 0....
Automotive Sales Data Updated at: 2025/06/04
Germany - Flash report, Automotive sales volume, 2021
.2% 0.2% 0.0 pt Jaguar Total 267 903 -70.4% 4,267 6,993 -39.0% Share 0.1% 0.3% -0.2 pt 0.2% 0.2% -0.1 pt Lexus Total 353 437 -19.2% 3,116 3,530 -11.7% Share 0.2% 0.1% 0.0 pt 0.1% 0.1% 0.0 pt Alfa Romeo Total 184 419 -56.1% 2,991 3,246 -7.9% Share 0.1% 0.1% -0.1 pt 0.1% 0.1% 0.0 pt Polestar Total 469 - -% 2,631 - -% Share 0.2% -% -% 0.1% -% -% DS Total 190 387 -50.9% 2,069 2,773 -25.4% Share 0.1% 0.1% 0.0 pt 0.1% 0.1% 0.0 pt ...
Automotive Sales Data Updated at: 2025/06/04
New Zealand - Flash report, Automotive sales volume, 2021
.3% Citroen 10 0.1% 278 0.2% SEAT 12 0.2% 177 0.2% Holden - -% 152 0.1% CUPRA 2 0.0% 147 0.1% Mahindra & Mahindra 15 0.2% 131 0.1% Alfa Romeo 13 0.2% 131 0.1% Fiat 11 0.1% 123 0.1% Aston Martin - -% 73 0.1% Can-Am 8 0.1% 72 0.1% Bentley - -% 63 0.1% Yamaha 4 0.1% 53 0.0% Polestar 34 0.5% 46 0.0% Maserati 2 0.0% 46 0.0% Ferrari 1 0.0% 38 0.0% McLaren - -% 23 0.0% Lamborghini 1 0.0% 21 0.0% Rolls Royce 1 0.0% 13 0....
Automotive Sales Data Updated at: 2025/06/04
China - Flash report, Automotive sales volume, 2021
roduction and sales results for the month of December, 2021.From the perspective of annual performance, vehicle production and sales in 2021 registered a year-over-year (y/y) increase, putting an end to the three consecutive years of decline since 2018. New Energy Vehicle (NEV) became the brightest star, having deliveries of more than 3.5 million units, increasing its market share to 13.4%. China’s car exports delivered excellent performance, w...
Automotive Sales Data Updated at: 2025/06/04
Germany - Flash report, Sales volume, 2020
ana) 2,928 6,105 -52.0% 21,134 24,315 -13.1% 6 Skoda Kodiaq 2,816 4,338 -35.1% 16,580 21,221 -21.9% 7 VW T-Roc 2,777 5,625 -50.6% 15,471 25,656 -39.7% 8 Ford Focus 2,741 5,362 -48.9% 21,058 26,718 -21.2% 9 Opel (2018-) Opel Corsa 2,723 4,395 -38.0% 14,958 20,132 -25.7% 10 Mitsubishi Space Star 2,591 2,212 17.1% 8,840 9,934 -11.0% Source: Kraftfahrt-Bundesamt (KBA) Flash report, April 2020 7 May 2020 *There are cases where recentl...
Automotive Sales Data Updated at: 2025/06/04
New Zealand - Flash report, Sales volume, 2020
geot 4 0.1% 80 0.2% Sinotruk 3 0.1% 52 0.1% Chevrolet - -% 42 0.1% Mack 1 0.0% 38 0.1% Freightliner 4 0.1% 34 0.1% International 4 0.1% 27 0.1% Elddis 2 0.1% 25 0.1% Suzuki 4 0.1% 22 0.1% Factory Built 10 0.4% 19 0.0% Liebherr 1 0.0% 8 0.0% Alexander Dennis - -% 7 0.0% Western Star - -% 6 0.0% XCMG - -% 4 0.0% BCI - -% 3 0.0% Grove - -% 3 0.0% Citroen - -% 2 0.0% Dodge - -% 1 0.0% JAC - -% 1 0.0% King Long - -%...
Automotive Sales Data Updated at: 2025/06/04
New Zealand - Flash report, Sales volume, 2013
.7% Hino 36 1.5% 500 1.6% Ssangyong 35 1.5% 448 1.5% Fiat 25 1.0% 282 0.9% Volvo 7 0.3% 218 0.7% DAF 9 0.4% 212 0.7% UD Trucks 18 0.7% 193 0.6% Scania 8 0.3% 190 0.6% Foton 8 0.3% 154 0.5% Alexander Dennis 7 0.3% 124 0.4% Kenworth 4 0.2% 121 0.4% MAN 23 1.0% 120 0.4% Western Star 2 0.1% 102 0.3% Freightliner 7 0.3% 100 0.3% Iveco 4 0.2% 98 0.3% Suzuki 4 0.2% 92 0.3% Land Rover 0 0.0% 63 0.2% Mack 1 0.0% 55 0.2% ...
Automotive Sales Data Updated at: 2024/07/22
New Zealand - Flash report, Sales volume, 2019
ndra 2 0.1% 95 0.2% Alexander Dennis - -% 63 0.1% Mack 1 0.0% 60 0.1% Peugeot 2 0.1% 56 0.1% Freightliner 4 0.1% 54 0.1% Factory Built 3 0.1% 32 0.1% Chevrolet 3 0.1% 30 0.1% International 1 0.0% 27 0.1% Elddis 2 0.1% 25 0.0% Liebherr 2 0.1% 14 0.0% Suzuki - -% 14 0.0% Western Star - -% 14 0.0% Jaguar - -% 6 0.0% Grove - -% 5 0.0% Sunlong - -% 5 0.0% BCI - -% 4 0.0% Cadillac - -% 3 0.0% Higer - -% 3 0.0% Hualin...
Automotive Sales Data Updated at: 2020/01/10
New Zealand - Flash report, Sales volume, 2018
ilt 2 0.1% 185 0.3% Alexander Dennis 22 0.6% 150 0.3% BCI 1 0.0% 108 0.2% Mahindra & Mahindra 7 0.2% 98 0.2% Freightliner 5 0.1% 74 0.1% Mack - -% 65 0.1% Peugeot 2 0.1% 60 0.1% Suzuki 6 0.2% 49 0.1% Ram 2 0.1% 44 0.1% Sinotruk 2 0.1% 37 0.1% International - -% 24 0.0% Western Star 1 0.0% 22 0.0% Chevrolet 1 0.0% 21 0.0% Zhengzhou Yutong Bus - -% 12 0.0% Liebherr - -% 9 0.0% Elddis 1 0.0% 8 0.0% Sunlong - -% 7 0.0%...
Automotive Sales Data Updated at: 2019/01/11
New Zealand - Flash report, Sales volume, 2017
enault 10 0.3% 184 0.4% Great Wall 10 0.3% 169 0.3% Freightliner 13 0.4% 70 0.1% Mack 3 0.1% 62 0.1% Mahindra & Mahindra 2 0.1% 59 0.1% Ram 6 0.2% 52 0.1% Suzuki 6 0.2% 52 0.1% BCI - -% 47 0.1% Peugeot 3 0.1% 42 0.1% Sinotruk 5 0.1% 31 0.1% International 1 0.0% 25 0.0% Western Star 1 0.0% 25 0.0% Alexander Dennis - -% 25 0.0% Higer 1 0.0% 15 0.0% King Long 1 0.0% 7 0.0% Liebherr - -% 5 0.0% Zhengzhou Yutong Bus - -...
Automotive Sales Data Updated at: 2018/07/24
New Zealand - Flash report, Sales volume, 2016
Renault 17 0.5% 167 0.4% Kenworth 5 0.2% 153 0.3% Mahindra & Mahindra 13 0.4% 116 0.3% Land Rover - -% 89 0.2% Freightliner 6 0.2% 87 0.2% BCI 2 0.1% 70 0.2% Mack 1 0.0% 55 0.1% Peugeot - -% 54 0.1% Alexander Dennis - -% 40 0.1% Ram 5 0.2% 28 0.1% Suzuki - -% 27 0.1% Western Star 2 0.1% 24 0.1% International 1 0.0% 21 0.0% Great Wall 2 0.1% 18 0.0% Caterpillar - -% 14 0.0% Designline - -% 10 0.0% King Long - -% 8...
Automotive Sales Data Updated at: 2017/01/16
New Zealand - Flash report, Sales volume, 2015
N 11 0.4% 172 0.4% Mahindra & Mahindra 7 0.2% 156 0.4% Suzuki 7 0.2% 130 0.3% Iveco 16 0.5% 129 0.3% Freightliner 12 0.4% 117 0.3% Land Rover 2 0.1% 110 0.3% Renault 36 1.1% 102 0.3% Mack 4 0.1% 73 0.2% Factory Built - -% 62 0.2% Peugeot 1 0.0% 47 0.1% Kia - -% 36 0.1% Western Star 1 0.0% 33 0.1% International 1 0.0% 20 0.1% Alexander Dennis - -% 13 0.0% Caterpillar - -% 8 0.0% Liebherr - -% 6 0.0% Terex 1 0.0% 5 0...
Automotive Sales Data Updated at: 2016/04/28
New Zealand - Flash report, Sales volume, 2014
0.6% 262 0.7% Scania 6 0.2% 193 0.5% DAF 6 0.2% 189 0.5% Kenworth 7 0.3% 177 0.5% Mahindra & Mahindra 11 0.4% 170 0.5% Freightliner 16 0.6% 162 0.4% Iveco 8 0.3% 131 0.4% Suzuki 1 0.0% 100 0.3% Land Rover 1 0.0% 77 0.2% Mack 2 0.1% 63 0.2% Alexander Dennis - -% 56 0.2% Western Star 3 0.1% 42 0.1% Factory Built 5 0.2% 41 0.1% Renault 1 0.0% 38 0.1% Peugeot 2 0.1% 35 0.1% Kia 1 0.0% 32 0.1% International 1 0.0% 26 0....
Automotive Sales Data Updated at: 2015/01/13


 Japan
Japan USA
USA Mexico
 Germany
 China (Shanghai)
 Thailand
 India
India