


Search Results by Category
All information related to {{ key_word }}.
AI Navigator will guide you. Click here for information about {{ key_word }}.
Images
 2
2
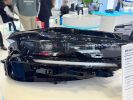
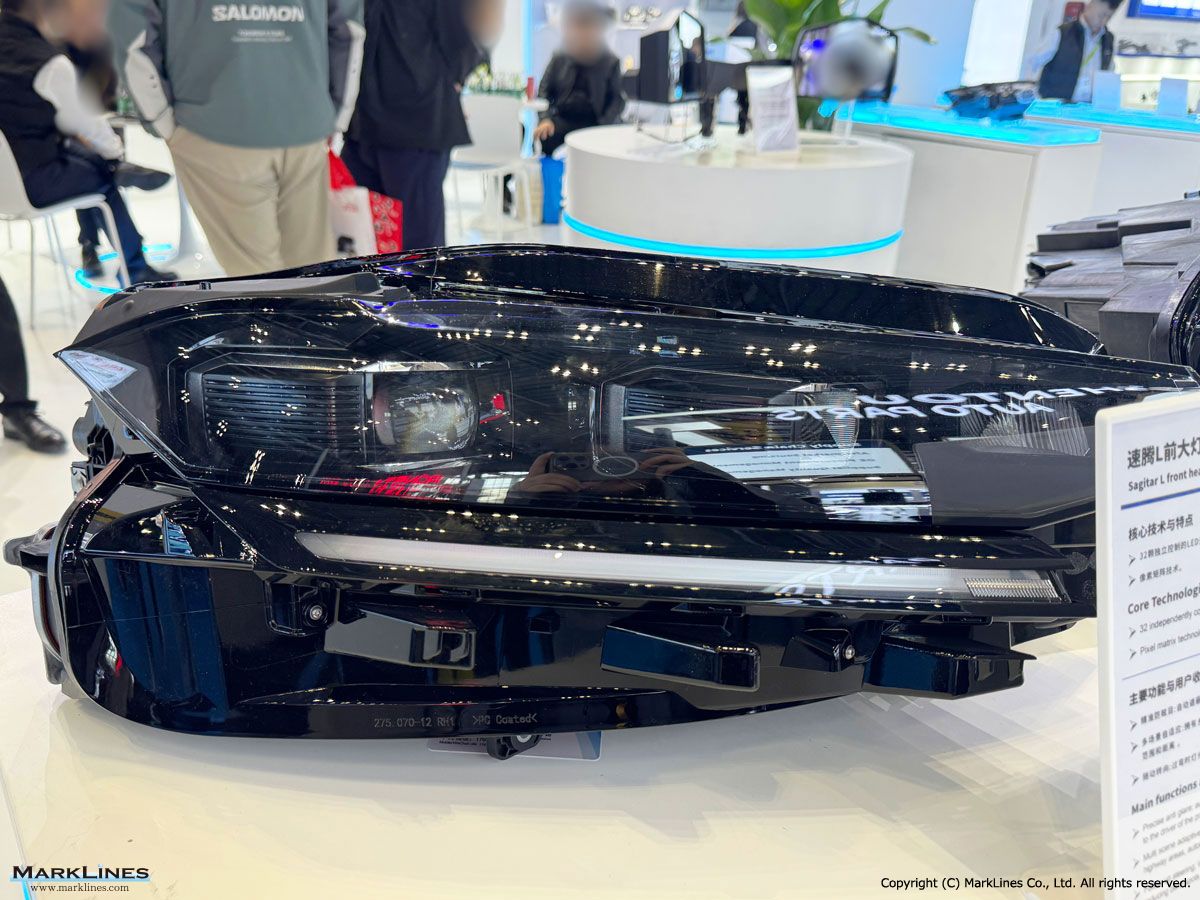
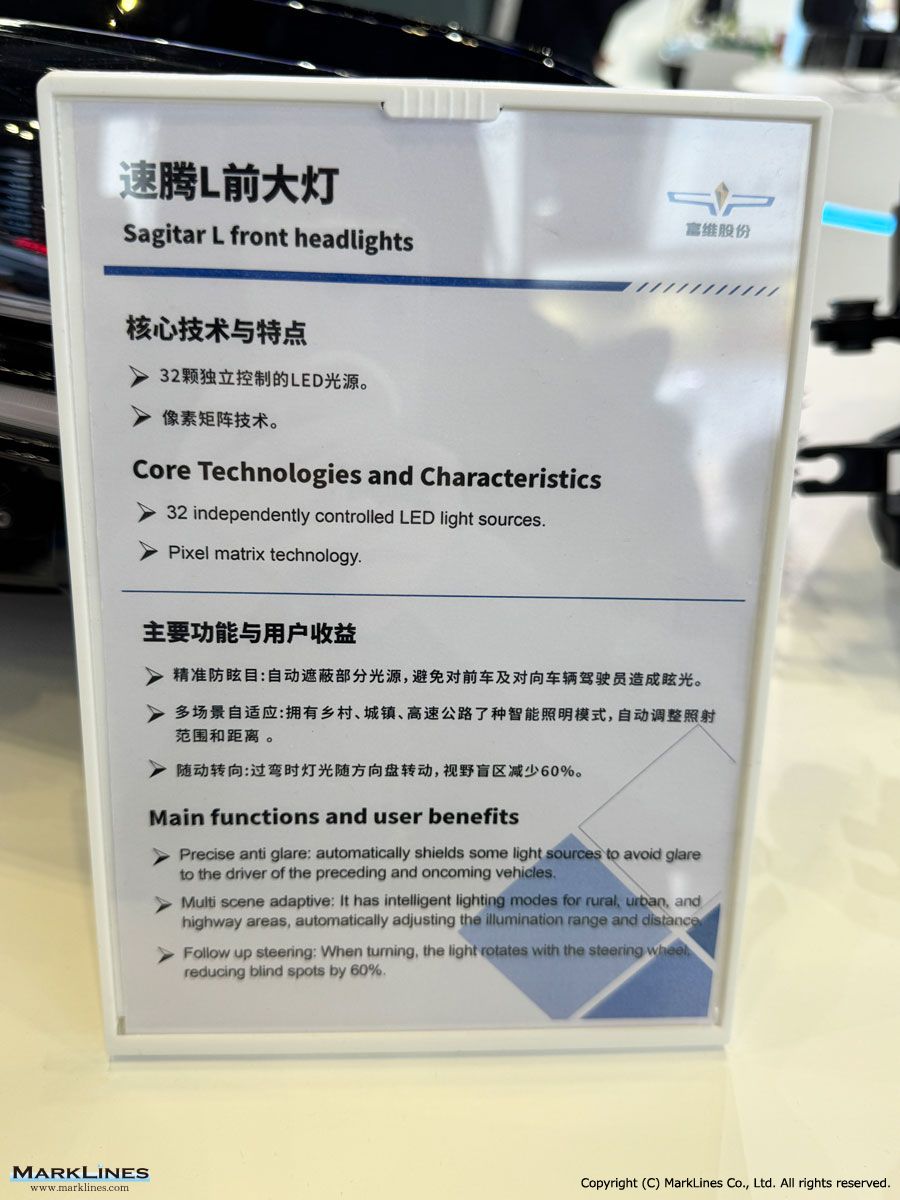
VW Sagitar L - Front headlights
 1
1
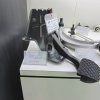
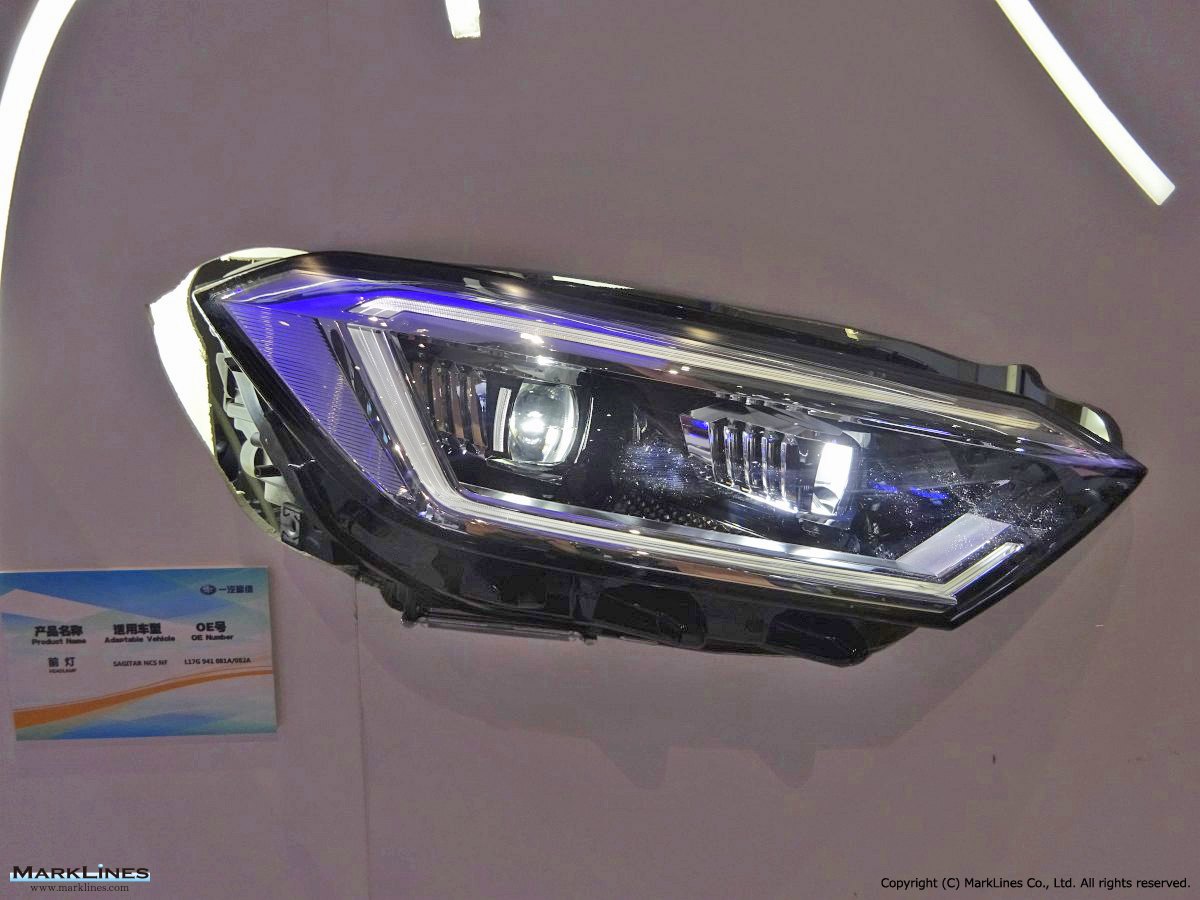
Headlamp
 2
2
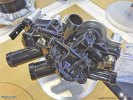
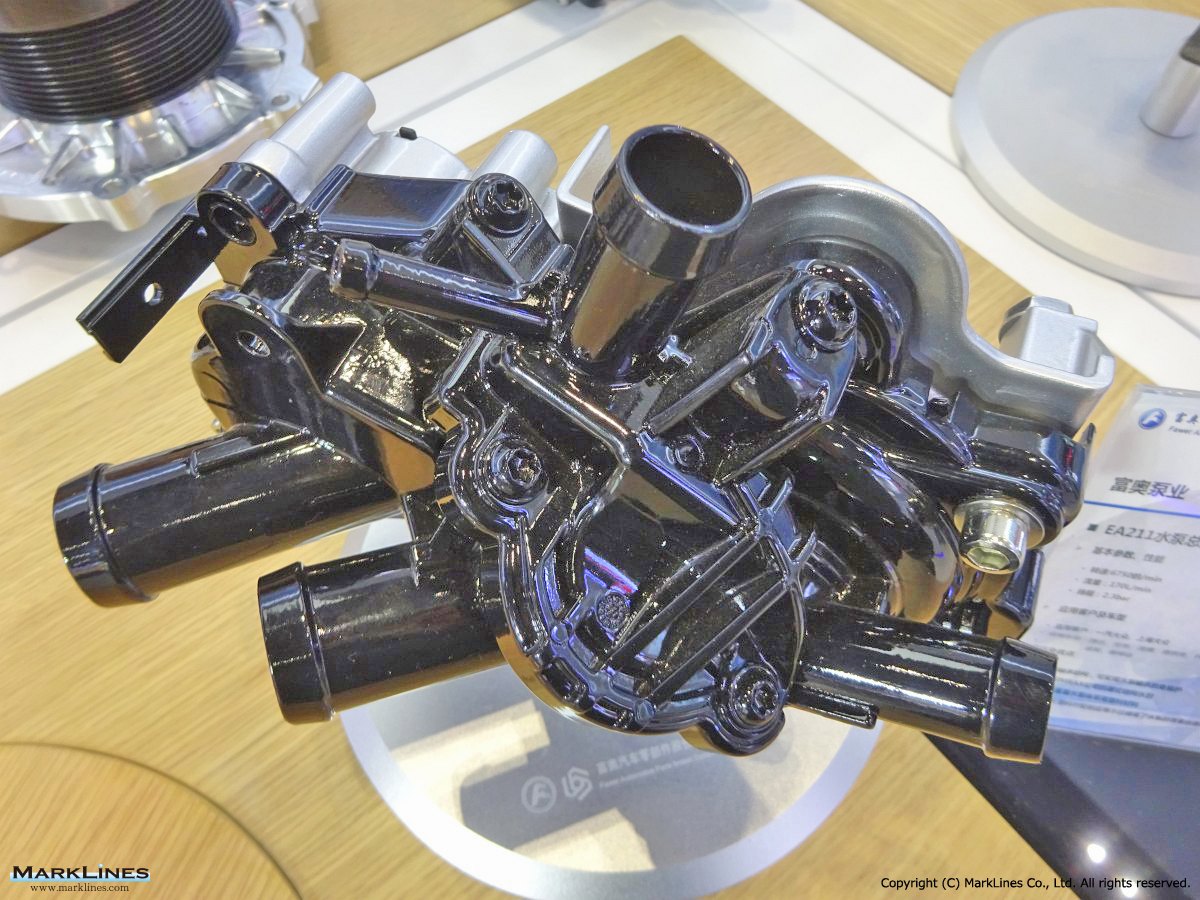
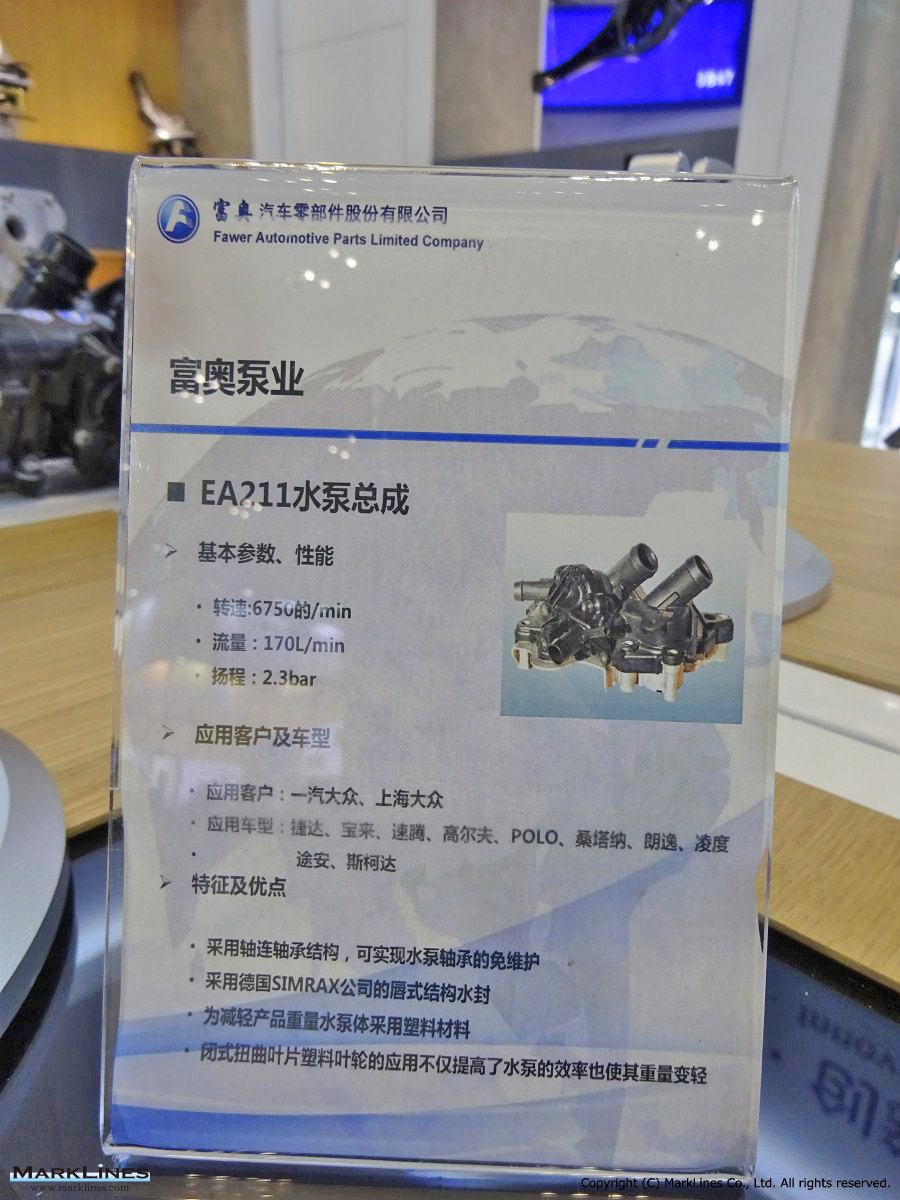
EA211 water pump assembly
 1
1
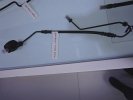
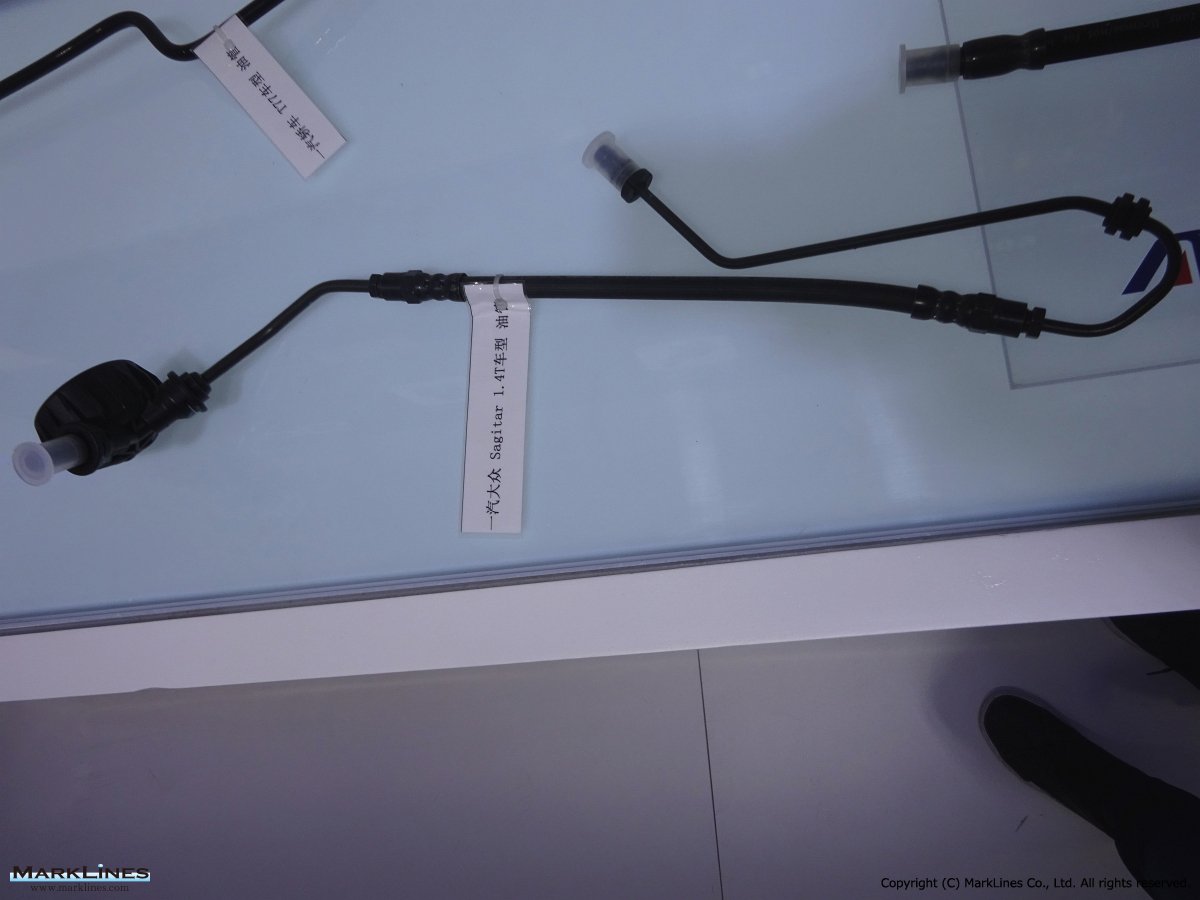
Oil tube
 1
1
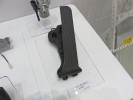
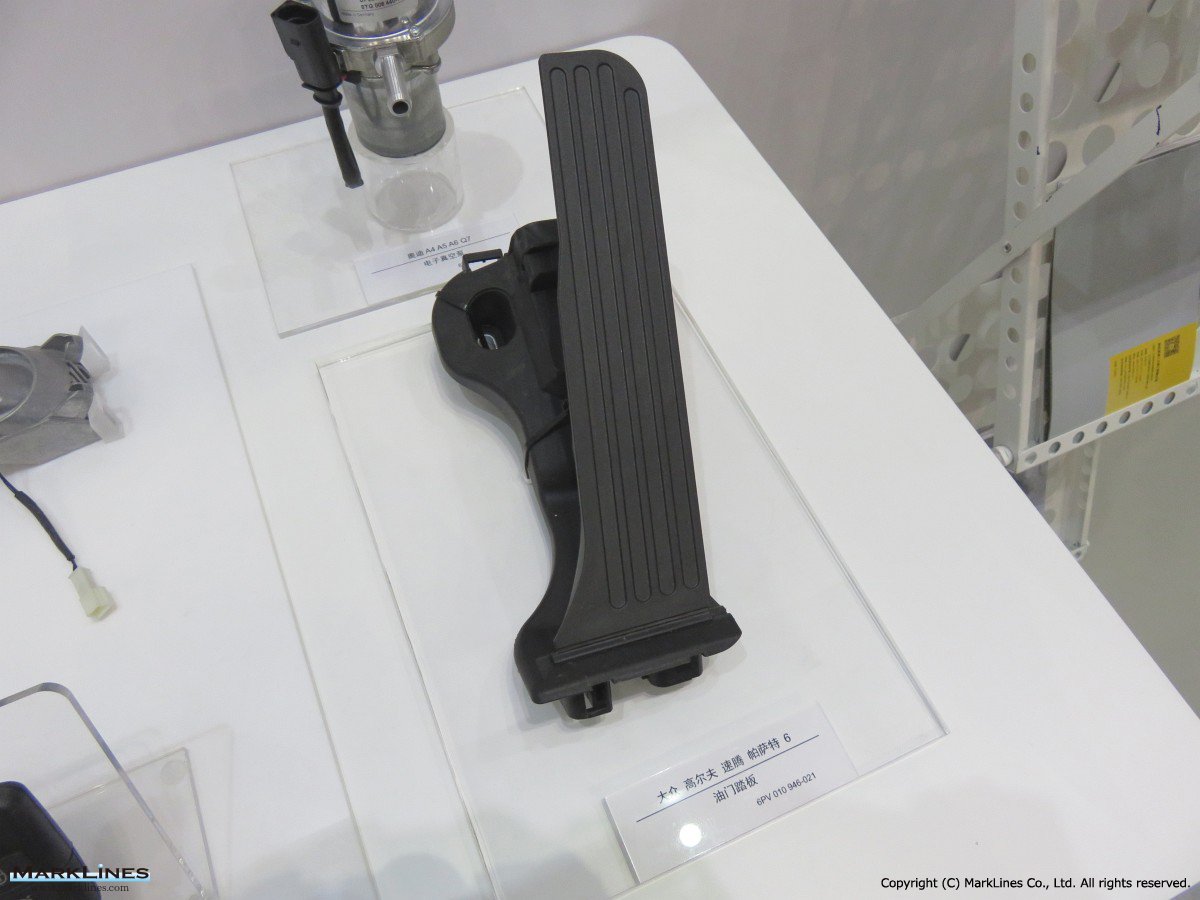
Accelerator pedal
 1
1
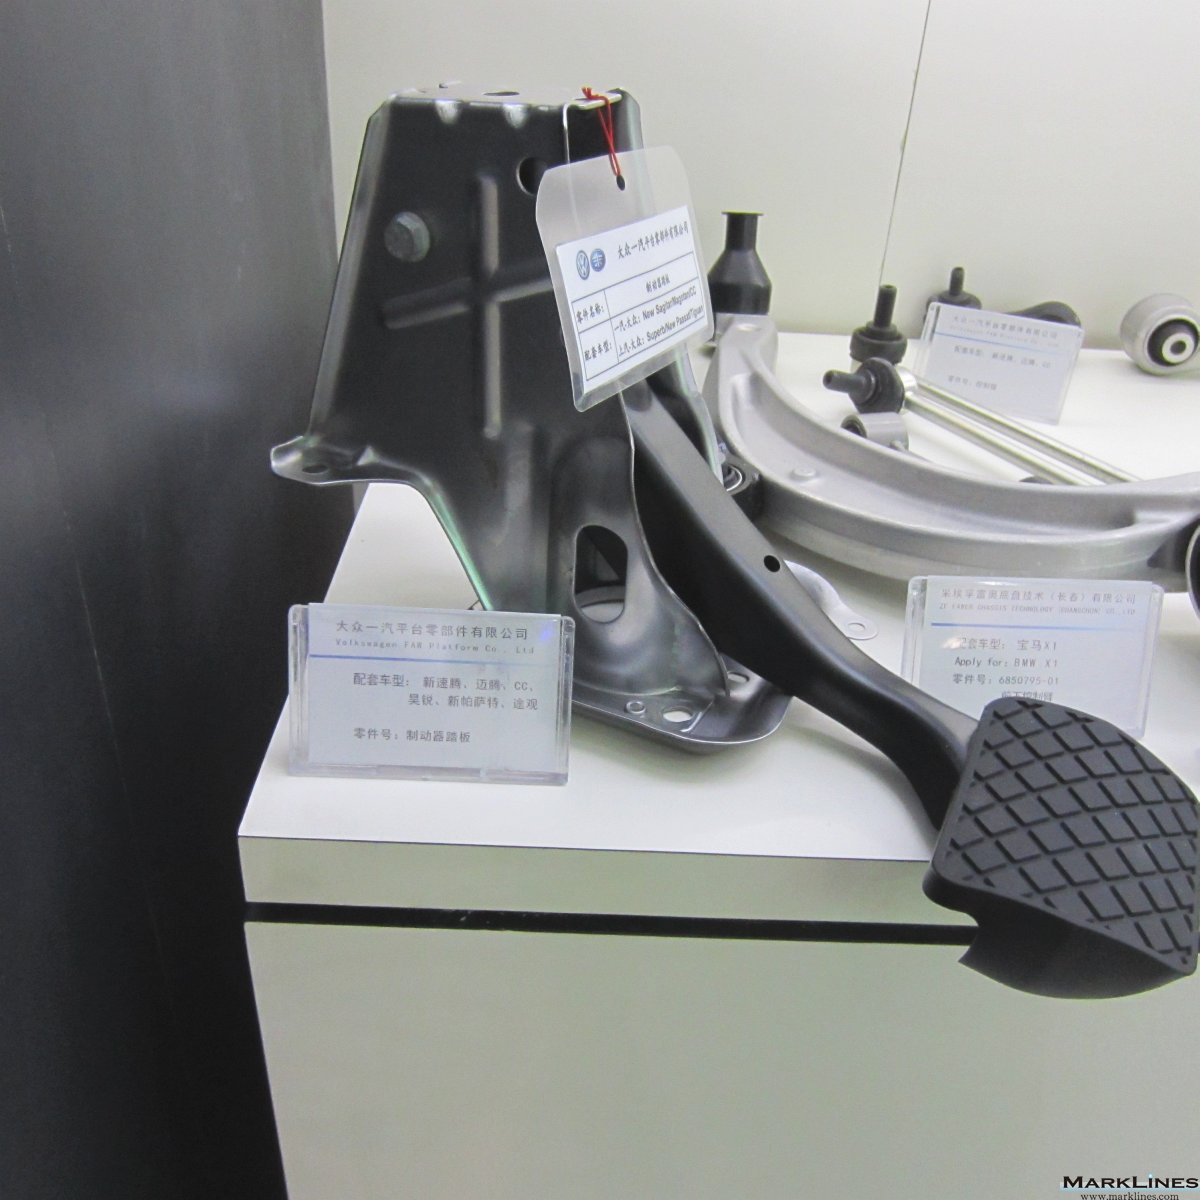
Brake pedal
 1
1
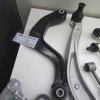
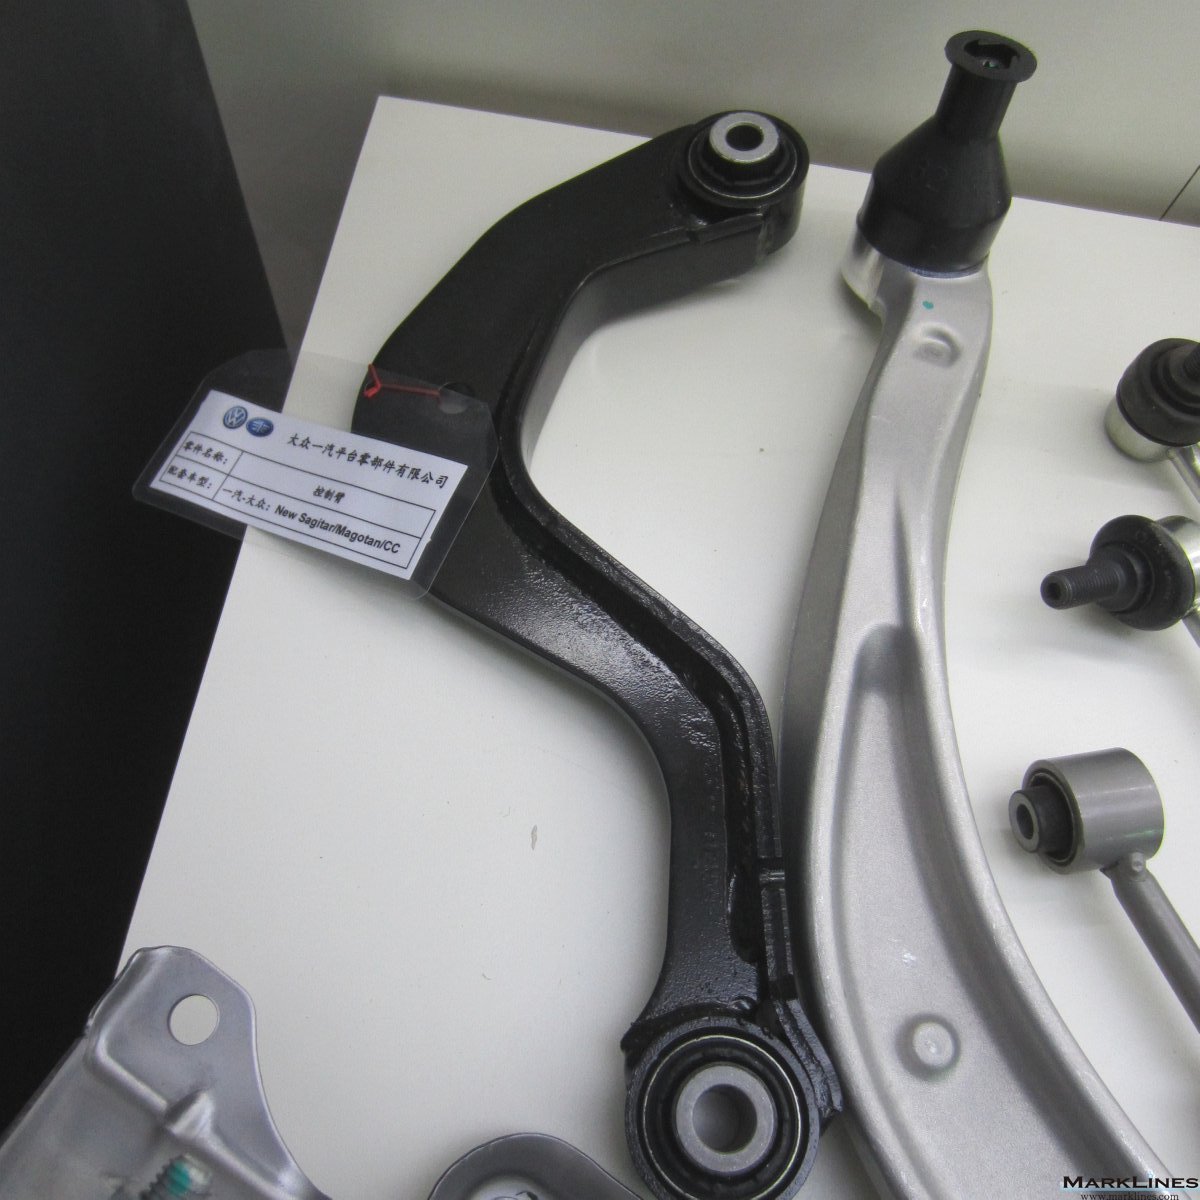
Control arm
 1
1
Changchun Faway / Stamping Parts Branch Company Seat back frame (Rear)
 1
1
Alcoa Fastening Systems (Suzhou) Co., Ltd. Seat fastener
 3
3
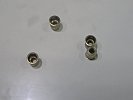
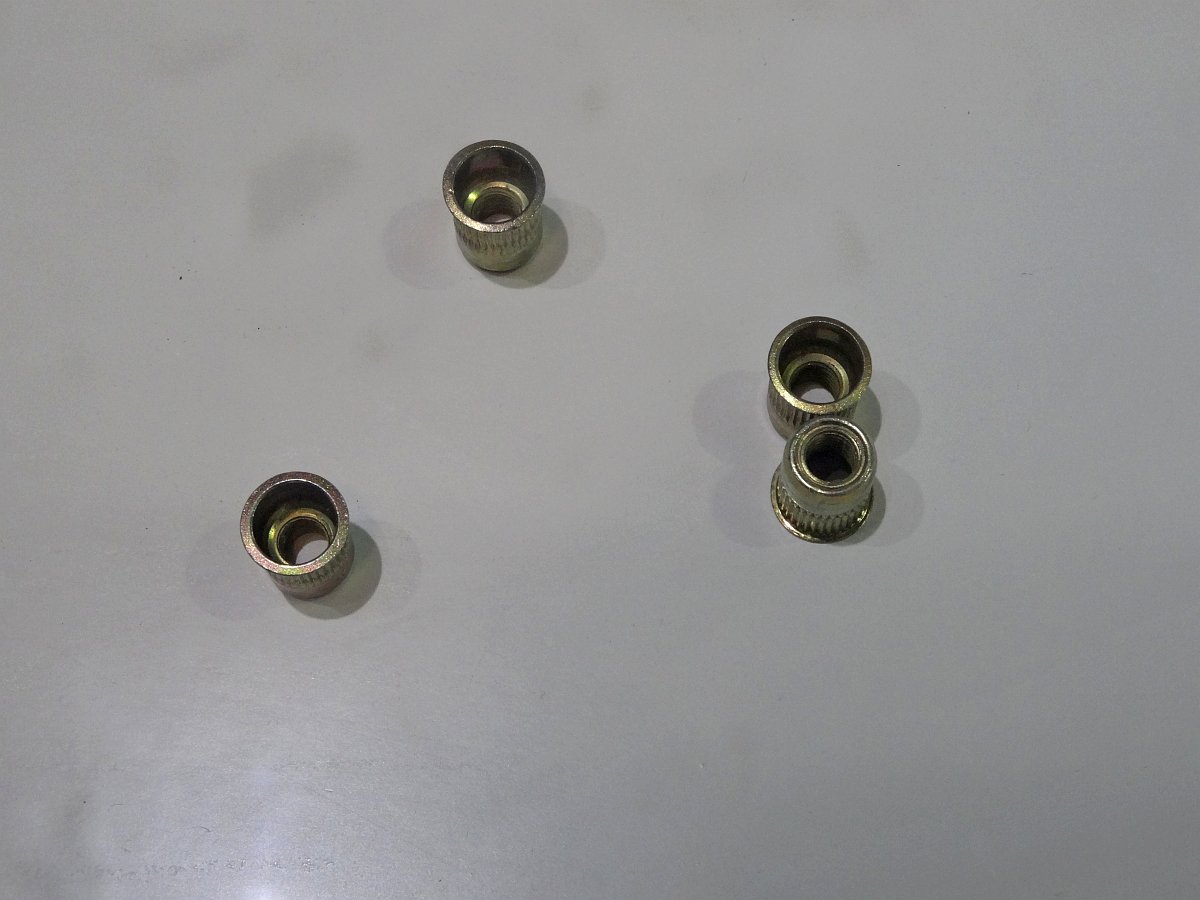
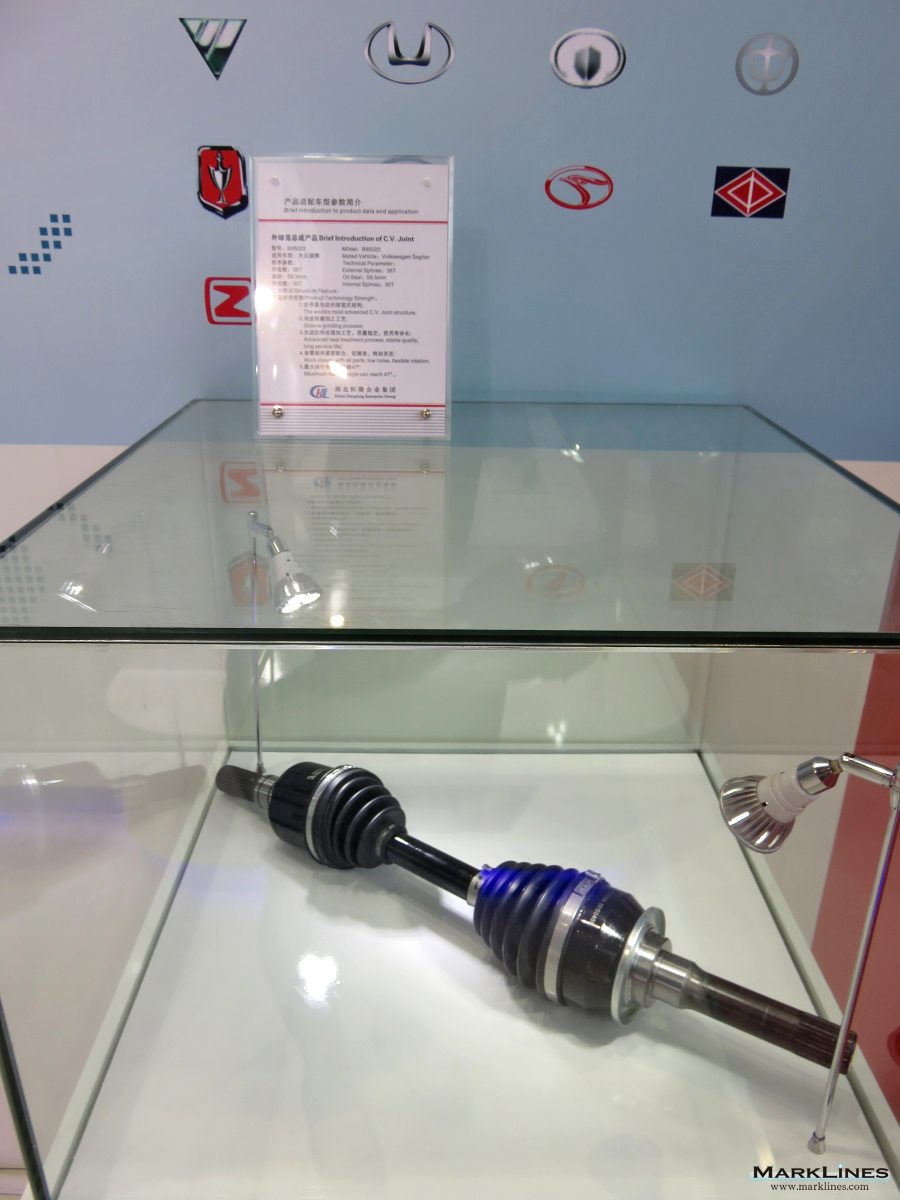
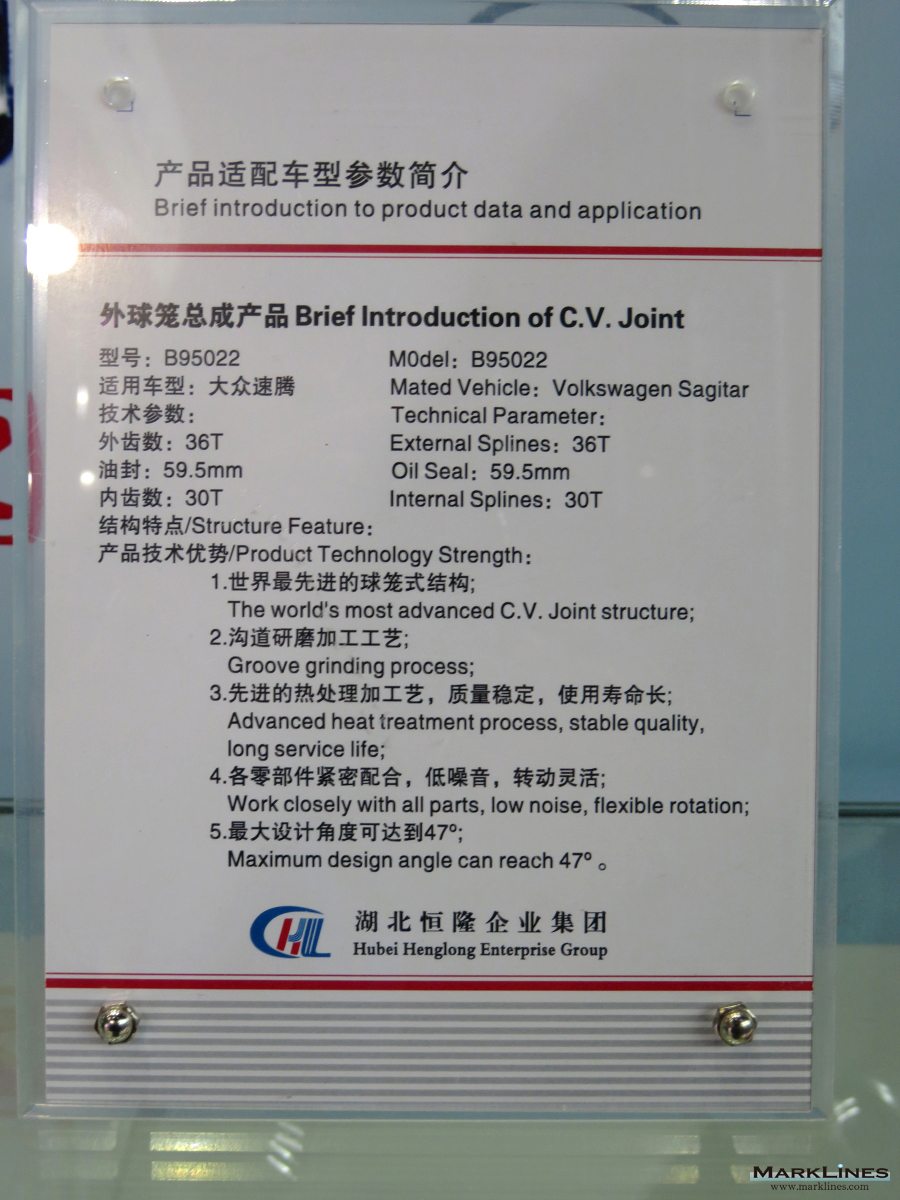
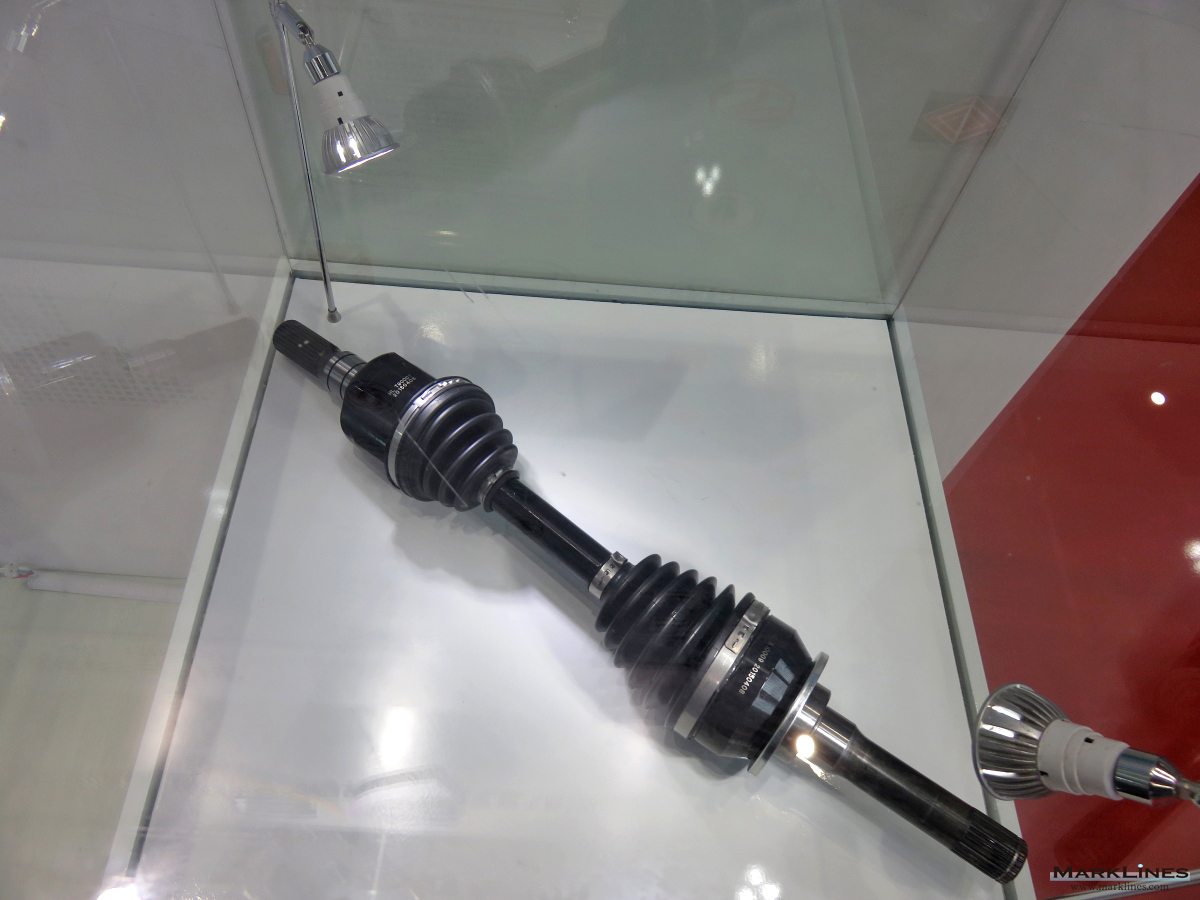
Hubei Henglong Automotive System Group Co., Ltd. Constant velocity joint
Sort by :
1 - 10 of 10 results
China - New car sales in 2026 by OEM, model, vehicle type
FCV 0.01 0.01 -13.6 Total 104.1 100.0 2.5 Source:CAAM, Each maker's press releasesChina - Top 10 best selling models - Maker/Brand Model Jan. 2026 Jan. 2025 Y-o-Y 1 Geely Geely Xingyuan 41,676 28,147 48.1% 2 Tesla Model Y 38,916 32,233 20.7% 3 Xiaomi Xiaomi YU7 37,869 - -% 4 VW Sagitar 31,303 28,326 10.5% 5 Tesla Model 3 30,213 31,005 -2.6% 6 Geely Bo Yue L 29,694 15,704 89.1% 7 Nissan Bluebird Sylphy/Sylphy 25,953 28,1...
Automotive Sales Data Updated at: 2026/05/25
China - New car sales in 2025 by OEM, model, vehicle type
4 Geely Geely Xingyuan 44,007 20,038 119.6% 437,341 36,168 1109.2% 5 BYD Auto Qin PLUS 43,277 36,361 19.0% 332,252 402,521 -17.5% 6 BYD Auto Yuan UP 37,757 24,070 56.9% 240,050 133,633 79.6% 7 BYD Auto Sealion 06 35,081 - -% 134,665 - -% 8 Xiaomi Xiaomi YU7 33,729 - -% 114,584 - -% 9 VW Sagitar 31,326 24,435 28.2% 236,215 228,333 3.5% 10 Tesla Model 3 31,124 32,261 -3.5% 281,756 328,189 -14.1% Source: MarkLines Data Center *The b...
Automotive Sales Data Updated at: 2026/02/10
China - New car sales in 2024 by OEM, model, vehicle type
8% 3 BYD Auto Qin PLUS 40,038 39,100 2.4% 76,767 78,124 -1.7% 4 BYD Auto Seagull 34,830 - -% 84,769 - -% 5 Tesla Model 3 31,478 27,202 15.7% 85,169 75,340 13.0% 6 BYD Auto Song Pro 30,309 8,000 278.9% 58,815 36,563 60.9% 7 BYD Auto Chaser 05 28,964 3,911 640.6% 39,524 13,847 185.4% 8 VW Sagitar 25,653 18,571 38.1% 67,268 61,776 8.9% 9 Changan/Chana CS75 24,878 20,685 20.3% 65,915 52,934 24.5% 10 Chery Tiggo 7 22,588 18,734 20.6% 6...
Automotive Sales Data Updated at: 2025/07/02
China - Flash report, Automotive sales volume, 2023
% 4 BYD Auto Yuan PLUS 41,015 29,468 39.2% 412,202 202,058 104.0% 5 BYD Auto Dolphin 36,514 26,074 40.0% 367,419 205,417 78.9% 6 VW Lavida 42,203 33,887 24.5% 351,931 376,627 -6.6% 7 Tesla Model 3 31,981 20,046 59.5% 300,897 255,774 17.6% 8 BYD Auto Seagull 50,525 - -% 280,217 - -% 9 VW Sagitar 20,590 35,329 -41.7% 280,029 236,142 18.6% 10 Haval Haval H6 25,138 19,443 29.3% 273,274 288,083 -5.1% Source: MarkLines Data Center *The...
Automotive Sales Data Updated at: 2025/06/04
China - Flash report, Automotive sales volume, 2022
2 Jan.- Jun. 2021 Y-o-Y 1 Tesla Model Y 52,557 11,623 352.2% 179,039 46,180 287.7% 2 Wuling Wuling Hongguang MINIEV 46,249 30,100 53.7% 214,188 182,767 17.2% 3 Toyota Corolla/New Corolla 39,235 33,987 15.4% 120,254 184,605 -34.9% 4 VW Lavida 32,131 18,446 74.2% 162,762 180,987 -10.1% 5 VW Sagitar 26,980 7,225 273.4% 114,883 130,814 -12.2% 6 Honda CR-V 26,687 16,311 63.6% 119,575 127,250 -6.0% 7 BYD Auto Song DM 26,517 5,450 386.6% 1...
Automotive Sales Data Updated at: 2025/06/04
China - Flash report, Automotive sales volume, 2021
39,128 23,762 64.7% 325,164 66,260 390.7% 2 Wuling Wuling Hongguang 37,943 31,372 20.9% 181,887 188,910 -3.7% 3 VW Lavida 34,823 40,984 -15.0% 308,577 332,677 -7.2% 4 Tesla Model 3 28,853 12,143 137.6% 216,558 75,981 185.0% 5 Haval Haval H6 27,341 52,734 -48.2% 295,208 266,231 10.9% 6 VW Sagitar 27,180 36,380 -25.3% 190,916 238,334 -19.9% 7 Toyota Camry 26,121 16,607 57.3% 164,228 148,484 10.6% 8 Tesla Model Y 25,538 - -% 132,814 -...
Automotive Sales Data Updated at: 2025/06/04
China - Flash report, Sales volume, 2020
019 Y-o-Y Jan.- Dec. 2020 Jan.- Dec. 2019 Y-o-Y 1 VW Lavida 36,369 62,644 -41.9% 417,324 517,192 -19.3% 2 Haval Haval H6 55,632 41,706 33.4% 376,864 386,405 -2.5% 3 Toyota Corolla/New Corolla 32,826 32,505 1.0% 350,310 357,798 -2.1% 4 VW Bora 30,799 31,295 -1.6% 332,386 334,668 -0.7% 5 VW Sagitar 27,295 31,789 -14.1% 299,839 307,323 -2.4% 6 Buick Excelle GT 42,233 26,083 61.9% 295,857 279,280 5.9% 7 Nissan Bluebird Sylphy/Sylphy 28,...
Automotive Sales Data Updated at: 2025/06/04
China - Flash report, Sales volume, 2019
10.3% 2 Haval Haval H6 41,706 50,303 -17.1% 386,405 452,552 -14.6% 3 Wuling Wuling Hongguang 53,336 59,673 -10.6% 374,878 476,537 -21.3% 4 Toyota Corolla/New Corolla 32,505 27,755 17.1% 357,798 376,077 -4.9% 5 Nissan Bluebird Sylphy/Sylphy 26,950 56,339 -52.2% 346,551 481,216 -28.0% 6 VW Sagitar 31,789 22,455 41.6% 307,323 309,902 -0.8% 7 Buick Excelle GT 26,083 18,531 40.8% 279,280 261,920 6.6% 8 VW New Bora (Model X) 31,274 2,469...
Automotive Sales Data Updated at: 2020/05/12
China - Flash report, Sales volume, 2018
320 44,703 -9.8% 468,792 457,114 2.6% 4 Haval Haval H6 50,303 55,126 -8.7% 452,552 506,362 -10.6% 5 Toyota Corolla/New Corolla 27,755 19,406 43.0% 376,077 336,018 11.9% 6 Baojun Baojun 510 28,523 54,050 -47.2% 361,403 363,949 -0.7% 7 VW Jetta 36,710 13,964 162.9% 327,686 325,978 0.5% 8 VW Sagitar 22,455 29,946 -25.0% 309,902 332,733 -6.9% 9 VW Tiguan 28,281 29,584 -4.4% 303,374 332,402 -8.7% 10 Geely Bo Yue 30,294 31,205 -2.9% 279,0...
Automotive Sales Data Updated at: 2019/01/31
China - Flash report, Sales volume, 2017
31,726 29.0% 416,990 370,372 12.6% 5 Nissan Bluebird Sylphy/Sylphy 44,141 43,831 0.7% 405,854 367,979 10.3% 6 Baojun Baojun 510 54,050 0 -% 363,949 0 -% 7 GAC Trumpchi GS4 22,628 26,480 -14.5% 337,330 333,280 1.2% 8 Toyota Corolla/New Corolla 19,406 29,698 -34.7% 336,018 324,052 3.7% 9 VW Sagitar 29,946 25,147 19.1% 332,733 341,333 -2.5% 10 VW Tiguan 29,584 26,610 11.2% 332,402 242,160 37.3% Source: MarkLines Data Center *The bel...
Automotive Sales Data Updated at: 2018/07/24


 Japan
Japan USA
USA Mexico
 Germany
 China (Shanghai)
 Thailand
 India
India