


Search Results by Category
All information related to {{ key_word }}.
AI Navigator will guide you. Click here for information about {{ key_word }}.
Images
 3
3
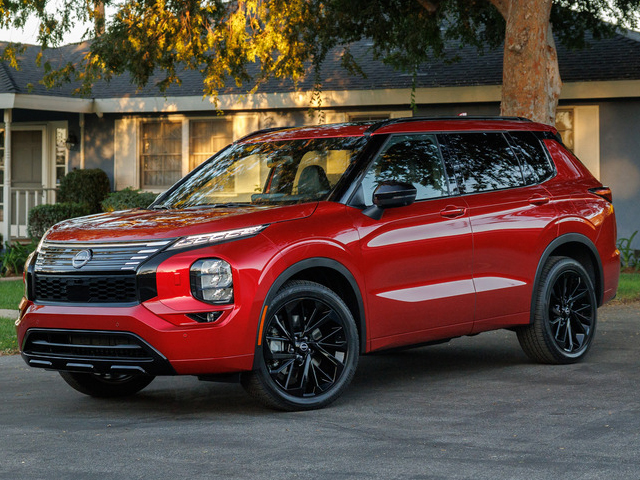
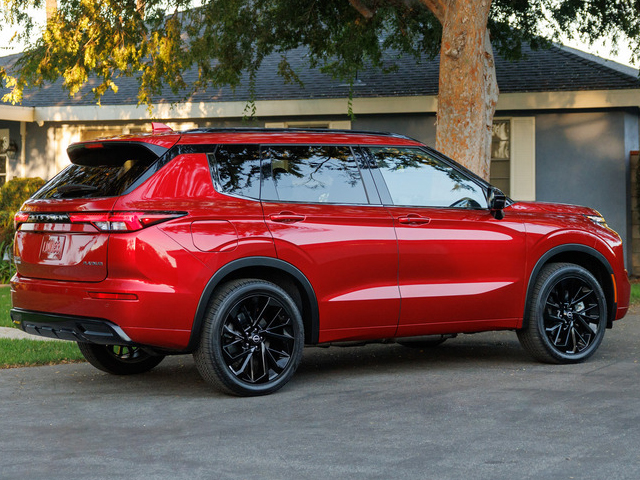
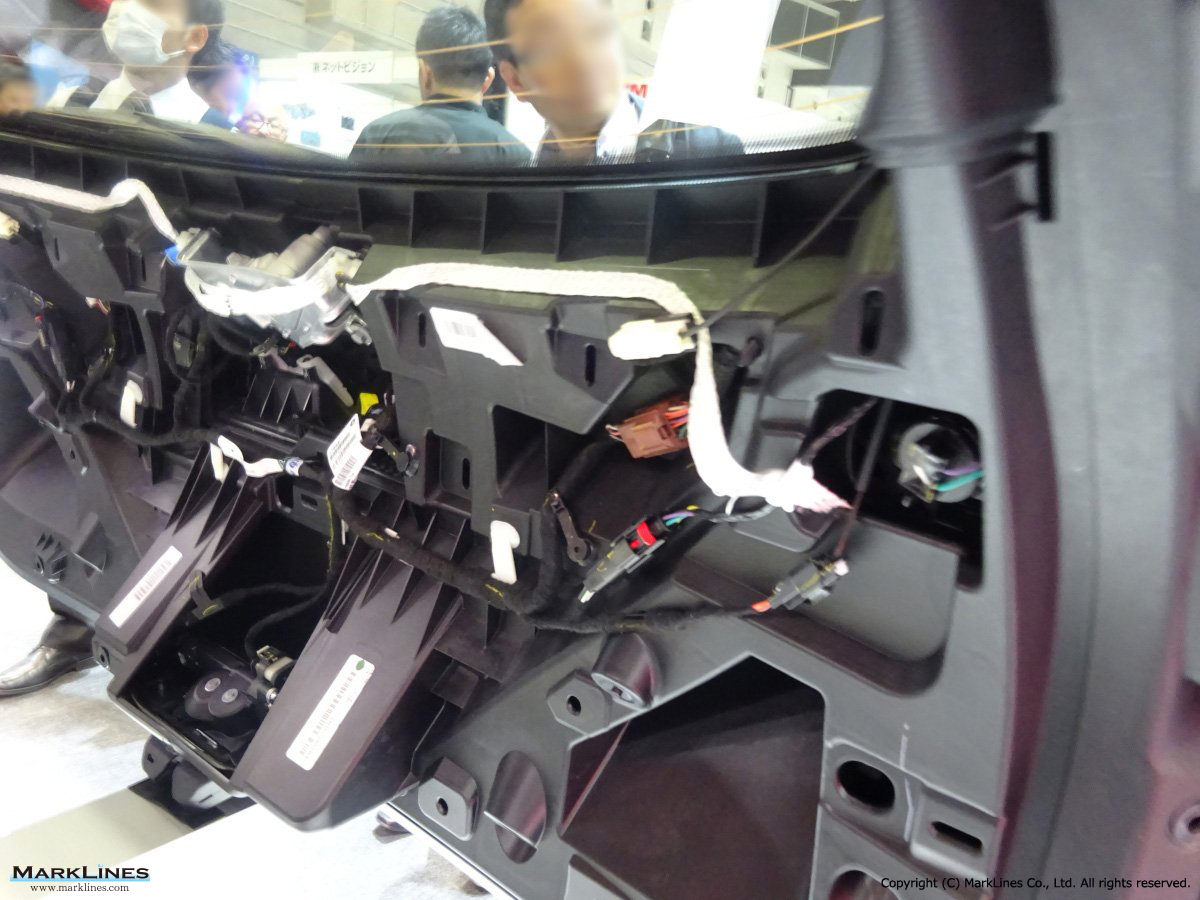
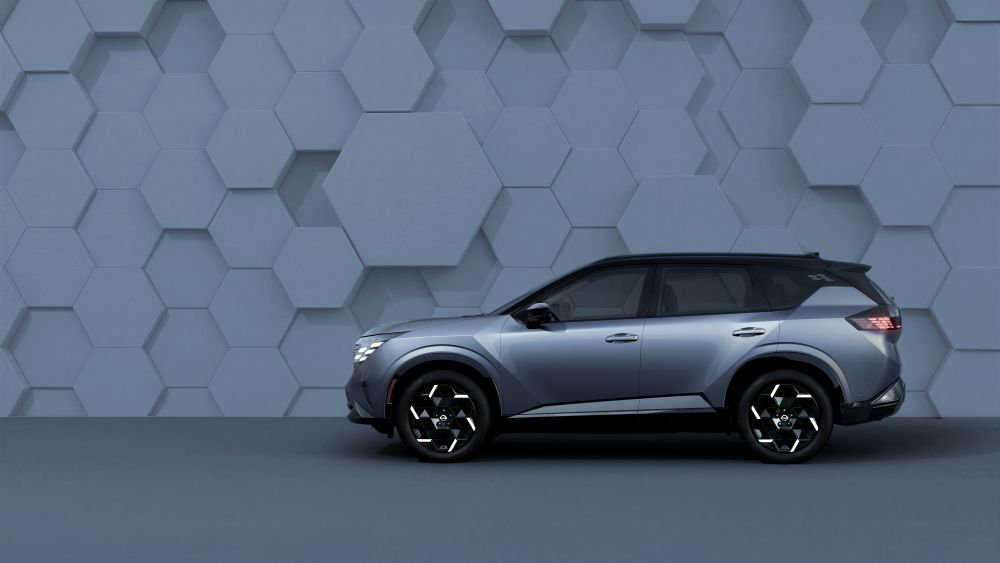
Rogue Plug-in Hybrid
 3
3
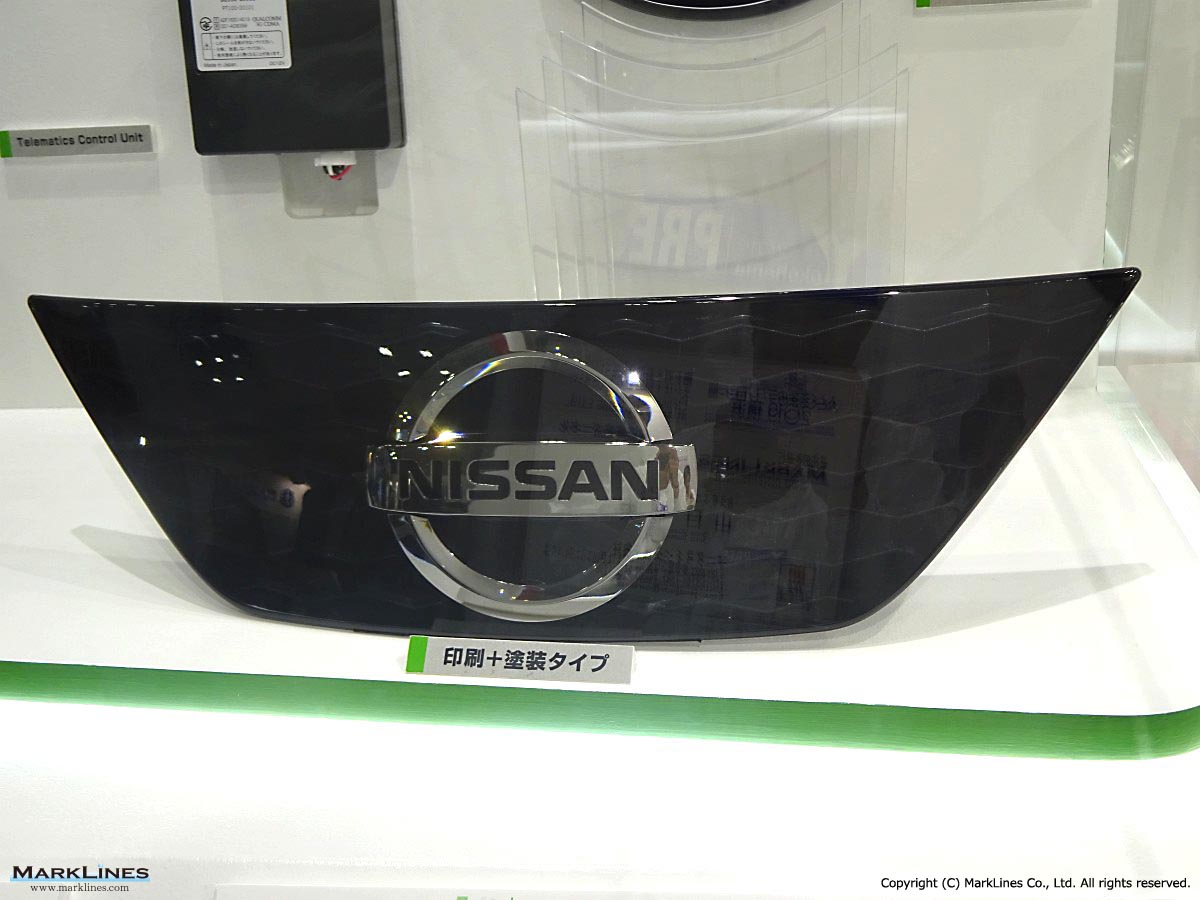
Milliwave Radar Cover "RADOME"
 4
4
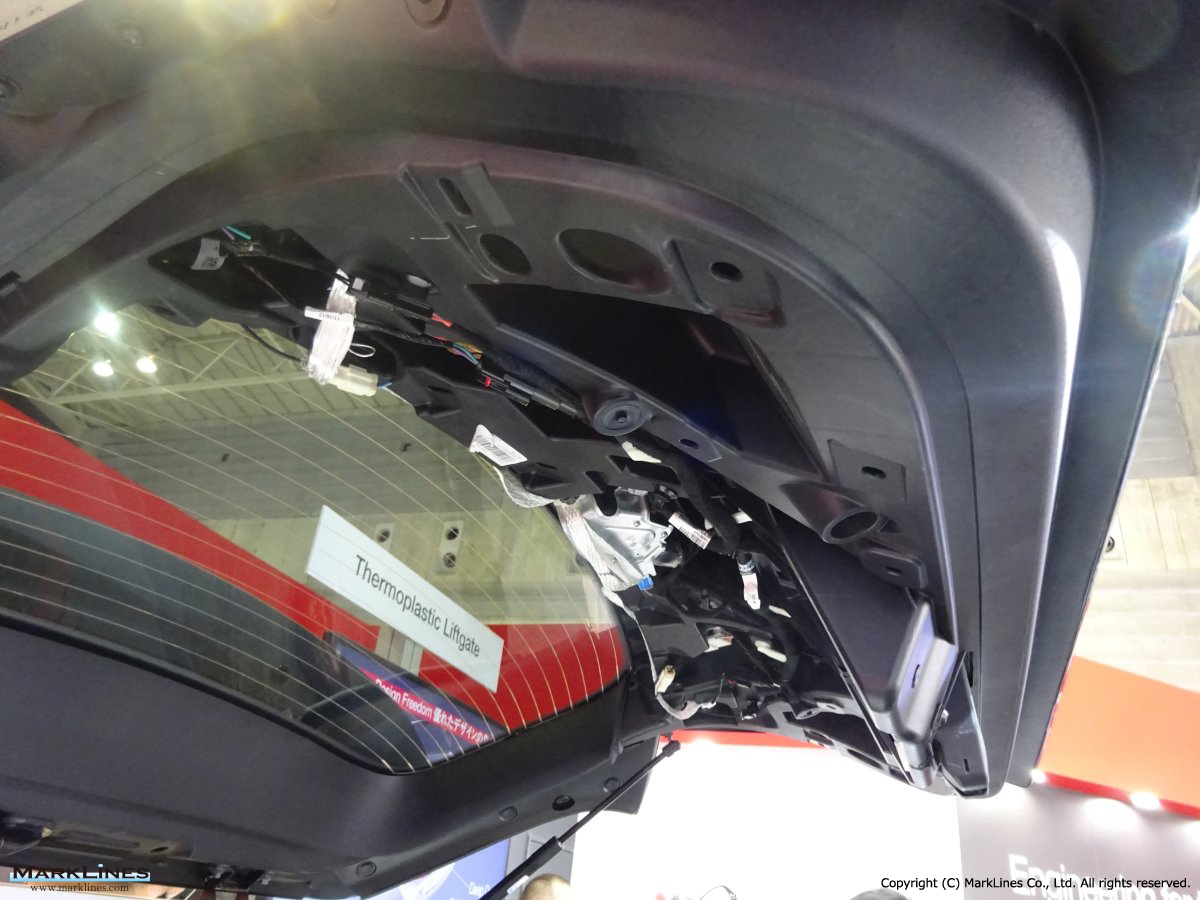
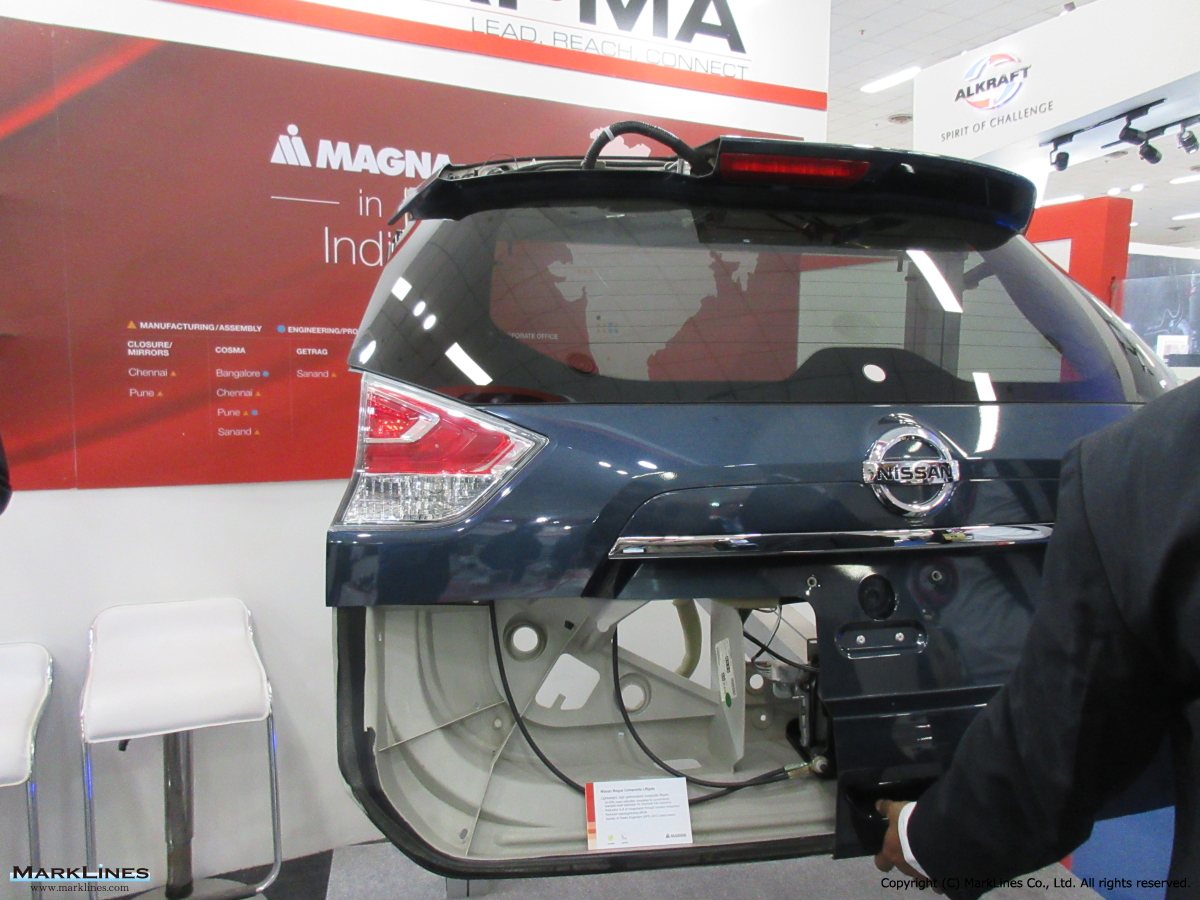
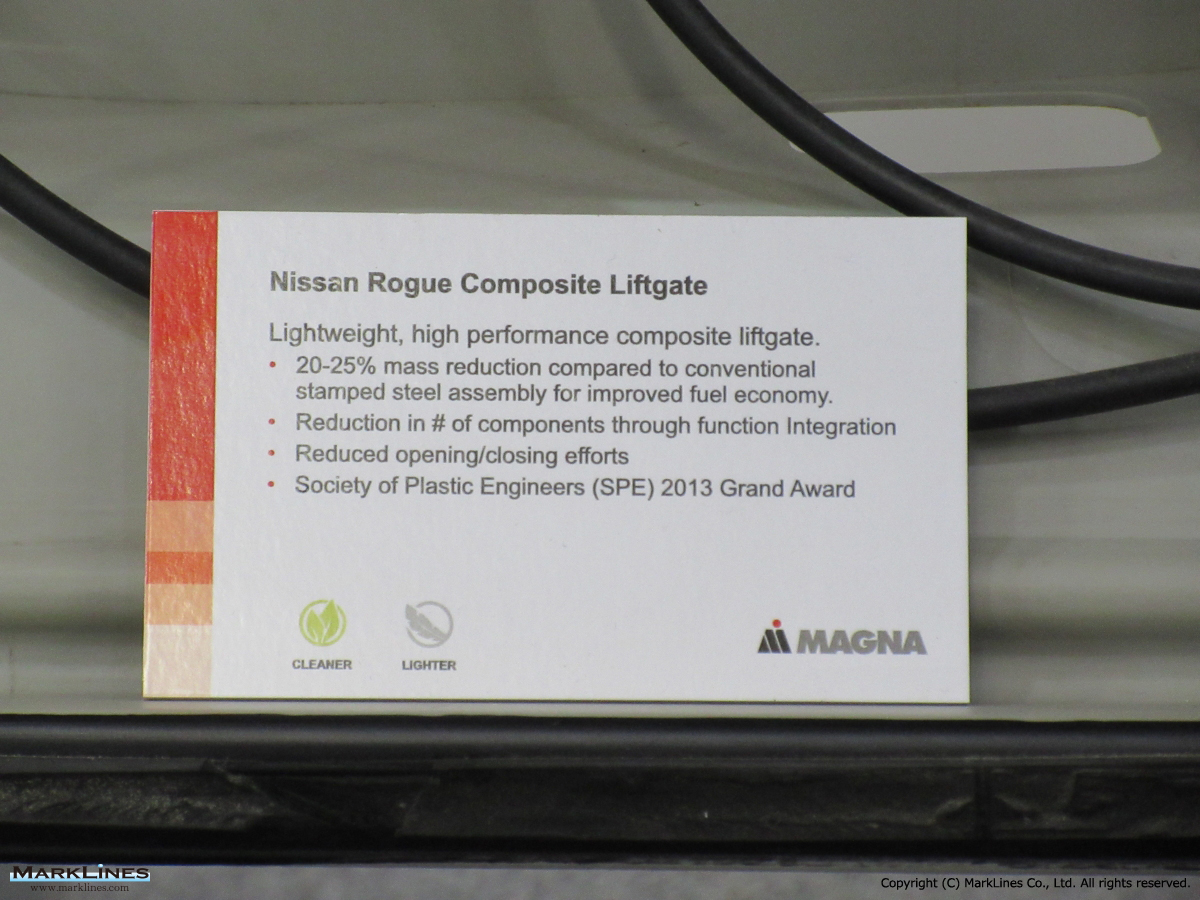
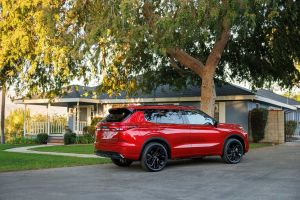
Thermoplastic Liftgate
 2
2
Lift Gate
 1
1
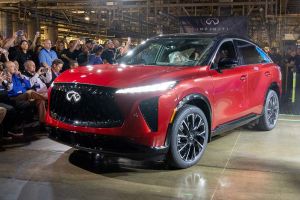
INFINITI QX65 production begins in Smyrna, Tennessee
 9
9
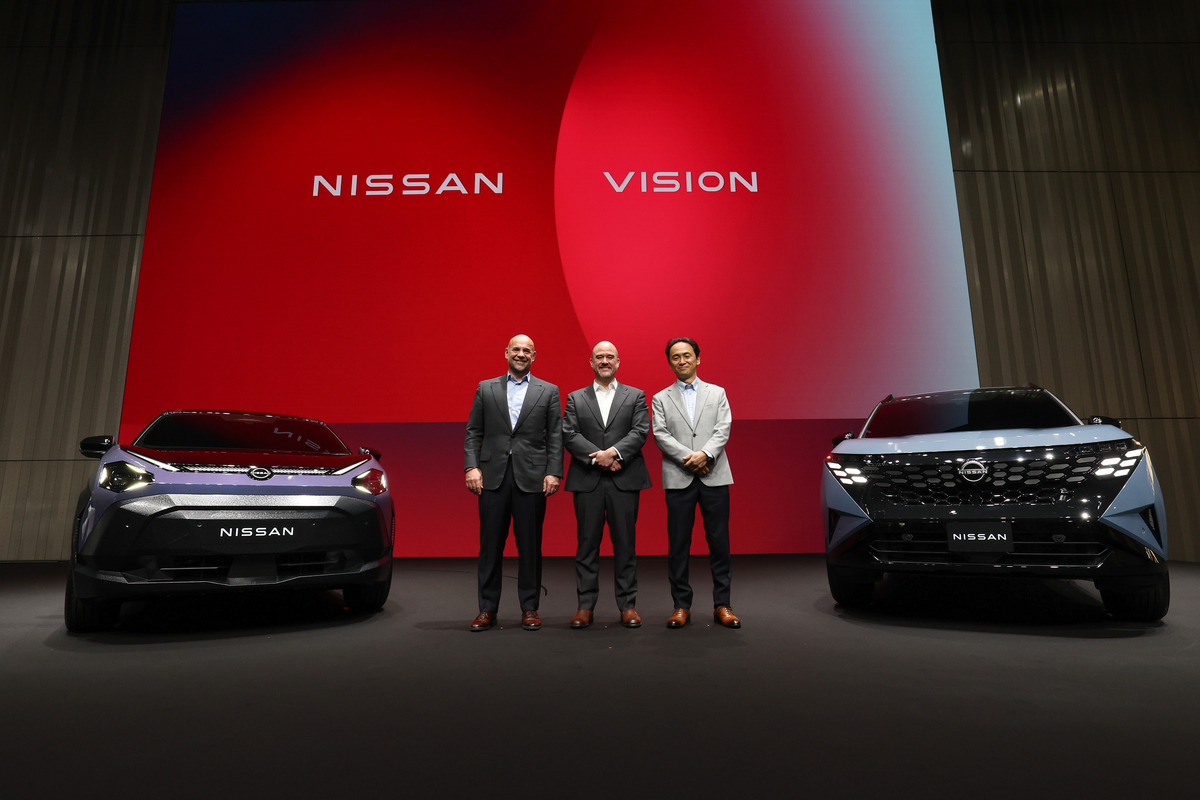
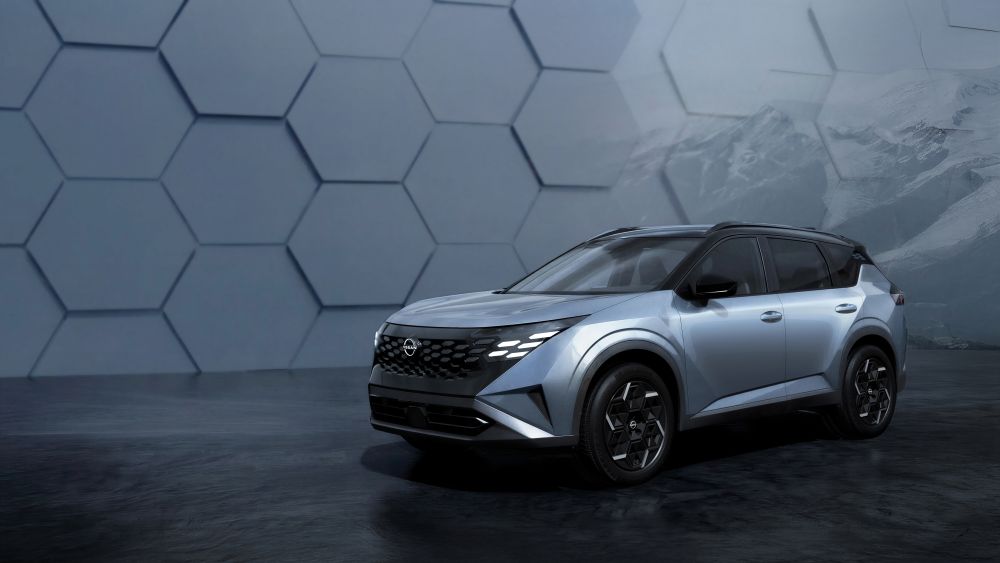
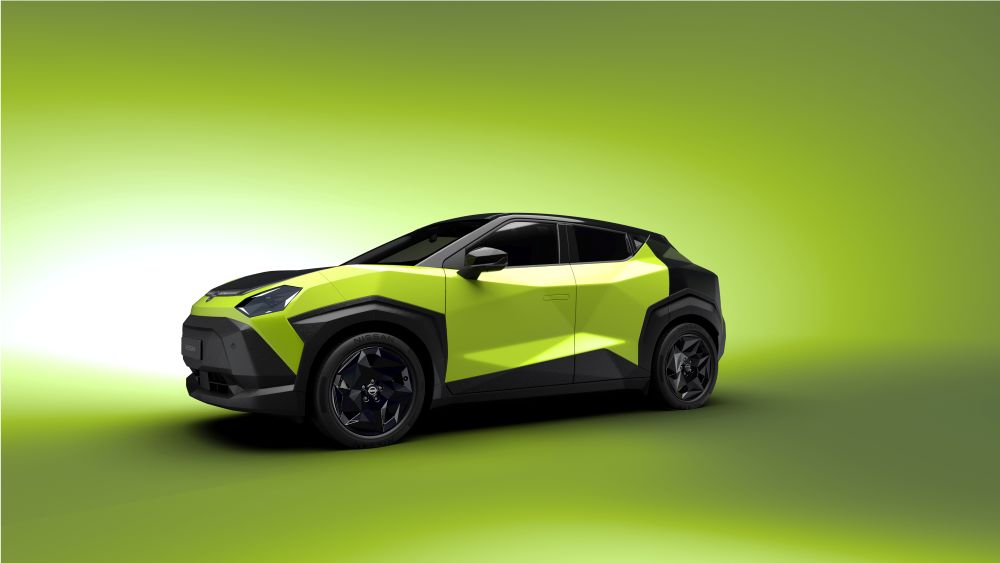
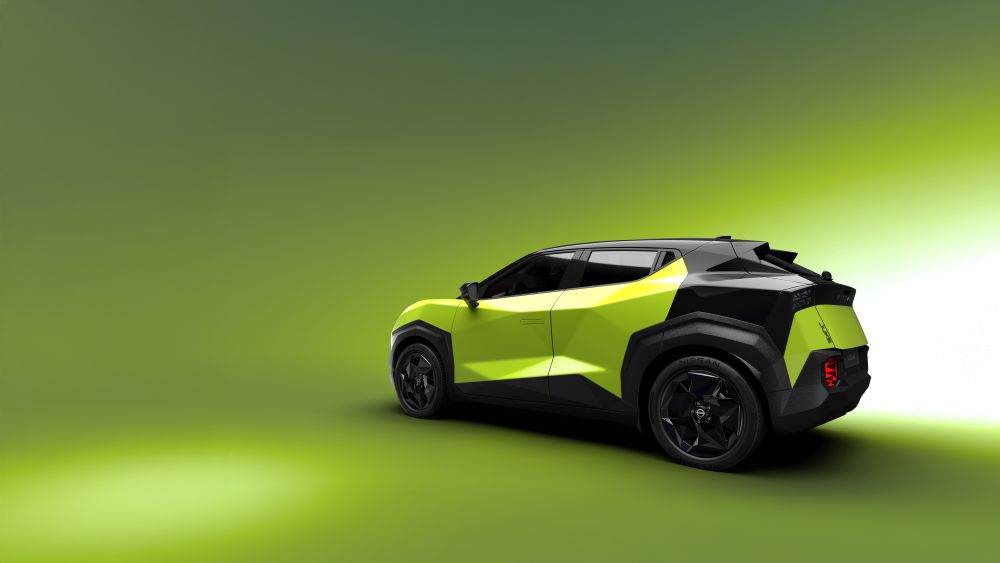
Nissan sets long-term direction, reveals X-Trail and Rogue Hybrid e-Power and Juke EV
 1
1
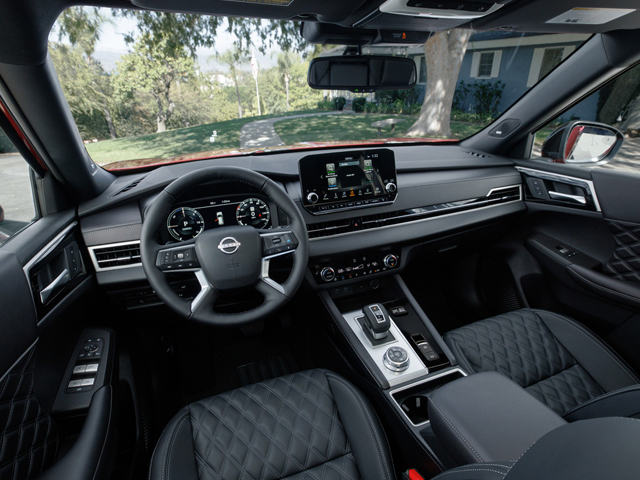
Nissan announces new premium seating material for its North American cars
 4
4
Nissan launches 2026 Rogue PHEV in U.S.
 1
1
Nissan’s industry-first Personalized Sound app available in U.S.
 8
8
Nissan readies 3-row Rogue PHEV for early 2026 launch in U.S.
Sort by :
1 - 20 of 24 results
USA - New car sales in 2026 by OEM, model, vehicle type
ota Camry 30,680 29,661 3.4% 78,255 70,308 11.3% 6 Tesla Model Y 28,340 22,840 24.1% 78,590 64,040 22.7% 7 GMC GMC Sierra 27,631 31,963 -13.6% 75,607 78,541 -3.7% 8 Chevrolet Equinox 26,898 37,669 -28.6% 70,987 81,331 -12.7% 9 Toyota Tacoma 24,998 23,949 4.4% 69,263 59,825 15.8% 10 Nissan Rogue 24,326 24,825 -2.0% 70,174 62,102 13.0% Source: MarkLines Data Center Flash report, February 2026 Mar 4, 2026 U.S. auto sales fall 2.6% in ...
Automotive Sales Data Updated at: 2026/06/03
USA - New car sales in 2025 by OEM, model, vehicle type
inox 37,670 20,372 84.9% 81,334 54,185 50.1% 6 GMC GMC Sierra 31,956 28,100 13.7% 78,536 68,597 14.5% 7 Toyota Camry 29,660 30,078 -1.4% 70,302 78,337 -10.3% 8 Ram (2021-) Ram P/U 29,303 32,577 -10.1% 76,828 89,417 -14.1% 9 Tesla Model Y 28,000 34,300 -18.4% 78,500 89,100 -11.9% 10 Nissan Rogue 24,823 38,711 -35.9% 62,111 90,804 -31.6% Source: MarkLines Data Center Flash report, February 2025 Mar 4, 2025 U.S. auto sales down 2.3%...
Automotive Sales Data Updated at: 2026/02/04
Korea - New car sales in 2025 by OEM
.5% Total 1,366,344 100.0% 1,356,706 100.0% 0.7% 6,562,739 6,584,353 -0.3% 7,929,083 7,941,059 -0.2% Source: Releases by each companies *1: Share is based on MarkLines' own calculation. (calculated from total sales of five Korean makers) *2: Exclude sales volume of Cadillac *3: Includes Nissan RogueRegistrations of new imported passenger cars Maker/Brand 2025 2024 Y-o-Y 2025 2024 Y-o-Y Dec. Share Dec. Share Jan.-Dec. Share Jan.-Dec. Sha...
Automotive Sales Data Updated at: 2026/02/02
USA - New car sales in 2024 by OEM, model, vehicle type
R-V 39,421 36,297 8.6% 402,808 361,457 11.4% 5 Tesla Model Y 35,500 34,281 3.6% 379,700 384,288 -1.2% 6 Ram (2021-) Ram P/U 36,945 43,224 -14.5% 373,120 444,926 -16.1% 7 GMC GMC Sierra 35,089 27,826 26.1% 324,720 295,737 9.8% 8 Toyota Camry 26,811 25,405 5.5% 309,876 291,991 6.1% 9 Nissan Rogue 18,901 22,317 -15.3% 245,737 271,458 -9.5% 10 Honda Civic 18,694 19,435 -3.8% 242,025 200,381 20.8% Source: MarkLines Data Center Flas...
Automotive Sales Data Updated at: 2025/07/03
Korea - New car sales in 2024 by OEM
.7% Total 1,356,706 100.0% 1,449,885 100.0% -6.4% 6,584,378 6,537,123 0.7% 7,941,084 7,987,008 -0.6% Source: Releases by each companies *1: Share is based on MarkLines' own calculation. (calculated from total sales of five Korean makers) *2: Exclude sales volume of Cadillac *3: Includes Nissan Rogue Registrations of new imported passenger cars Maker/Brand 2024 2023 Y-o-Y 2024 2023 Y-o-Y Dec. Share Dec. Share Jan.-Dec. Share Jan.-Dec. S...
Automotive Sales Data Updated at: 2025/07/02
Korea - Flash report, Automotive sales volume, 2023
38.5% Total 1,449,885 100.0% 1,386,230 100.0% 4.6% 6,535,601 6,003,033 8.9% 7,985,486 7,389,263 8.1% Source: Releases by each companies *1: Share is based on MarkLines' own calculation. (calculated from total sales of five Korean makers) *2: Exclude sales volume of Cadillac *3: Includes Nissan Rogue Registrations of new imported passenger cars Maker/Brand 2023 2022 Y-o-Y 2023 2022 Y-o-Y Dec. Share Dec. Share Jan.-Dec. Share Jan.-Dec. S...
Automotive Sales Data Updated at: 2025/06/04
USA - Flash report, Automotive sales volume, 2023
oyota RAV4 47,705 33,149 43.9% 434,658 399,949 8.7% 5 Tesla Model Y 34,281 20,423 67.9% 385,588 247,344 55.9% 6 Honda CR-V 36,297 19,285 88.2% 361,457 238,155 51.8% 7 GMC GMC Sierra 27,826 30,013 -7.3% 295,737 241,522 22.4% 8 Toyota Camry 24,569 26,308 -6.6% 291,155 294,617 -1.2% 9 Nissan Rogue 22,317 19,739 13.1% 271,458 186,480 45.6% 10 Jeep (2021-) Grand Cherokee (Jeep (2009-)) 29,238 20,813 40.5% 244,594 223,345 9.5% Source: Ma...
Automotive Sales Data Updated at: 2025/06/04
USA - Flash report, Automotive sales volume, 2022
1. Ford F-Series (down 17.4% from October 2021) 2. Chevrolet Silverado (up 31.7%) 3. Toyota RAV4 (up 35.3%) 4. Ram pickups (down 21.7%) 5. Toyota Camry (up 68.0%) 6. GMC Sierra (up 17.7%) 7. Toyota Tacoma (up 48.7%) 8. Honda CR-V (down 19.2% 9. Tesla Model Y (up 16.1%) 10. Nissan Rogue (up 25.2%)Sales of new vehicles by type (Sales figures of Toyota and Volvo have been updated. November 4, 2022) Type 2022 2021 Y-o-Y 2022...
Automotive Sales Data Updated at: 2025/06/04
Korea - Flash report, Automotive sales volume, 2022
1.7% Total 1,388,476 100.0% 1,433,605 100.0% -3.1% 6,008,198 5,687,789 5.6% 7,396,674 7,121,394 3.9% Source: Releases by each companies *1: Share is based on MarkLines' own calculation. (calculated from total sales of five Korean makers) *2: Exclude sales volume of Cadillac *3: Includes Nissan Rogue Registrations of new imported passenger cars Maker/Brand 2022 2021 Y-o-Y 2022 2021 Y-o-Y Dec. Share Dec. Share Jan.-Dec. Share Jan.-Dec. S...
Automotive Sales Data Updated at: 2025/06/04
USA - Flash report, Automotive sales volume, 2021
P/U 50,229 67,085 -25.1% 569,388 563,676 1.0% 3 Chevrolet Silverado 39,685 68,512 -42.1% 519,774 586,675 -11.4% 4 Toyota RAV4 34,150 46,452 -26.5% 407,739 430,387 -5.3% 5 Honda CR-V 25,056 38,120 -34.3% 361,271 333,502 8.3% 6 Toyota Camry 21,068 29,613 -28.9% 313,795 294,348 6.6% 7 Nissan Rogue 21,197 26,378 -19.6% 285,602 227,935 25.3% 8 Jeep (2021-) Grand Cherokee (Jeep (2009-)) 26,432 23,215 13.9% 264,444 209,786 26.1% 9 Toyota H...
Automotive Sales Data Updated at: 2025/06/04
Korea - Flash report, Automotive sales volume, 2021
.7% Total 1,433,605 100.0% 1,607,035 100.0% -10.8% 5,688,741 5,336,569 6.6% 7,122,346 6,943,604 2.6% Source: Releases by each companies *1: Share is based on MarkLines' own calculation. (calculated from total sales of five Korean makers) *2: Exclude sales volume of Cadillac *3: Includes Nissan Rogue Registrations of new imported passenger cars Maker/Brand 2021 2020 Y-o-Y 2021 2020 Y-o-Y Dec. Share Dec. Share Jan.-Dec. Share Jan.-Dec. Sh...
Automotive Sales Data Updated at: 2025/06/04
USA - Flash report, Sales volume, 2020
ver sales fell 18.0% from last July, while Volvo sales increased 10.3%, making this the company’s best July since 2006.The top 10 best-selling models in July, in order, were Ford F-Series pickups, Ram pickups, Chevrolet Silverado pickups, Toyota RAV4, Honda CR-V, Honda Civic, Toyota Camry, Nissan Rogue, Chevrolet Equinox, and GMC Sierra pickups.Sales of new vehicles by type Type 2020 2019 Y-o-Y 2020 2019 Y-o-Y Jul. Jul. Jan.-Jul. Jan.-Jul...
Automotive Sales Data Updated at: 2025/06/04
Korea - Flash report, Sales volume, 2020
% Total 1,607,035 100.0% 1,533,166 100.0% 4.8% 5,335,851 6,394,349 -16.6% 6,942,886 7,927,515 -12.4% Source: Releases by each companies *1: Share is based on MarkLines' own calculation. (calculated from total sales of five Korean makers) *2: Exclude sales volume of Cadillac *3: Includes Nissan Rogue Registrations of new imported passenger cars Maker/Brand 2020 2019 Y-o-Y 2020 2019 Y-o-Y Dec. Share Dec. Share Jan.-Dec. Share Jan.-Dec. S...
Automotive Sales Data Updated at: 2025/06/04
Korea - Flash report, Sales volume, 2019
9% Total 1,533,166 100.0% 1,545,604 100.0% -0.8% 6,390,082 6,689,552 -4.5% 7,923,248 8,235,156 -3.8% Source: Releases by each companies *1: Share is based on MarkLines' own calculation. (calculated from total sales of five Korean makers) *2: Exclude sales volume of Cadillac *3: Includes Nissan RogueRegistrations of new imported passenger cars Maker/Brand 2019 2018 Y-o-Y 2019 2018 Y-o-Y Dec. Share Dec. Share Jan.-Dec. Share Jan.-Dec. Sha...
Automotive Sales Data Updated at: 2020/02/07
USA - Flash report, Sales volume, 2019
F-Series 86,996 87,772 -0.9% 896,526 909,330 -1.4% 2 Ram Ram P/U 64,244 60,155 6.8% 633,694 536,980 18.0% 3 Chevrolet Silverado 58,248 66,872 -12.9% 570,639 585,106 -2.5% 4 Toyota RAV4 41,282 38,669 6.8% 448,068 427,168 4.9% 5 Honda CR-V 36,098 42,079 -14.2% 384,168 379,013 1.4% 6 Nissan Rogue 27,331 42,523 -35.7% 350,447 412,110 -15.0% 7 Chevrolet Equinox 37,071 37,578 -1.3% 346,048 332,284 4.1% 8 Toyota Camry 26,309 29,093 -9.6% ...
Automotive Sales Data Updated at: 2020/01/21
USA - Flash report, Sales volume, 2018
17 Y-o-Y Jan.-Dec. 2018 Jan.-Dec. 2017 Y-o-Y 1 Ford Ford F-Series 87,772 89,385 -1.8% 909,330 896,764 1.4% 2 Chevrolet Silverado 66,872 67,676 -1.2% 585,106 585,864 -0.1% 3 Ram Ram P/U 60,155 44,907 34.0% 536,980 500,723 7.2% 4 Toyota RAV4 38,669 32,542 18.8% 427,168 407,594 4.8% 5 Nissan Rogue 42,523 40,172 5.9% 412,110 403,465 2.1% 6 Honda CR-V 42,079 36,983 13.8% 379,013 377,895 0.3% 7 Toyota Camry 29,093 43,331 -32.9% 343,439 38...
Automotive Sales Data Updated at: 2019/01/28
Korea - Flash report, Sales volume, 2018
7.8% Total 1,545,604 100.0% 1,550,080 100.0% -0.3% 6,687,128 6,647,456 0.6% 8,232,732 8,197,536 0.4% Source: Releases by each companies *1: Share is based on MarkLines' own calculation. (calculated from total sales of five Korean makers) *2: Exclude sales volume of Cadillac *3: Includes Nissan Rogue Registrations of new imported passenger cars Maker/Brand 2018 2017 Y-o-Y 2018 2017 Y-o-Y Dec. Share Dec. Share Jan.-Dec. Share Jan.-Dec. Sh...
Automotive Sales Data Updated at: 2019/01/10
Korea - Flash report, Sales volume, 2017
,617 -18.7% Total 132,315 100.0% 164,852 100.0% -19.7% 587,387 700,595 -16.2% 719,702 865,447 -16.8% Source: Releases by each companies *1: Share is based on MarkLines' own calculation. (calculated from total sales of five Korean makers) *2: Exclude sales volume of Cadillac *3: Includes Nissan Rogue South Korea - Sales of domestic make (2017) Make Domestic Sales Overseas Sales Global Sales Total 2017 2016 Y-o-Y 2017Total 2016Total Y-o-...
Automotive Sales Data Updated at: 2018/07/24
USA - Flash report, Sales volume, 2017
16 Y-o-Y Jan.-Dec. 2017 Jan.-Dec. 2016 Y-o-Y 1 Ford Ford F-Series 89,385 87,512 2.1% 896,764 820,799 9.3% 2 Chevrolet Silverado 67,676 54,272 24.7% 585,864 574,876 1.9% 3 Ram Ram P/U 44,907 47,556 -5.6% 500,723 487,558 2.7% 4 Toyota RAV4 32,542 37,214 -12.6% 407,594 352,139 15.7% 5 Nissan Rogue 40,172 40,477 -0.8% 403,465 329,904 22.3% 6 Toyota Camry 43,331 33,412 29.7% 387,081 388,616 -0.4% 7 Honda CR-V 36,983 37,778 -2.1% 377,895 ...
Automotive Sales Data Updated at: 2018/07/24
Korea - Flash report, Sales volume, 2016
9% 750,596 751,038 -0.1% 915,448 926,301 -1.2% Source: Releases by each companies *1: Share is based on MarkLines' own calculation. (calculated from total sales of five Korean makers) *2: Exclude sales volume of Cadillac. Year-over-year is based on MarkLines' own calculation. *3: Includes Nissan RogueSouth Korea - Sales of domestic make (2016) Make Domestic Sales Overseas Sales Global Sales Total 2016 2015 Y-o-Y 2016Total 2015Total Y-o-Y ...
Automotive Sales Data Updated at: 2017/01/10


 Japan
Japan USA
USA Mexico
 Germany
 China (Shanghai)
 Thailand
 India
India