


Search Results by Category
All information related to {{ key_word }}.
AI Navigator will guide you. Click here for information about {{ key_word }}.
Images
 10
10
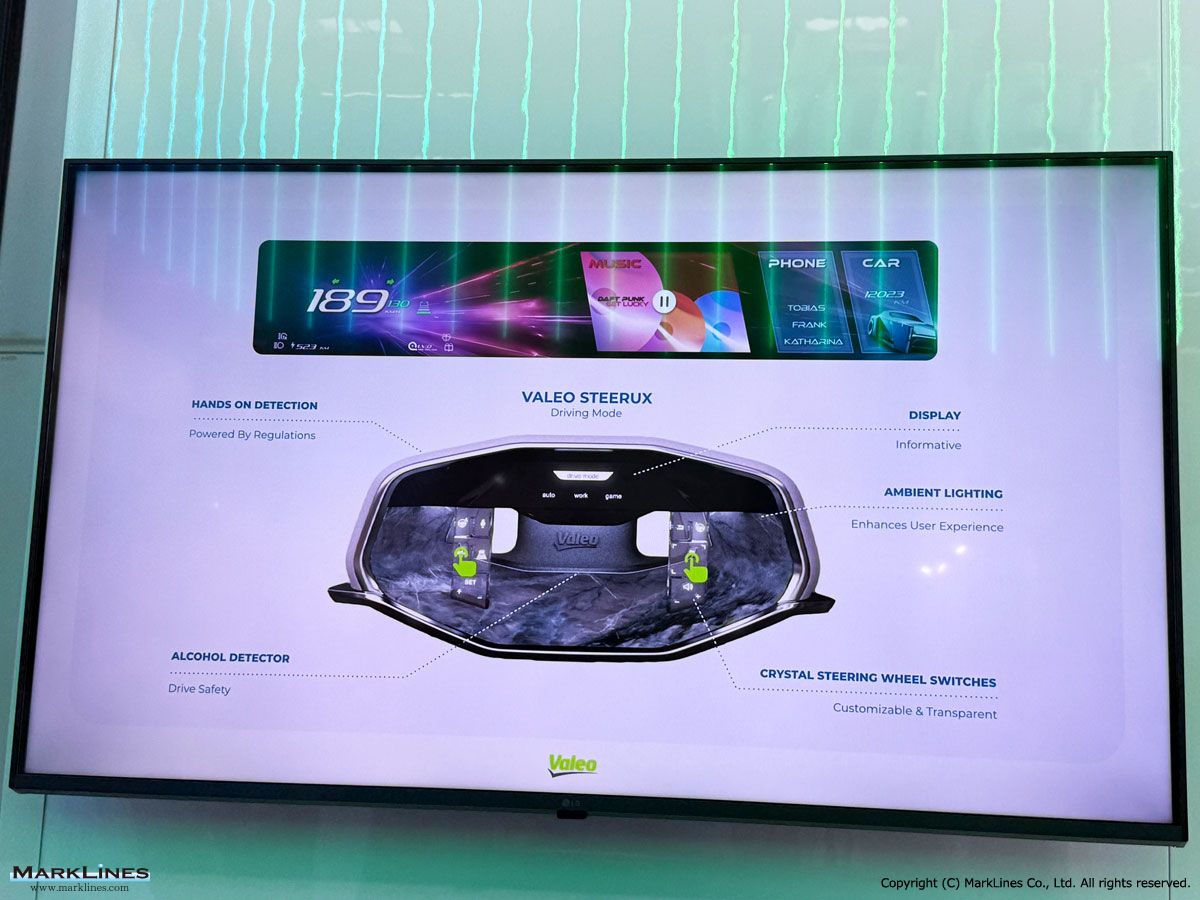
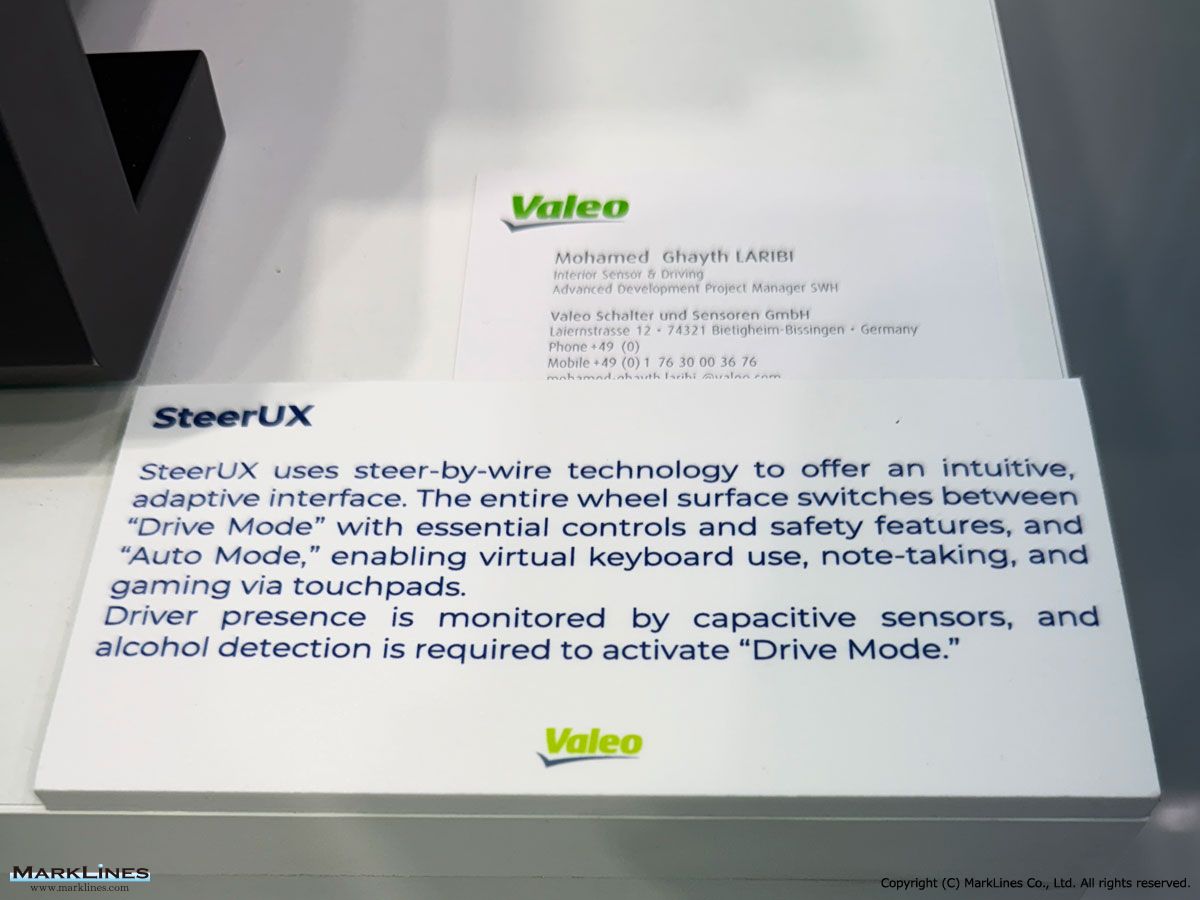
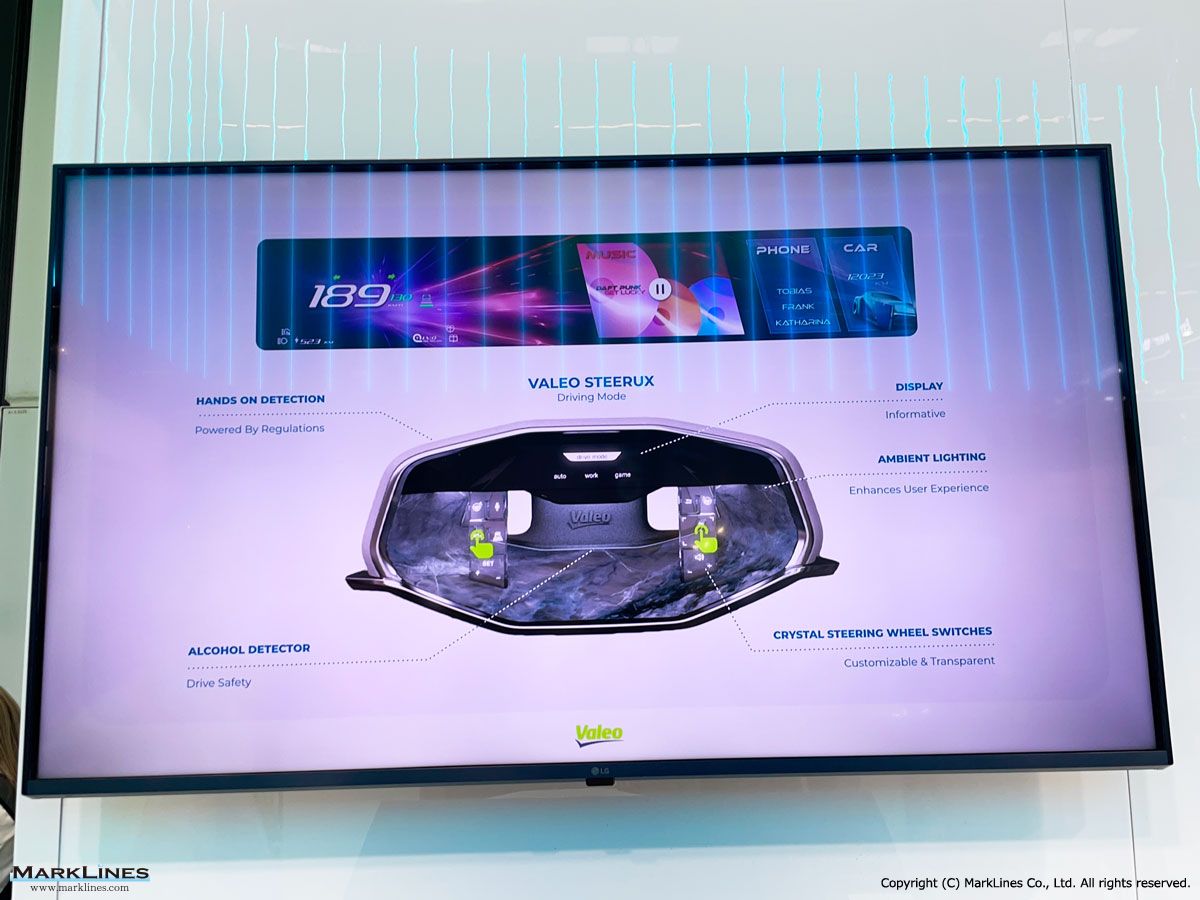
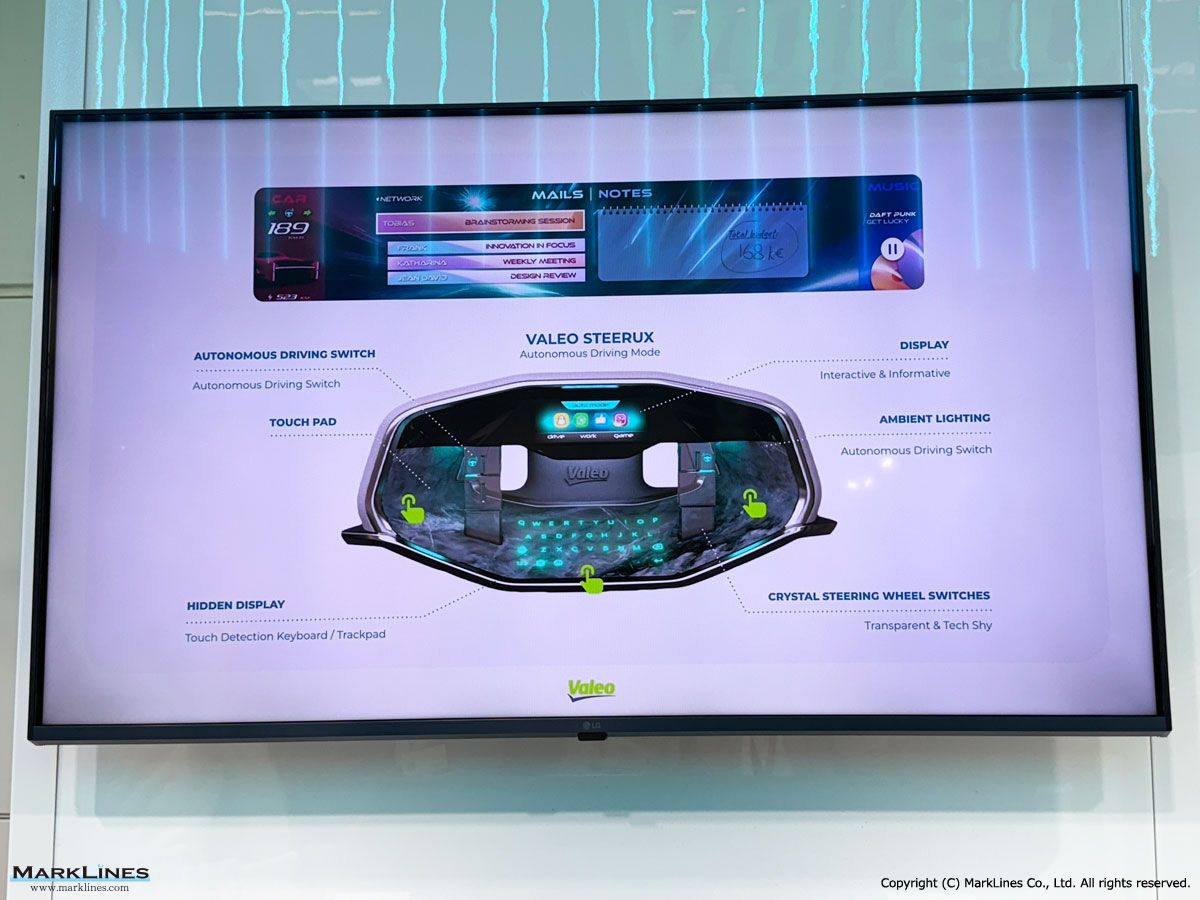
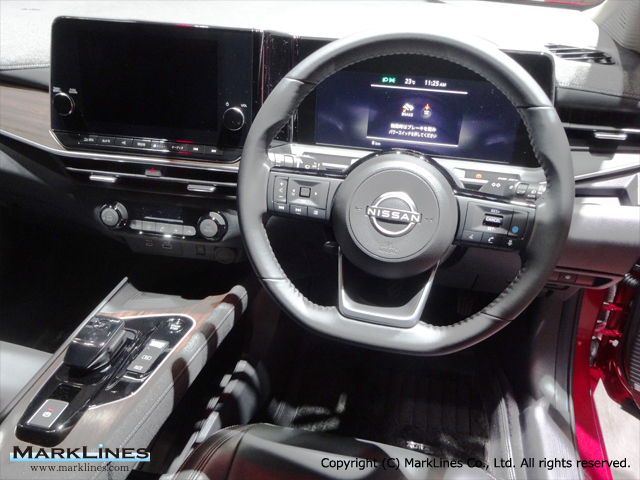
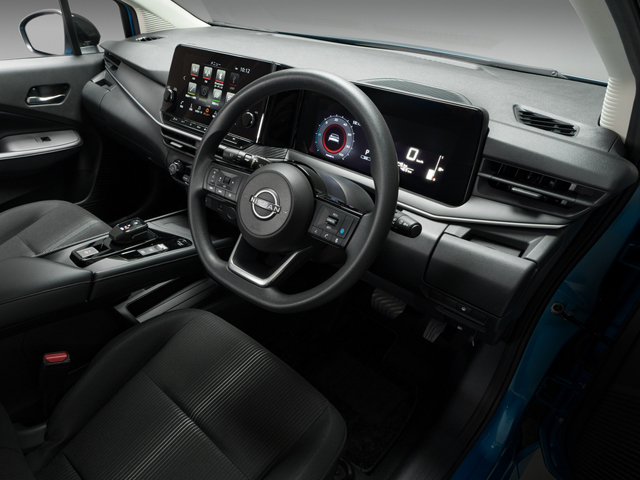
SteerUX (Next generation of steering wheel prototype)
 3
3
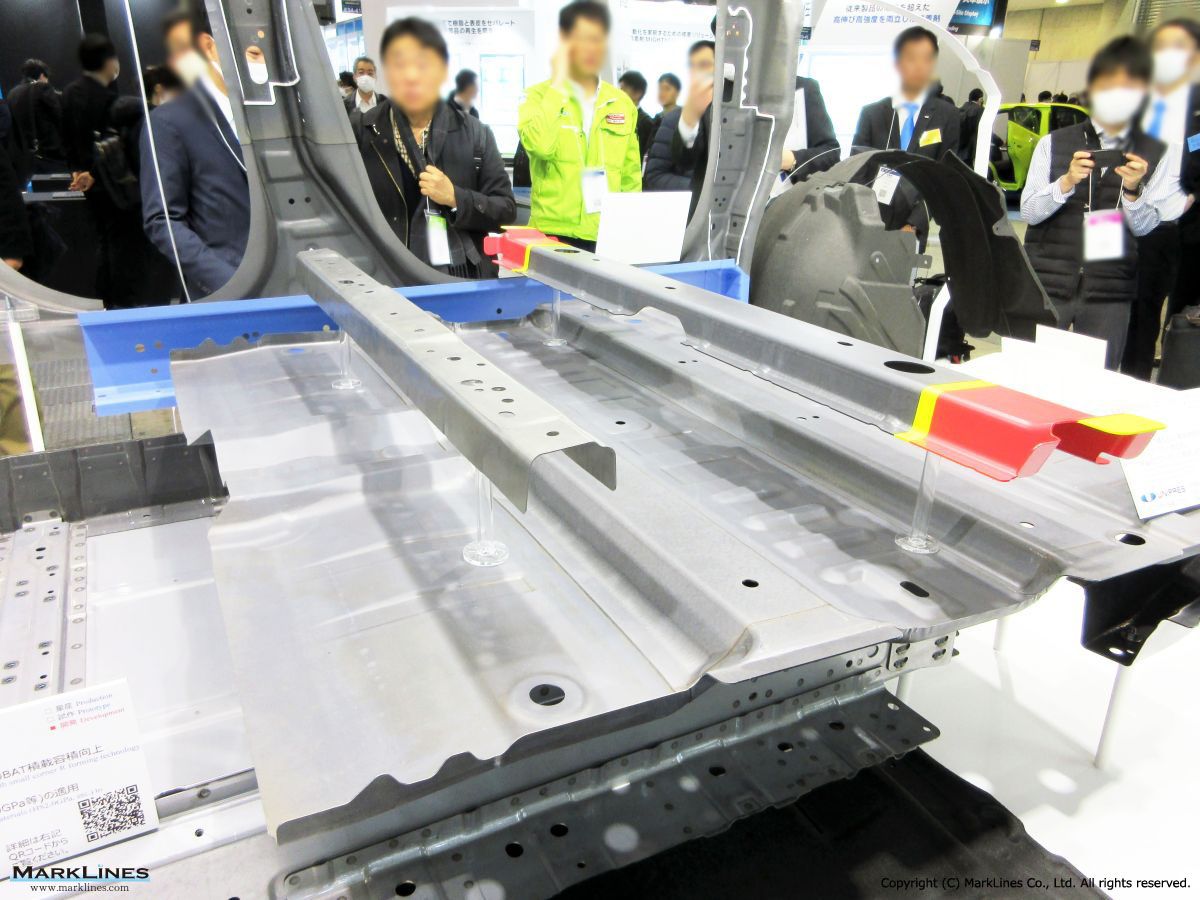
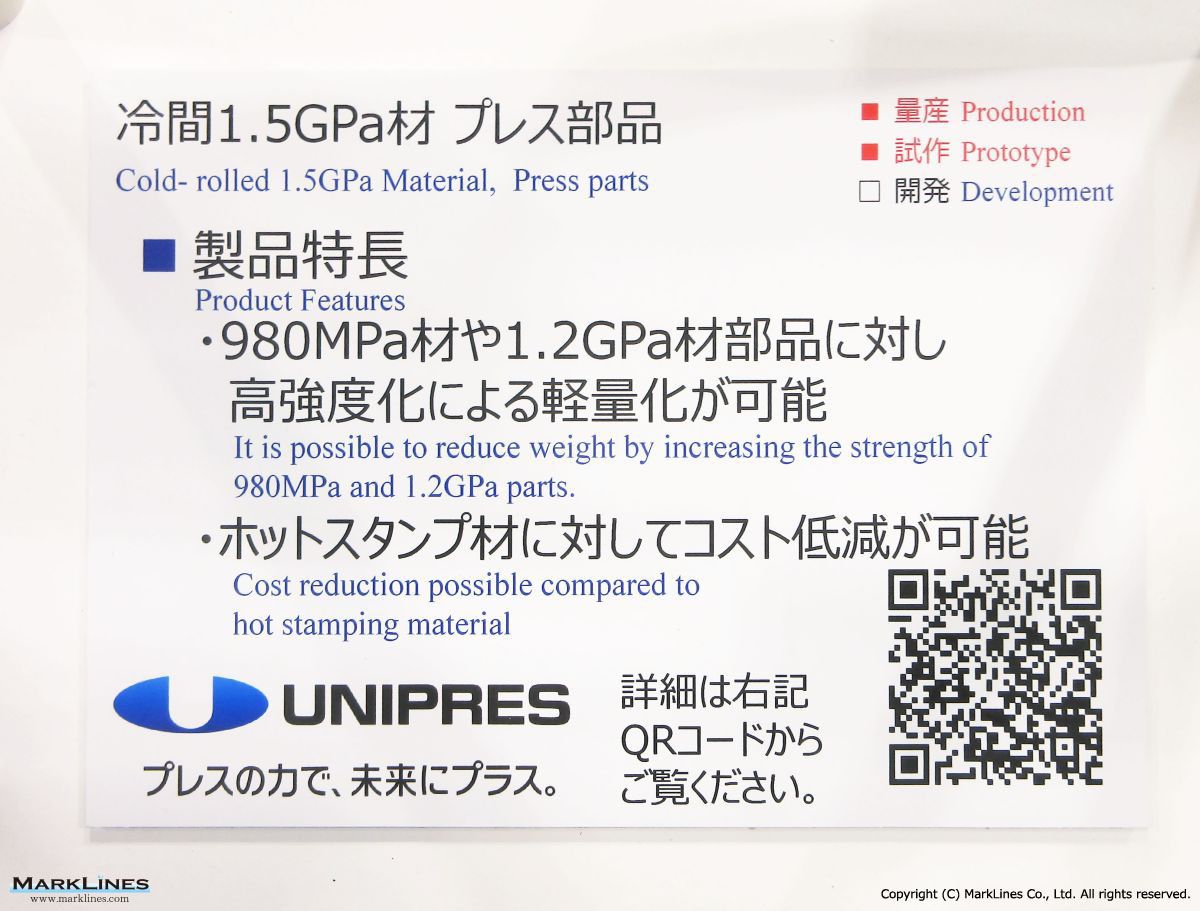
Cold-rolled 1.5GPa material, press parts
 2
2
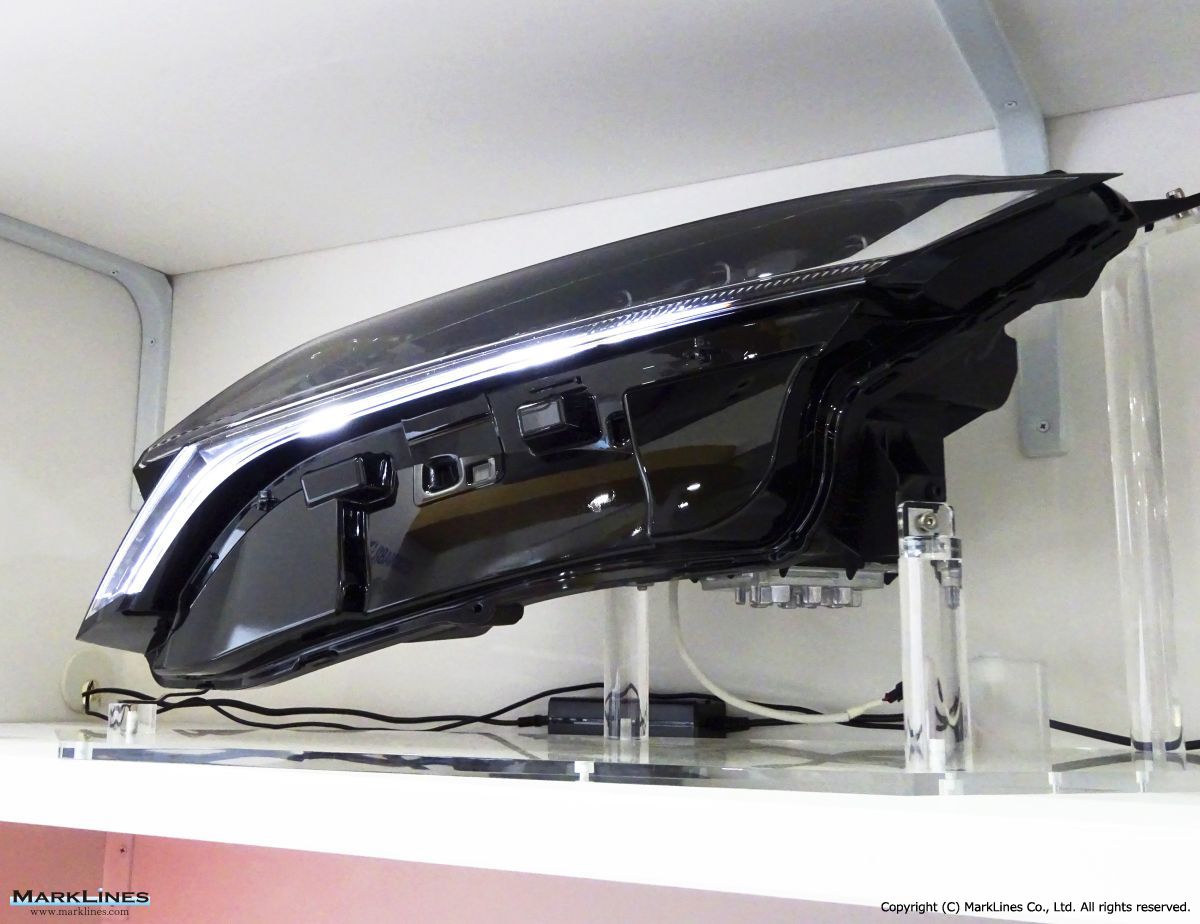
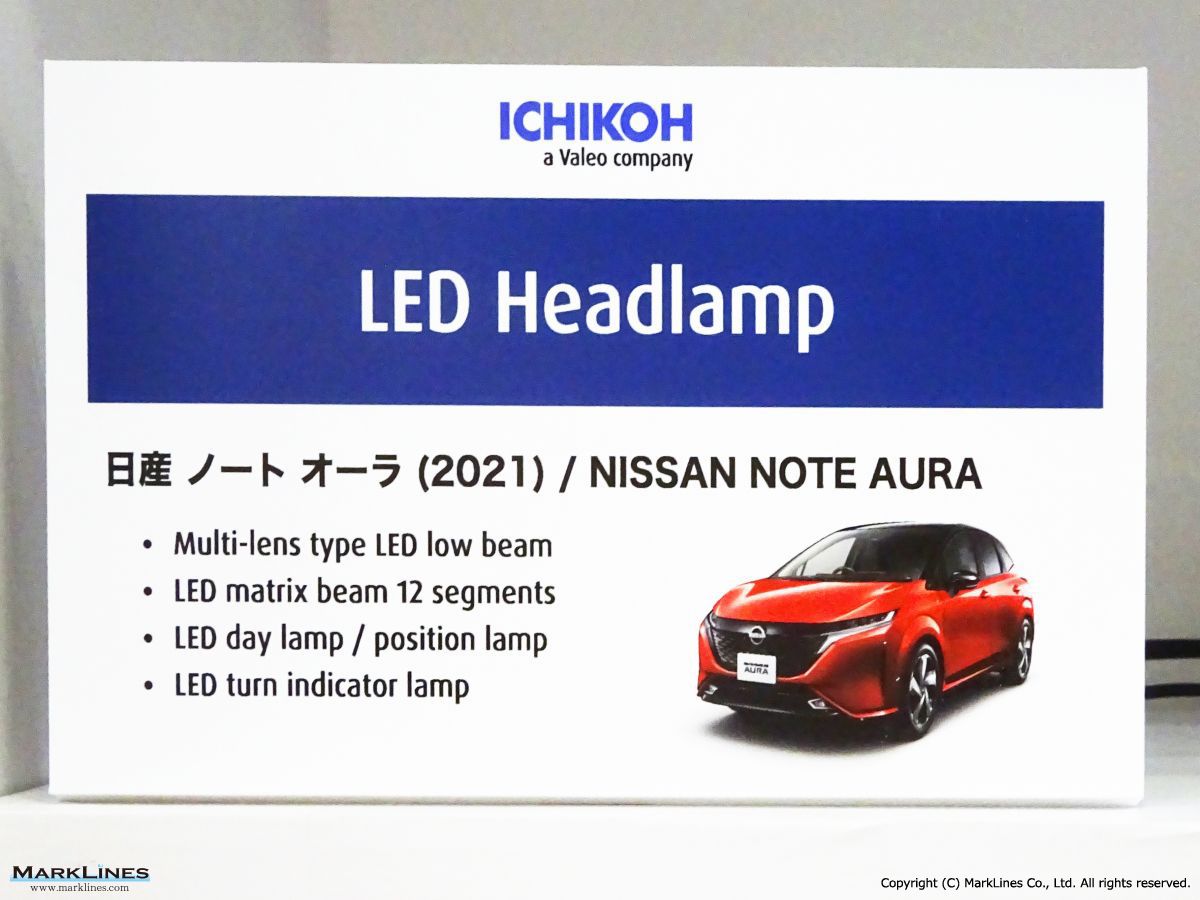
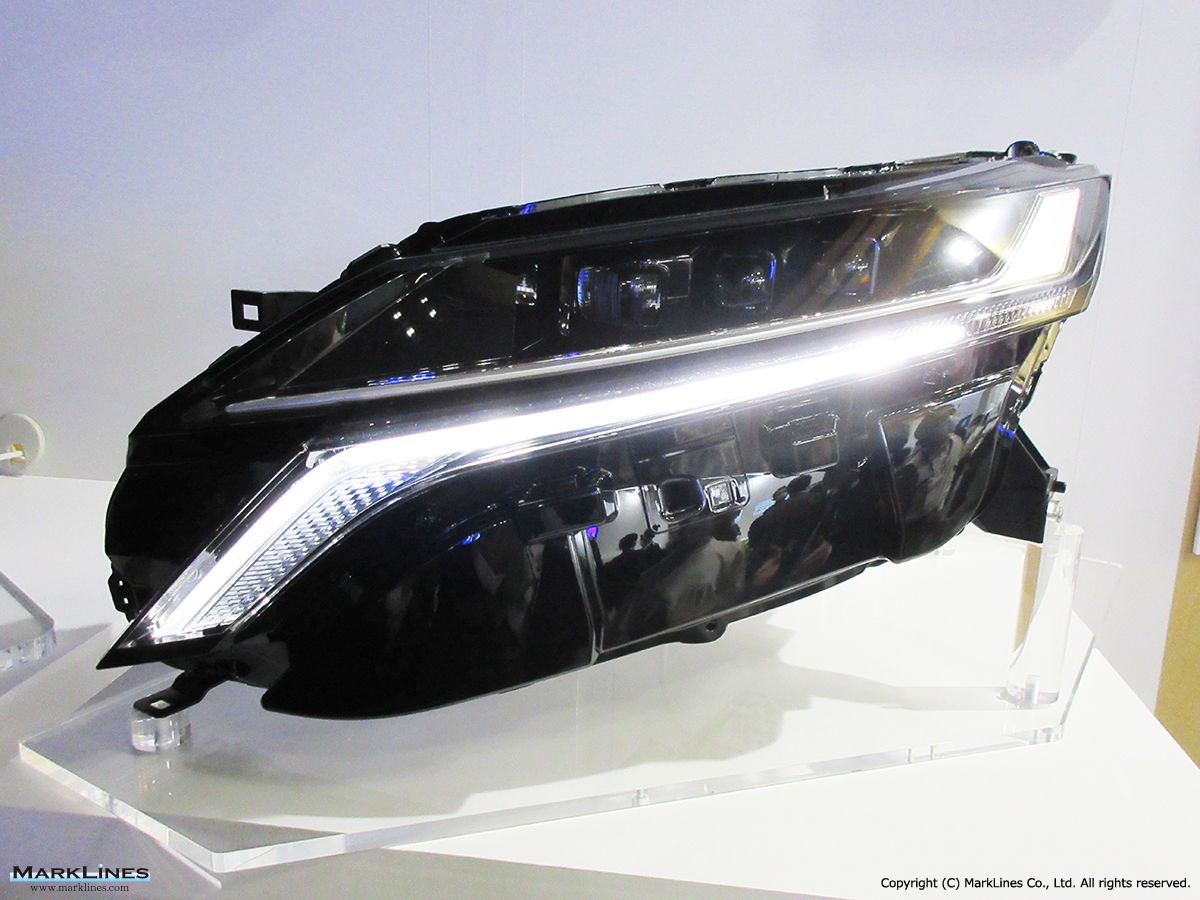
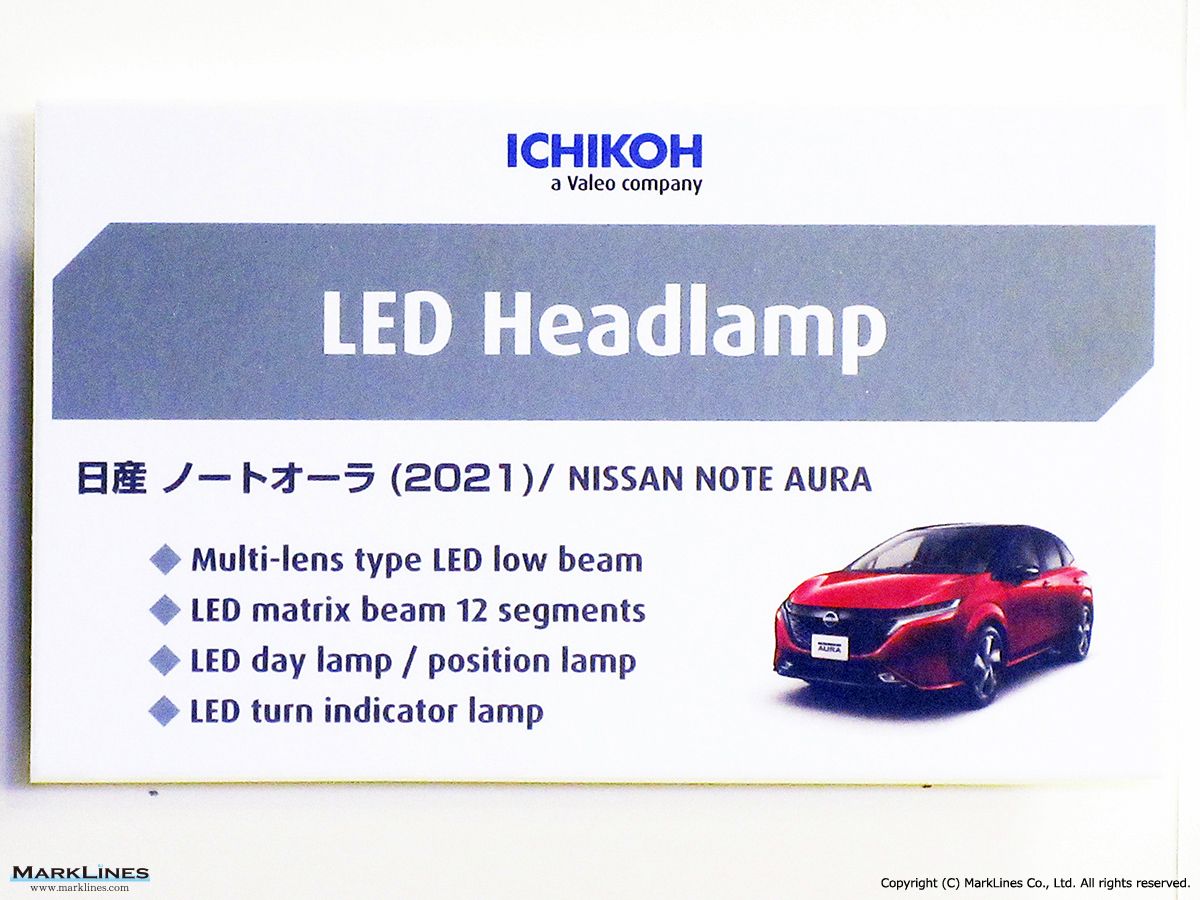
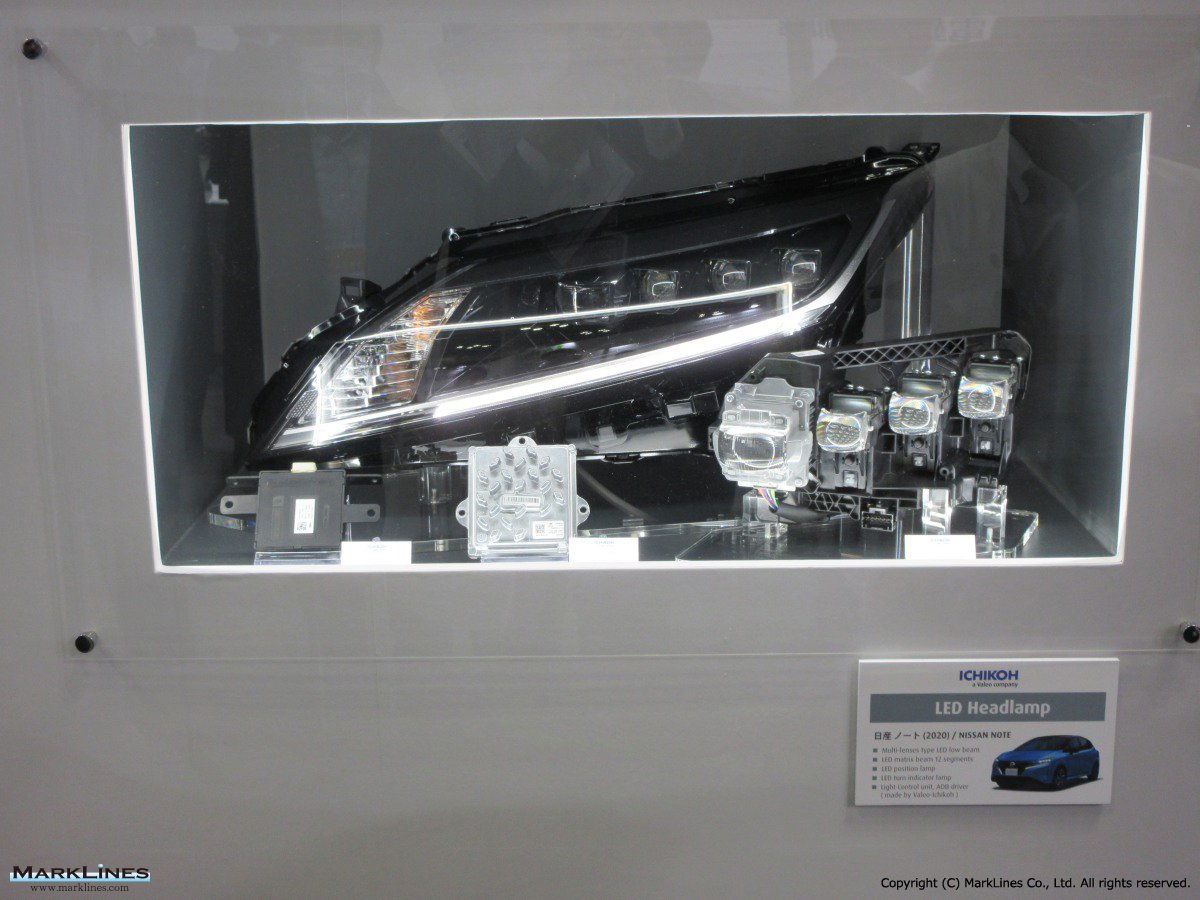
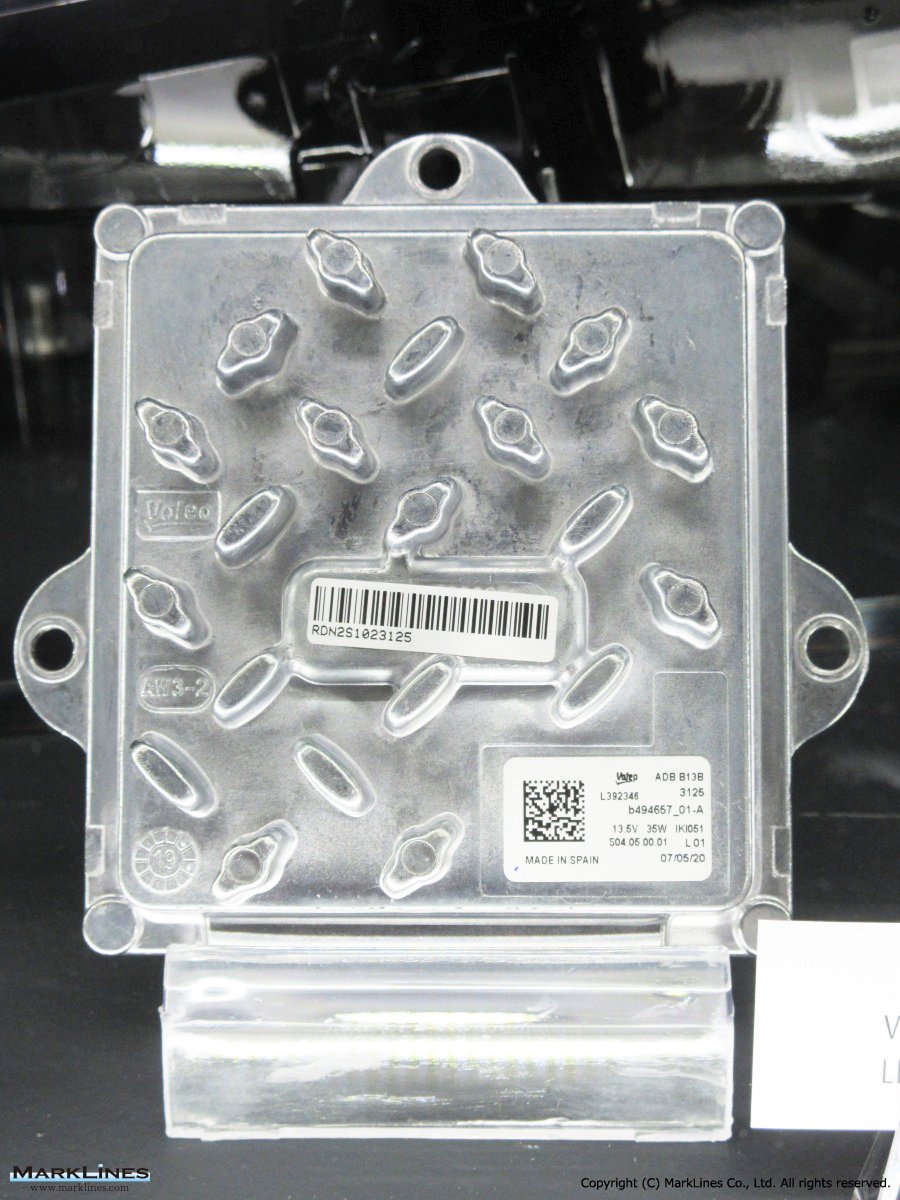
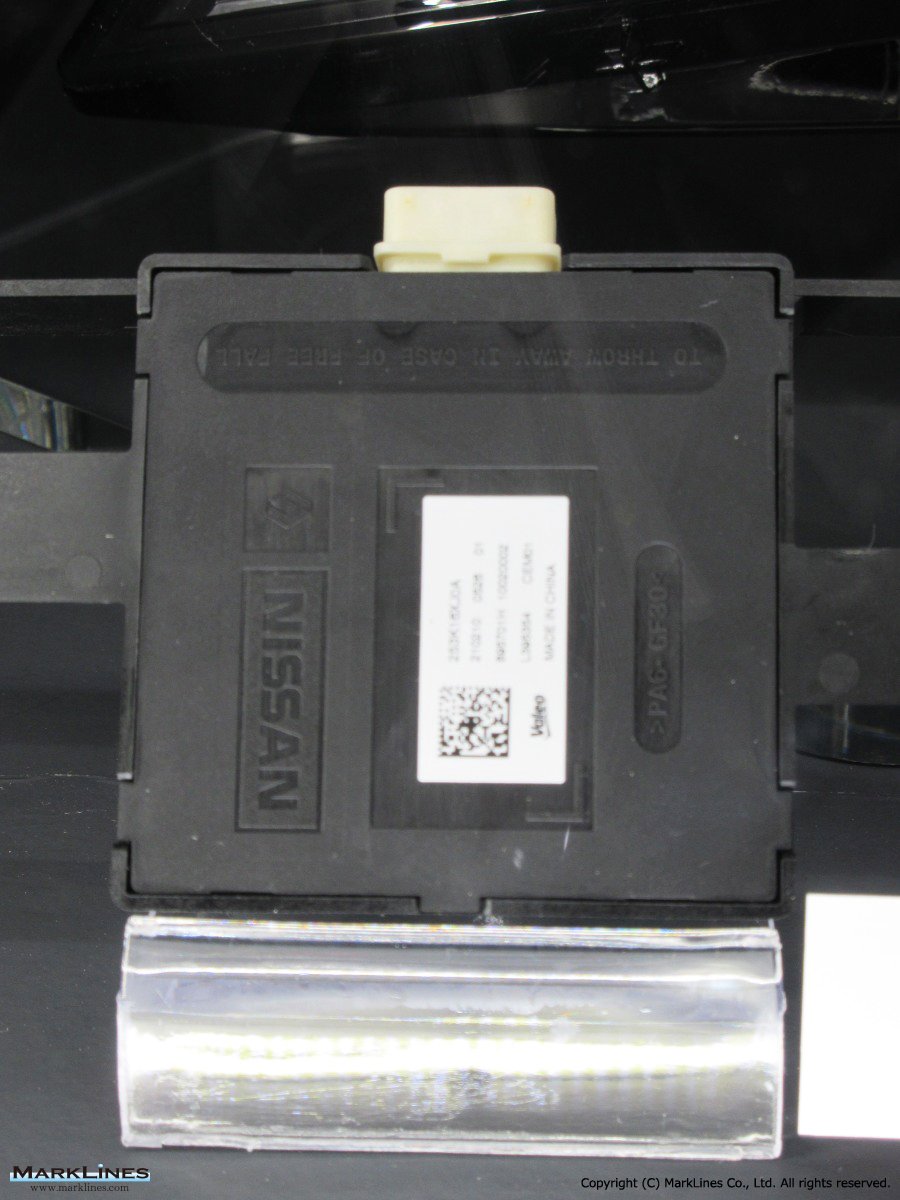
LED headlamp
 2
2
LED head lamp
 5
5
LED headlamp
 6
6
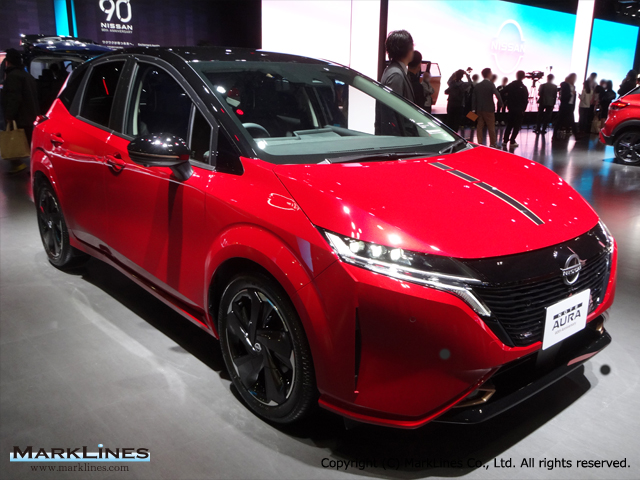
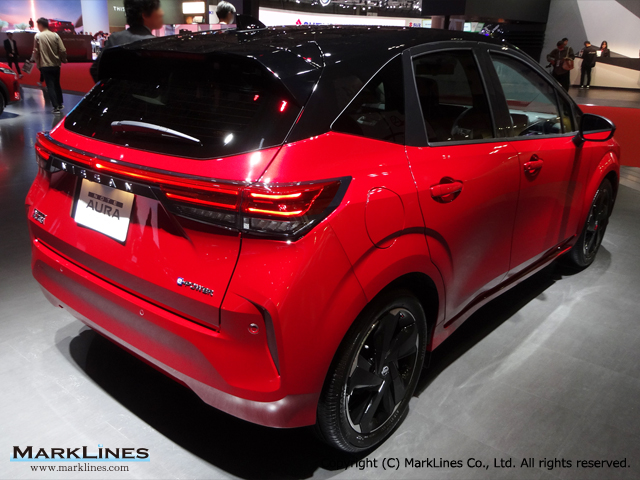
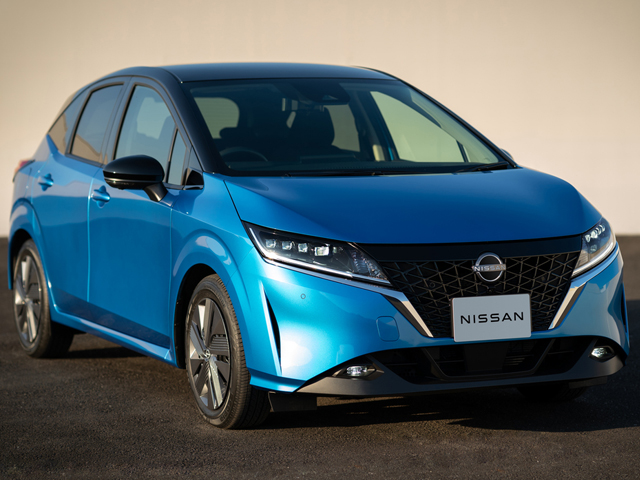
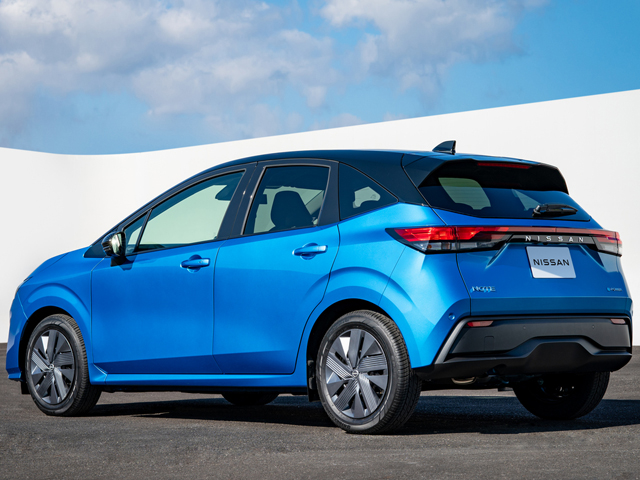
Note/Note Aura
 2
2
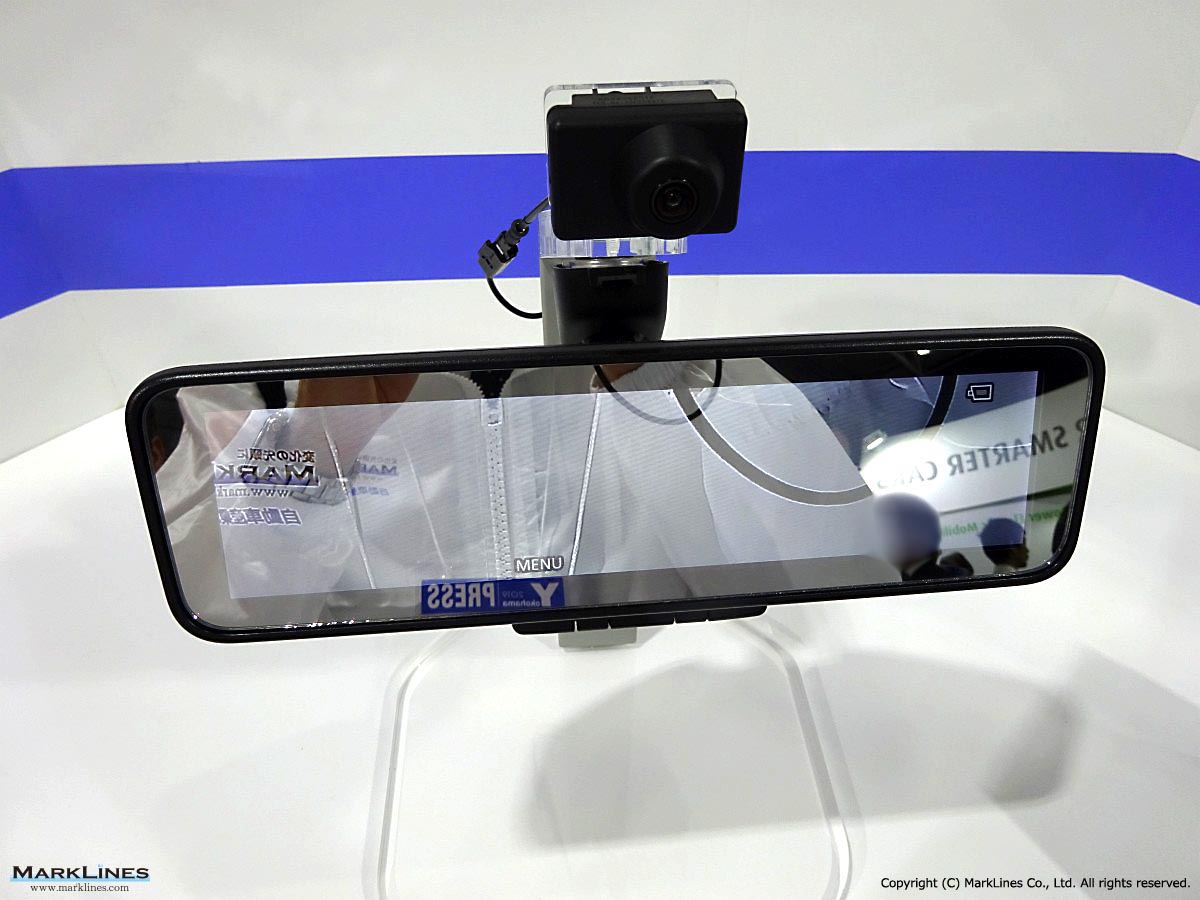
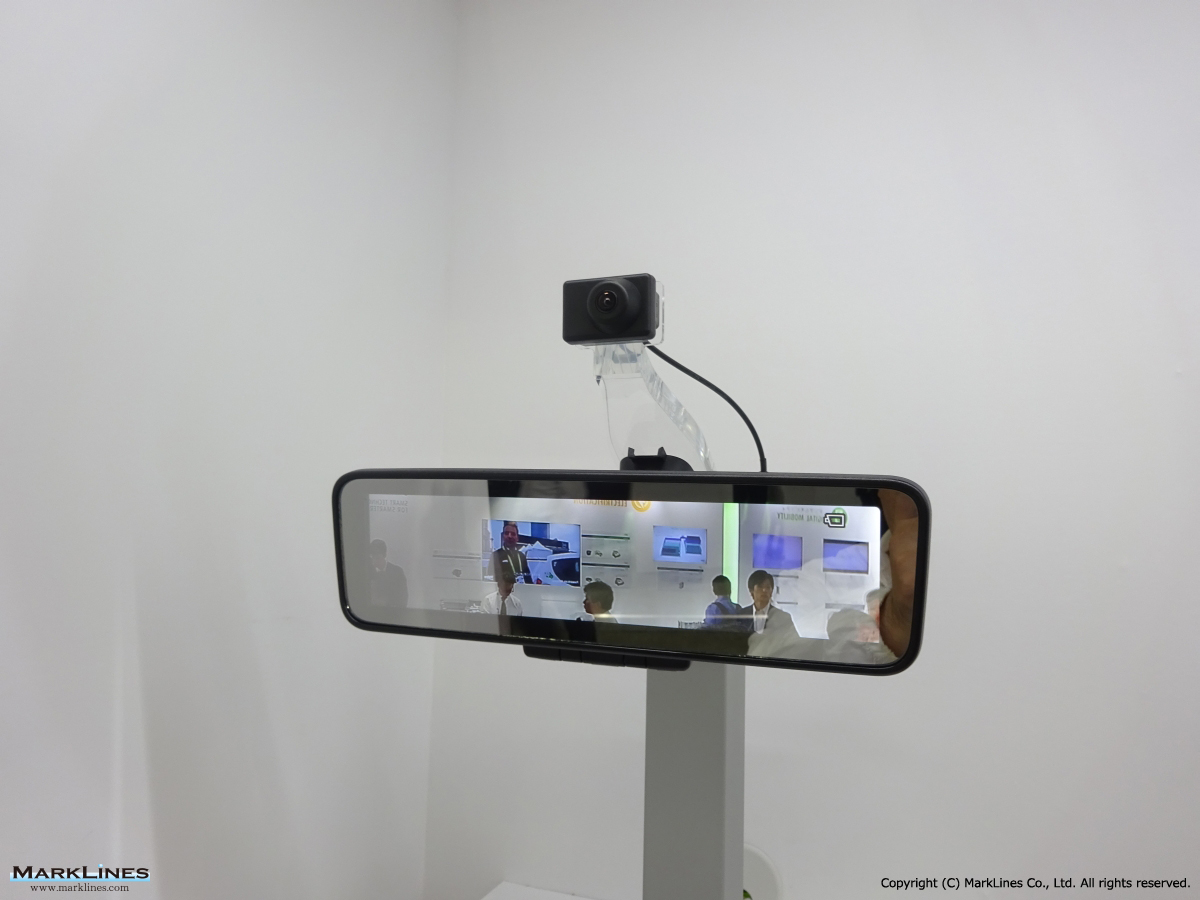
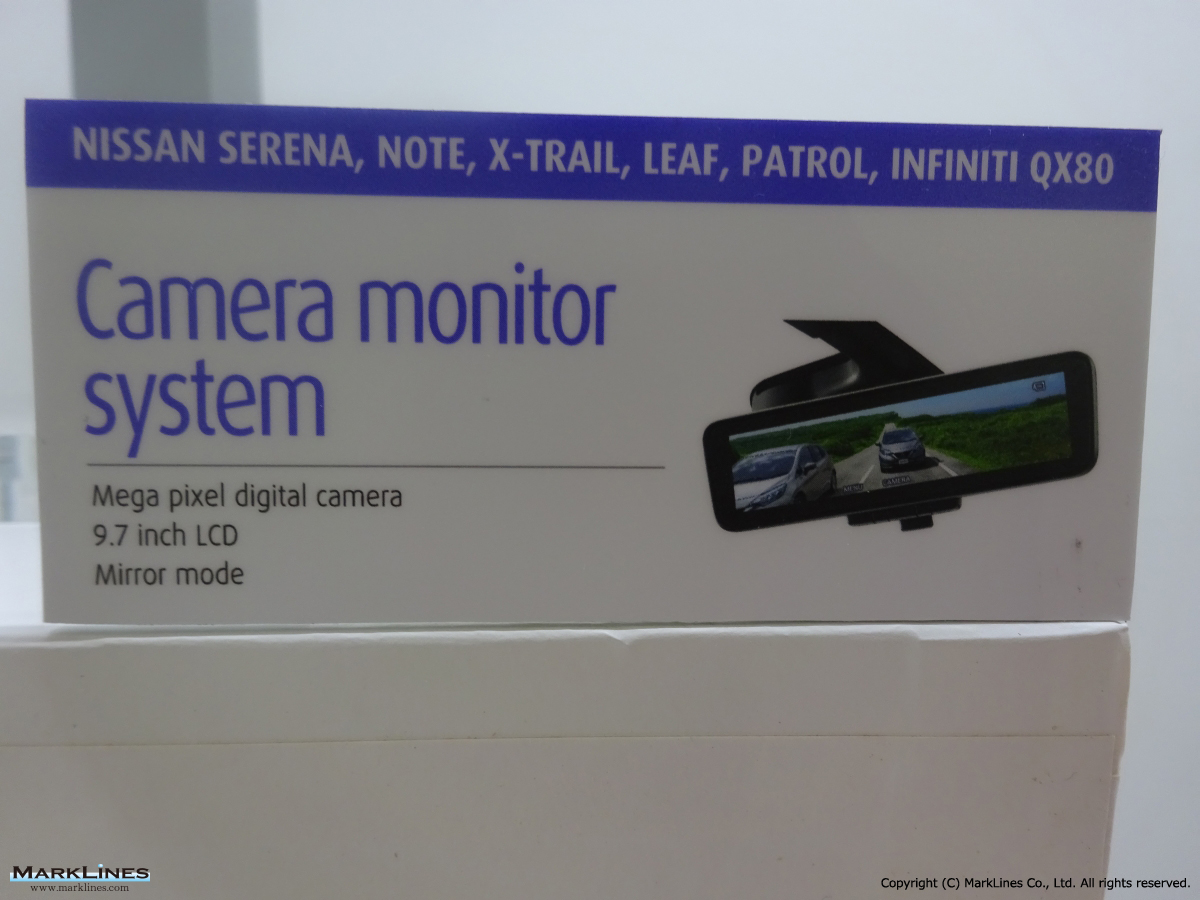
Camera monitor system
 6
6
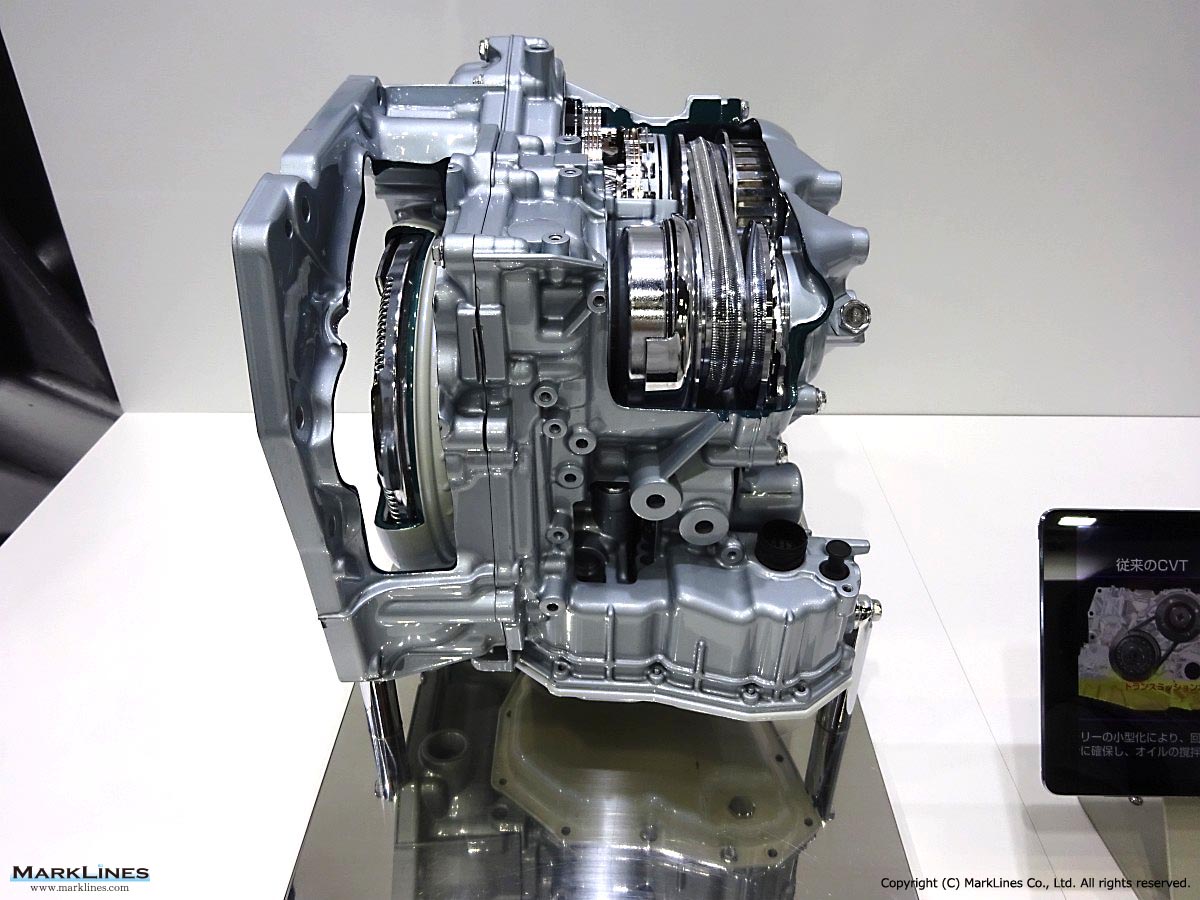
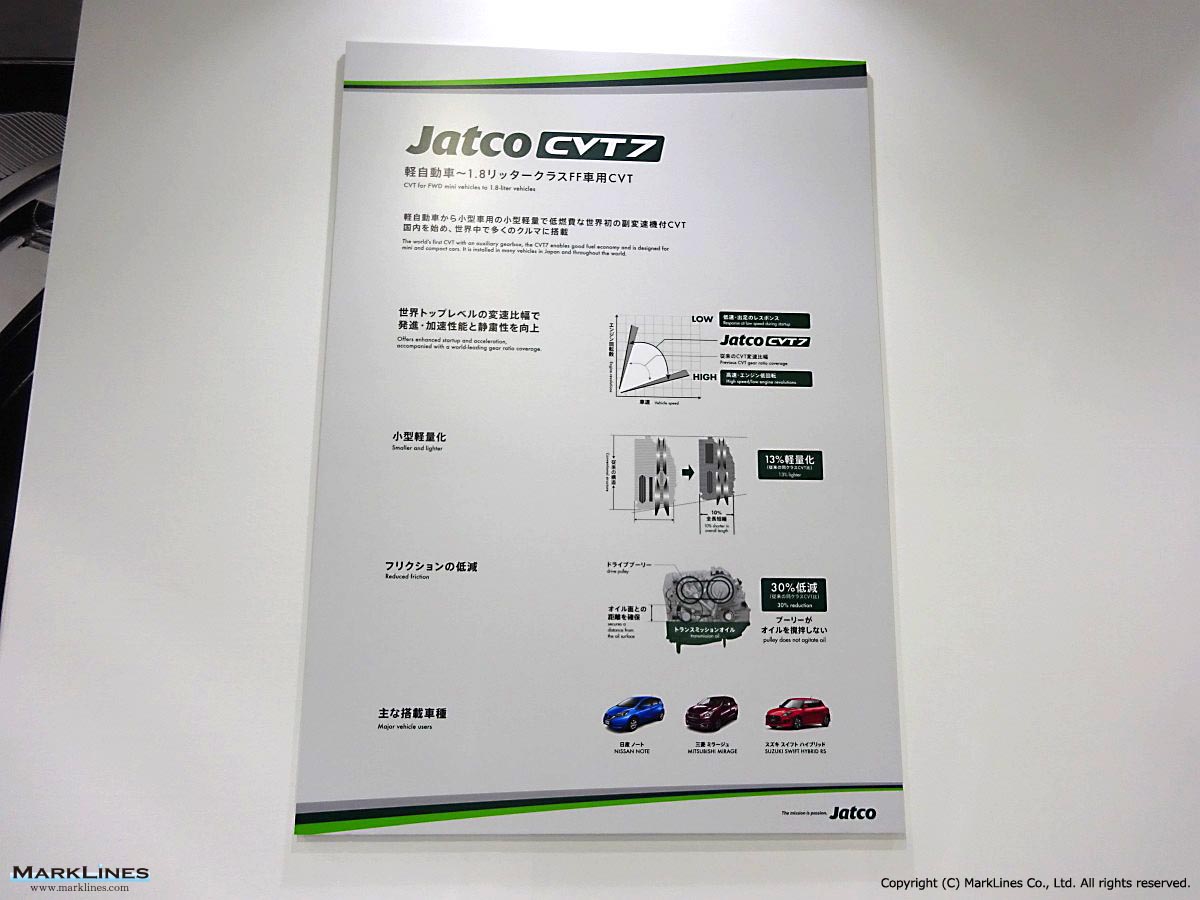
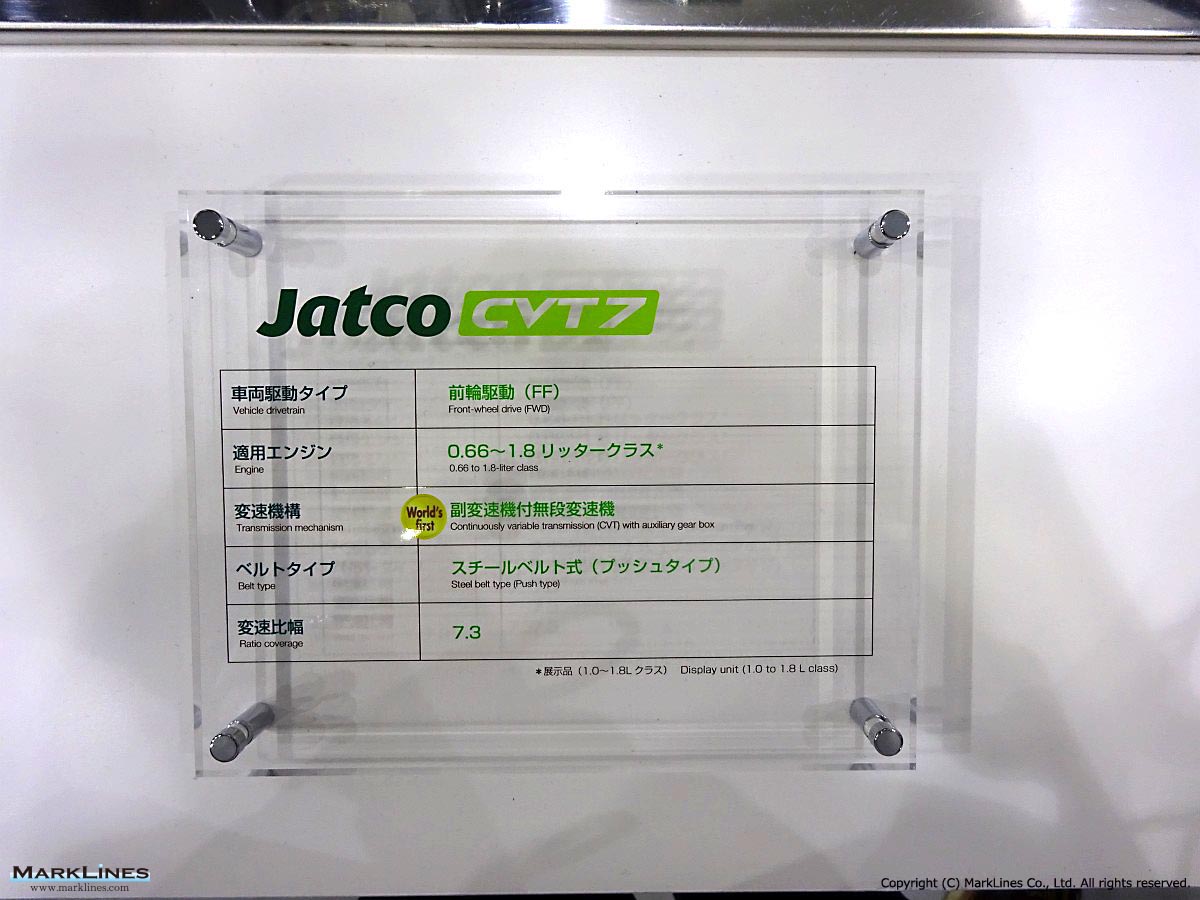
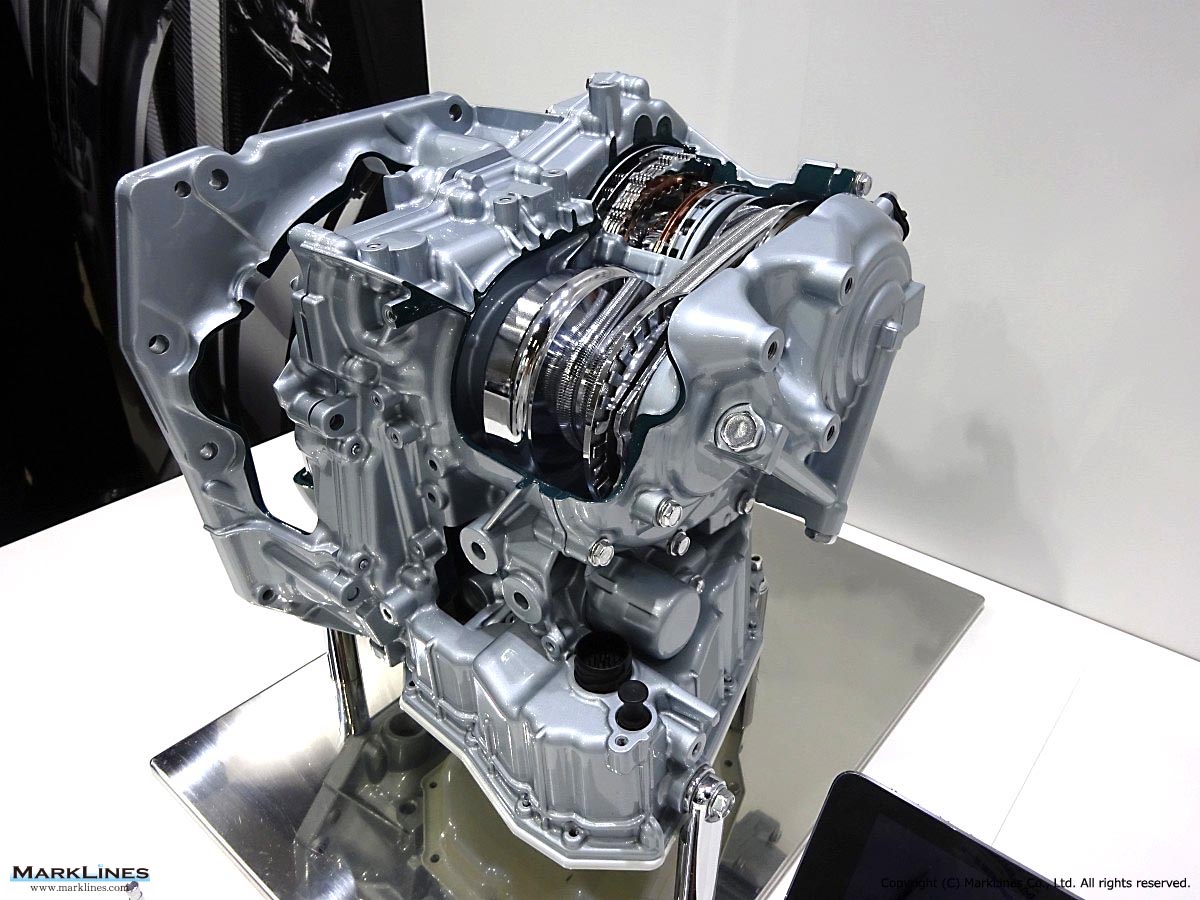
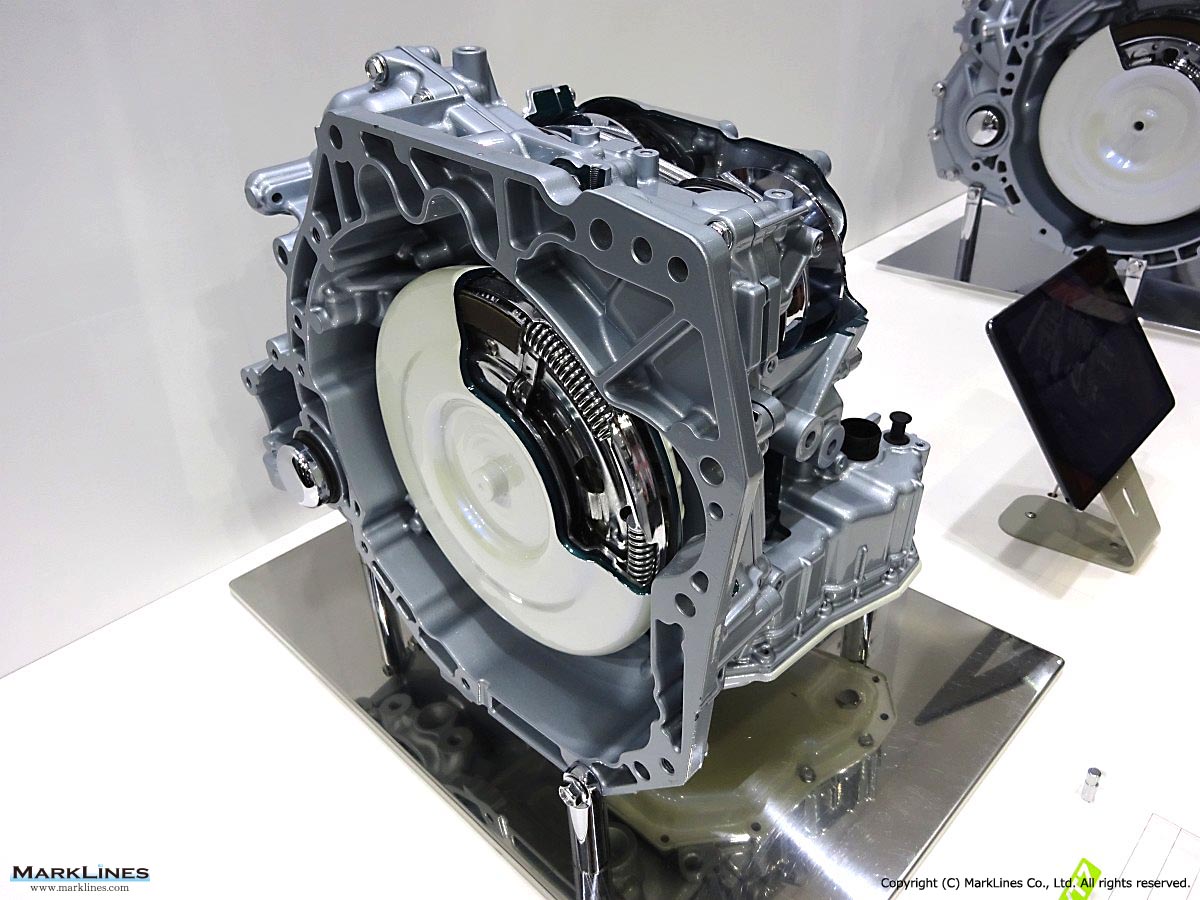
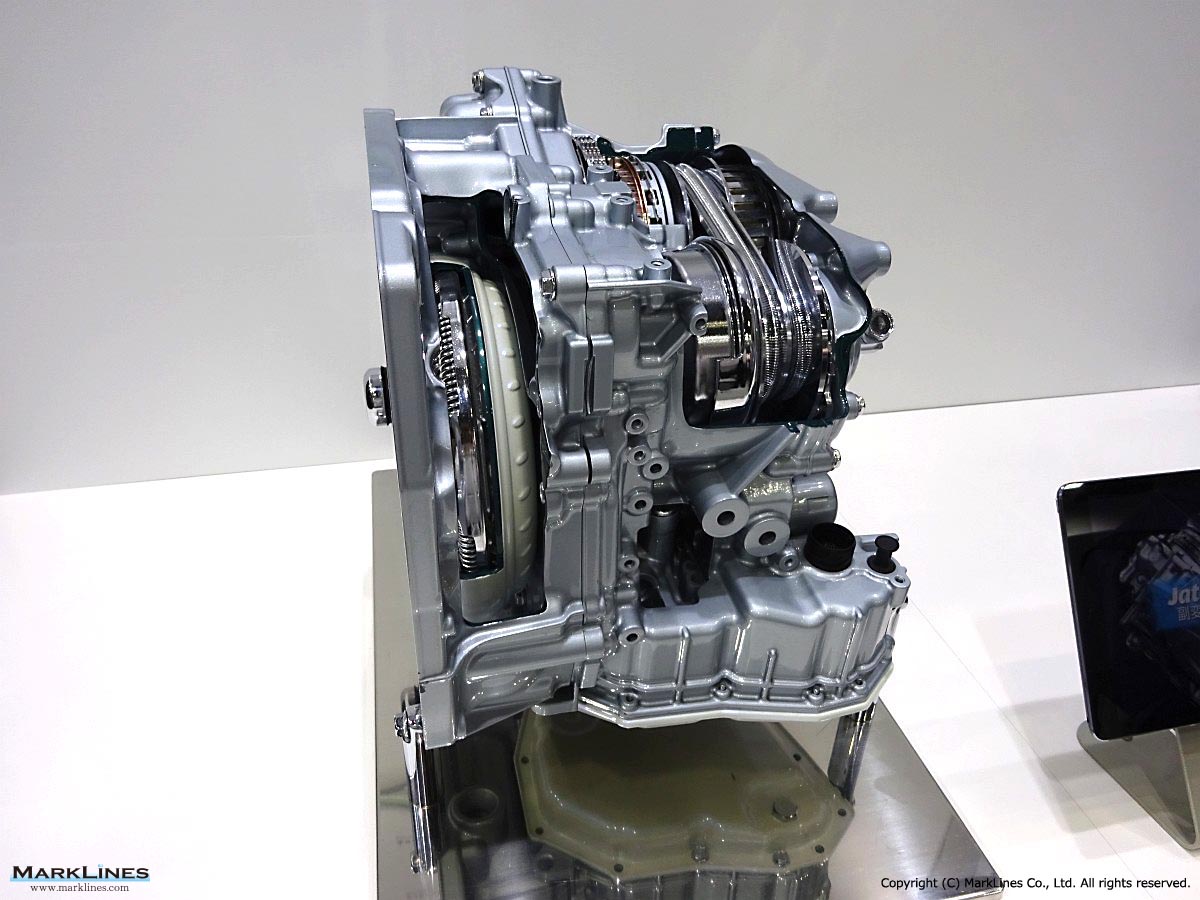
CVT7
 3
3
Camera monitor system
 1
1
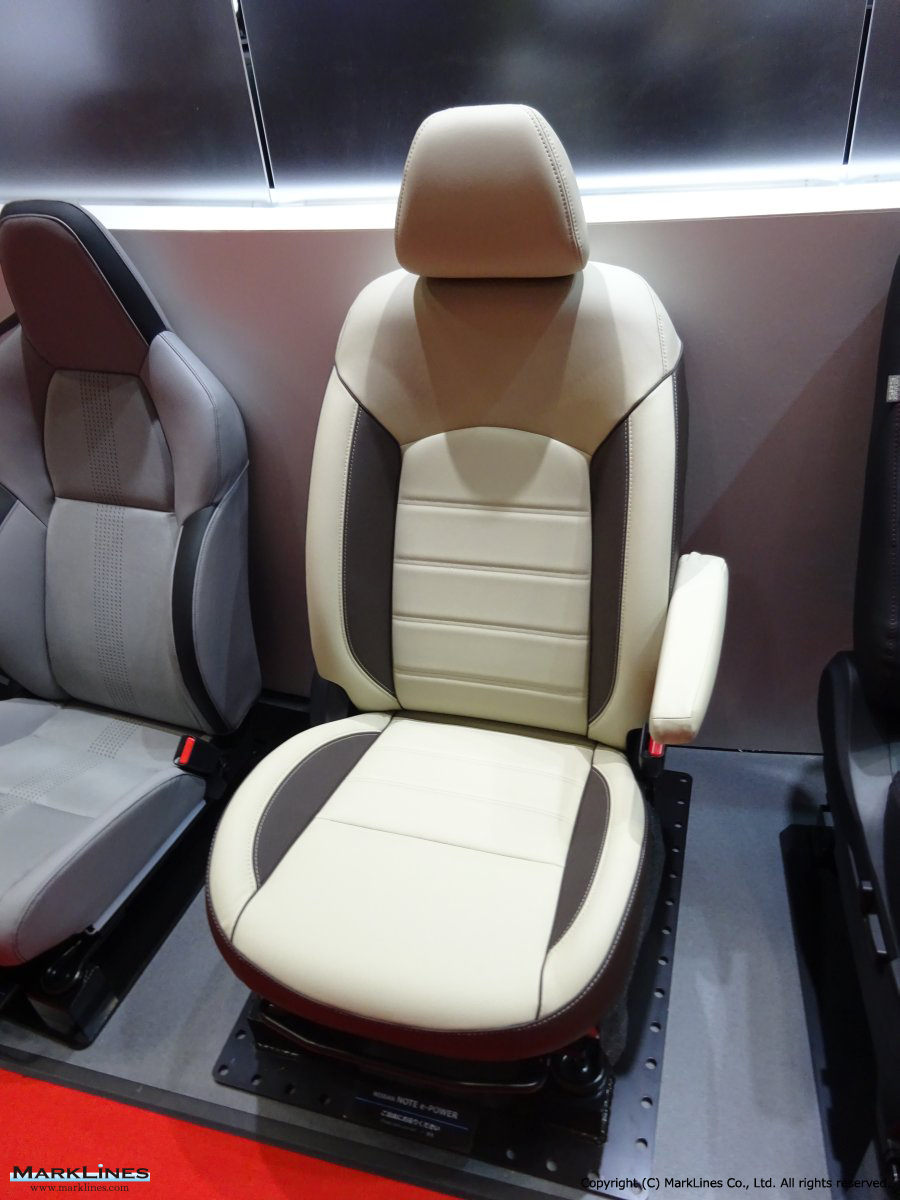
Seat
Sort by :
1 - 20 of 46 results
Data changes for Sales Statistics
February 23, 2012 Names of some makers/brands have been changed. Refer to the chart below for details. Download Timings of changes Dates of changes Country Remarks March 24, 2026 Thailand We have now added figures for some models and OEMs, which were previously listed as unknown. Please note that the overall total remains unchanged. March 12, 2026 Iraq Starting from January 2026, monthly sales volume by model are available. Februa...
Automotive Sales Data Updated at: 2026/03/24
China - New car sales in 2026 by OEM, model, vehicle type
5 3.8 0.9 -29.3 Passenger Cars Total 153.6 85.1 -15.4 352.4 84.9 -10.7 Commercial Vehicles Total 26.9 14.9 -14.0 62.7 15.1 3.9 Grand Total 180.5 100.0 -15.2 415.2 100.0 -8.8 Source:Created by MarkLines based on press release New vehicle sales by brands (Factory shipments) (NOTE) The below chart includes estimates. Feb. 2026 Jan.-Feb. 2026 Units (10,000) Share(%) Y-o-Y(%) Units (10,000) Share(%) Y-o-Y(%) Chinese b...
Automotive Sales Data Updated at: 2026/03/24
Representative models for each segment
g MINIEV, Changan Lumin Honda N-BOX, Suzuki Spacia, Daihatsu Tanto Suzuki Wagon R, Perodua Axia, Fiat Mobi B (Small) Chevrolet Aveo, Kia Soul, Nissan March (Micra) Renault Clio, Dacia Sandero, Peugeot 208 Geely Xingyuan, BYD Dolphin, Wuling Bingo/Binguo Toyota ROOMY, Suzuki Solio/Wagon R+, Nissan Note Suzuki Swift, VW Polo, Fiat Argo C (Lower Medium) Toyota Corolla, Honda Civic, Nissan Sentra VW Golf, Skoda Octavia, Toyota Corolla BYD Qin PLU...
Automotive Sales Data Updated at: 2026/03/10
Philippines - New car sales in 2025 by vehicle type
s of the Philippines Inc. (CAMPI) and the Truck Manufacturers Association (TMA) showed total vehicle sales of 37,352 units in November 2025, down 8.7% from 40,898 units a year earlier. Passenger car sales dropped 24.2% to 7,456 units, while commercial vehicle sales went down by 3.7% to 29,903 units.Note: The combined sub-category figures do not appear to reconcile with the total; figures are quoted as officially released by CAMPI and may be subje...
Automotive Sales Data Updated at: 2026/02/26
China - New car sales in 2025 by OEM, model, vehicle type
7 34.3 1.0 25.3 Passenger Cars Total 284.7 87.0 -8.7 3,010.3 87.5 9.2 Commercial Vehicles Total 42.5 13.0 15.3 429.6 12.5 10.9 Grand Total 327.2 100.0 -6.2 3,440.0 100.0 9.4 Source:Created by MarkLines based on press release New vehicle sales by brands (Factory shipments) (NOTE) The below chart includes estimates. Dec. 2025 Jan.-Dec. 2025 Units (10,000) Share(%) Y-o-Y(%) Units (10,000) Share(%) Y-o-Y(%) Chinese b...
Automotive Sales Data Updated at: 2026/02/10
Mexico - New car sales in 2025 by OEM, vehicle type
al de Estadistica y Geografia (INEGI) Flash report, November 2025 Dec 4, 2025 *There are cases where recently released data and detailed information in the database do not match up for reasons including different information sources, and discrepancies between preliminary reports and confirmed data.Note: Some figures were updated on December 9.Mexican vehicle sales down 0.3% in November 2025On December 2, Mexico’s Instituto Nacional de Estadist...
Automotive Sales Data Updated at: 2026/02/06
USA - New car sales in 2025 by OEM, model, vehicle type
USA - New car sales in 2025 by OEM, model, vehicle type Flash report, Automotive sales volume, 2025 Jan. Feb. Mar. Apr. May Jun. Jul. Aug. Sep. Oct. Nov. Dec. Flash report, December 2025 Jan 6, 2026 U.S. auto sales down 1.5% in December, up 2.7% for 2025 full year to 16.39 million unitsNote: Some figures were updated on January 21.MarkLines' data compiled as of January 6, 2026, shows that U.S. new car sales for December 2025 were 1,476,588 units...
Automotive Sales Data Updated at: 2026/02/04
Spain - New car sales in 2025 by OEM
AC explained that "The August market figures give us two important insights. On the one hand, the good behaviour of the general market for passenger cars already grows by 15% and allows this year's closure to be above 1.1 million units. While we are still far from pre-pandemic figures, it should be noted that it is sales to individuals and companies that are pulling the market. And, on the other hand, the electrified market in August has accounte...
Automotive Sales Data Updated at: 2026/02/03
Japan - New car sales in 2025 by OEM, model, vehicle type
Toyota Corolla 12,368 14,622 -15.4% 87,387 99,823 -12.5% 6 Daihatsu Move 11,299 5,083 122.3% 62,163 14,167 338.8% 7 Toyota ROOMY 10,150 10,003 1.5% 55,039 29,259 88.1% 8 Toyota Sienta 9,289 11,441 -18.8% 66,171 67,090 -1.4% 9 Toyota Alphard 8,206 8,234 -0.3% 52,941 45,619 16.1% 10 Nissan Note 7,824 9,000 -13.1% 51,132 61,857 -17.3% Source: Japan Automobile Dealers Association, Japan Mini Vehicles Associations Registrations of new im...
Automotive Sales Data Updated at: 2026/02/02
Volume data search results
Volume data search results Home Automotive Sales Data Volume data search results Volume data search results Search results Notes Downloading data Regarding graphs EV/HV/PHV/FCV Category Data Search results Notes "-" Hyphen Data is unavailable from the source. "0" Zero The sales volume is zero. "N/A" An accurate value or a model name is unavailable. "TBA" If information about the data is updated at a later date. Adjustmen...
Automotive Sales Data Updated at: 2025/12/09
Vietnam - New car sales in 2024 by OEM, vehicle type
y/y to 188,997 units.Auto sales in Vietnam decreased by 12.9% month-on-month in August. The decline in sales in August 2024 was a predictable scenario as, in addition to the taboo mentality, people continued to wait for the State's policy of reducing registration fees. However, this is just a quiet note preparing for the boom period in the remaining months of the year. Because, the purchasing power of Vietnamese people for cars often tends to inc...
Automotive Sales Data Updated at: 2025/07/03
Japan - New car sales in 2024 by OEM, model, vehicle type
pacia 12,940 11,571 11.8% 172,311 133,480 29.1% 3 Toyota Corolla 12,712 11,411 11.4% 166,955 154,870 7.8% 4 Toyota Yaris 15,244 14,255 6.9% 166,162 194,364 -14.5% 5 Daihatsu Hijet 7,478 13,303 -43.8% 130,689 165,730 -21.1% 6 Toyota Sienta 6,908 9,390 -26.4% 111,090 132,332 -16.1% 7 Nissan Note 6,476 5,994 8.0% 101,766 102,508 -0.7% 8 Daihatsu Tanto 9,618 11,792 -18.4% 93,759 159,392 -41.2% 9 Suzuki HUSTLER 6,820 6,411 6.4% 92,818 82...
Automotive Sales Data Updated at: 2025/07/02
China - New car sales in 2024 by OEM, model, vehicle type
.0 27.4 0.9 3.5 Passenger Cars Total 312.0 89.4 11.7 2,756.3 87.7 5.8 Commercial Vehicles Total 36.9 10.6 1.2 387.3 12.3 -3.9 Grand Total 348.9 100.0 10.5 3,143.6 100.0 4.5 Source:Created by MarkLines based on press release New vehicle sales by brands (Factory shipments) (NOTE) The below chart includes estimates. Dec. 2024 Jan.-Dec. 2024 Units (10,000) Share(%) Y-o-Y(%) Units (10,000) Share(%) Y-o-Y(%) Chinese b...
Automotive Sales Data Updated at: 2025/07/02
South Africa - Flash report, Automotive sales volume, 2023
ther undermining the new vehicle market’s ability to full recovery. New vehicle sales increased by only 0.5% year-on-year in 2023 to 532,098 units compared to the 529,556 units in 2022 and will likely now take four years to recover to the pre-pandemic level of 536,612 units in 2019. On a positive note, heavy commercial vehicle sales already exceeded the pre-pandemic level in 2022, supported by the transport of goods forced onto roads due to the...
Automotive Sales Data Updated at: 2025/06/04
Canada - Flash report, Automotive sales volume, 2023
tuation brought on by vehicle model availability affected by supply chain issues that had made it the worst October since 2009.However, this October’s results have now made it 12 consecutive months of sales increases compared to the previous year, prompting Andrew King, Managing Partner of DAC to note that “The market has been on a tear the last 3 months with gains close to 20% each month.” The SAAR for October came in at 1.79 million – t...
Automotive Sales Data Updated at: 2025/06/04
Japan - Flash report, Automotive sales volume, 2023
Tanto 11,792 12,160 -3.0% 159,392 107,810 47.8% 5 Toyota Corolla 11,411 11,202 1.9% 154,870 131,548 17.7% 6 Suzuki Suzuki Spacia 11,571 10,423 11.0% 133,480 106,461 25.4% 7 Toyota Sienta 9,390 9,348 0.4% 132,332 68,922 92.0% 8 Daihatsu Move 4,988 9,749 -48.8% 104,557 94,837 10.2% 9 Nissan Note 5,994 8,571 -30.1% 102,508 110,113 -6.9% 10 Toyota ROOMY 8,917 7,329 21.7% 100,800 109,236 -7.7% Source: Japan Automobile Dealers Associatio...
Automotive Sales Data Updated at: 2025/06/04
USA - Flash report, Automotive sales volume, 2023
USA - Flash report, Automotive sales volume, 2023 Flash report, Automotive sales volume, 2023 Jan. Feb. Mar. Apr. May Jun. Jul. Aug. Sep. Oct. Nov. Dec. Flash report, December 2023 Jan 4, 2024 U.S. car sales up 13.0% in December, up 12.3% for full-year 2023Note: Some figures were updated on Jan. 11.U.S. light vehicle sales in December of 1,454,597 units were up 13.0% as compared to the same month in 2022.Truck and SUV sales increased 15.7% from ...
Automotive Sales Data Updated at: 2025/06/04
China - Flash report, Automotive sales volume, 2023
5 26.5 0.9 -18.1 Passenger Cars Total 279.2 88.5 23.3 2,606.3 86.6 10.6 Commercial Vehicles Total 36.4 11.5 25.1 403.1 13.4 22.1 Grand Total 315.6 100.0 23.5 3,009.4 100.0 12.0 Source:Created by MarkLines based on press releaseNew vehicle sales by brands (Factory shipments) (NOTE) The below chart includes estimates. Dec. 2023 Jan.-Dec. 2023 Units (10,000) Share(%) Y-o-Y(%) Units (10,000) Share(%) Y-o-Y(%) Chinese b...
Automotive Sales Data Updated at: 2025/06/04
South Africa - Flash report, Automotive sales volume, 2022
cord fuel prices, as well as record highs in the frequency and intensity of load shedding weighed heavily on both business and consumer confidence. However, the new vehicle market’s performance in 2022 remained resilient despite the the multiple national and international headwinds. On a positive note, the lifting of all COVID-19 lockdown restrictions in the country in 2022 along with the recovery in business and leisure travel provided some su...
Automotive Sales Data Updated at: 2025/06/04
Japan - Flash report, Automotive sales volume, 2022
. 2021 Y-o-Y Jan.-Dec. 2022 Jan.-Dec. 2021 Y-o-Y 1 Honda N BOX 16,760 13,439 24.7% 202,197 188,940 7.0% 2 Daihatsu Hijet 13,946 11,065 26.0% 185,220 152,124 21.8% 3 Toyota Yaris 11,192 16,907 -33.8% 168,558 212,927 -20.8% 4 Toyota Corolla 11,202 11,841 -5.4% 131,548 110,865 18.7% 5 Nissan Note 8,571 7,740 10.7% 110,113 90,177 22.1% 6 Toyota ROOMY 7,329 9,864 -25.7% 109,236 134,801 -19.0% 7 Daihatsu Tanto 12,160 10,650 14.2% 107,810 ...
Automotive Sales Data Updated at: 2025/06/04


 Japan
Japan USA
USA Mexico
 Germany
 China (Shanghai)
 Thailand
 India
India