
 AI Navigator


Search Results by Category
 AI Navigator
All information related to {{ key_word }}.
AI Navigation will guide you. Click here for information about {{ key_word }}.
Images
 3
3
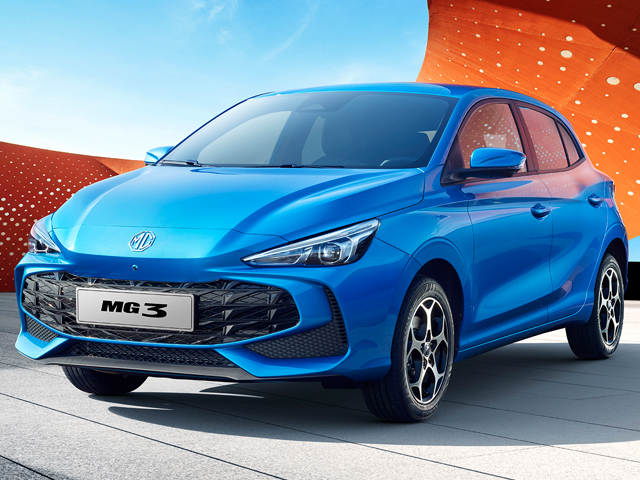
MG3 Hybrid+
_thumbnail.jpg) 2
2
GJAW 2024: MG Motor Indonesia displays vehicle lineup; MG G90 MPV presented
_thumbnail.jpg) 2
2
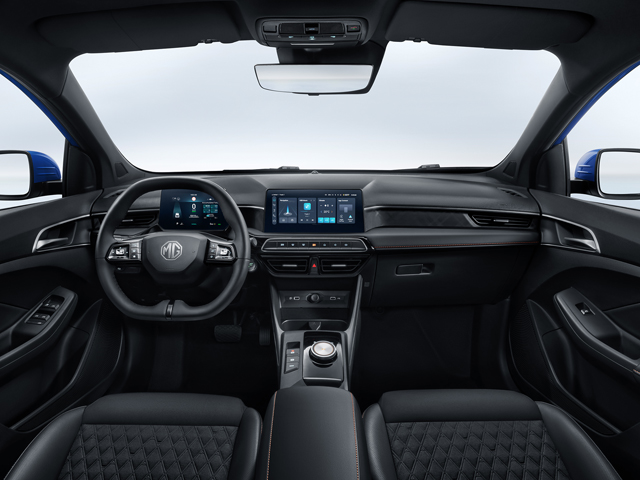
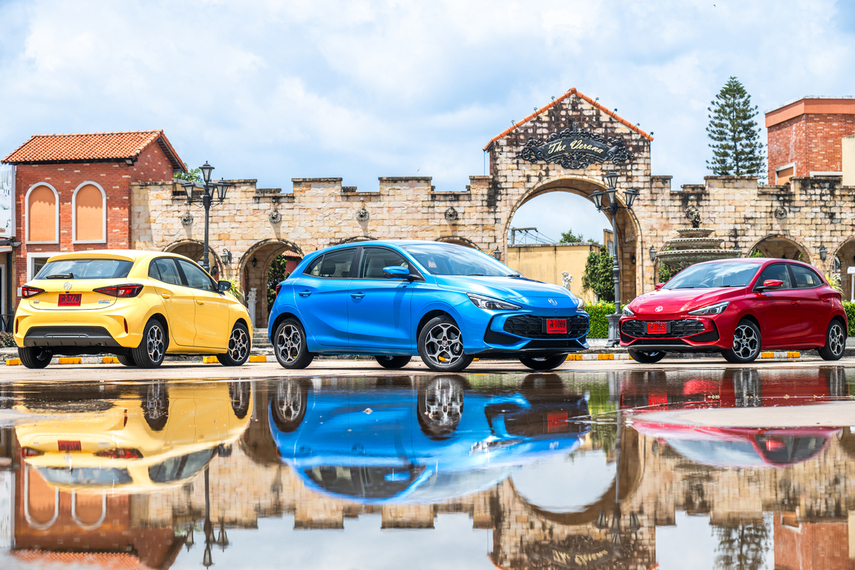
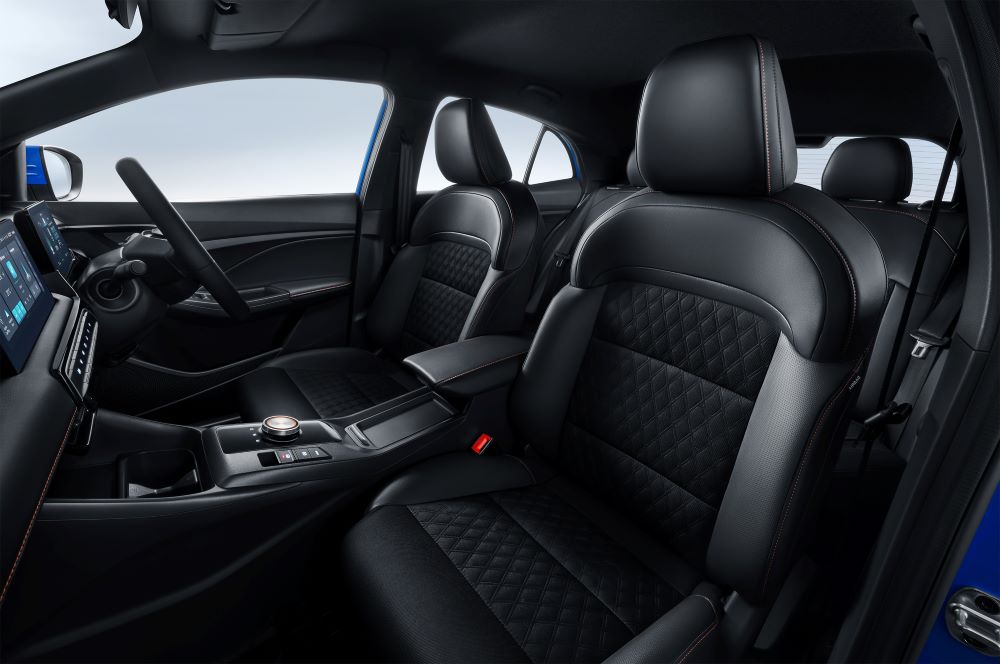
All-new MG3 HYBRID+ launched in Thailand
_thumbnail.jpg) 2
2
All-new MG3 HYBRID+ rolls off production line in Thailand
 1
1
MG to announce price of all-new MG3 HYBRID+ in Thailand on August 20
 1
1
MG Motor, UK announces pricing of all-new MG3 Hybrid+ supermini
 2
2
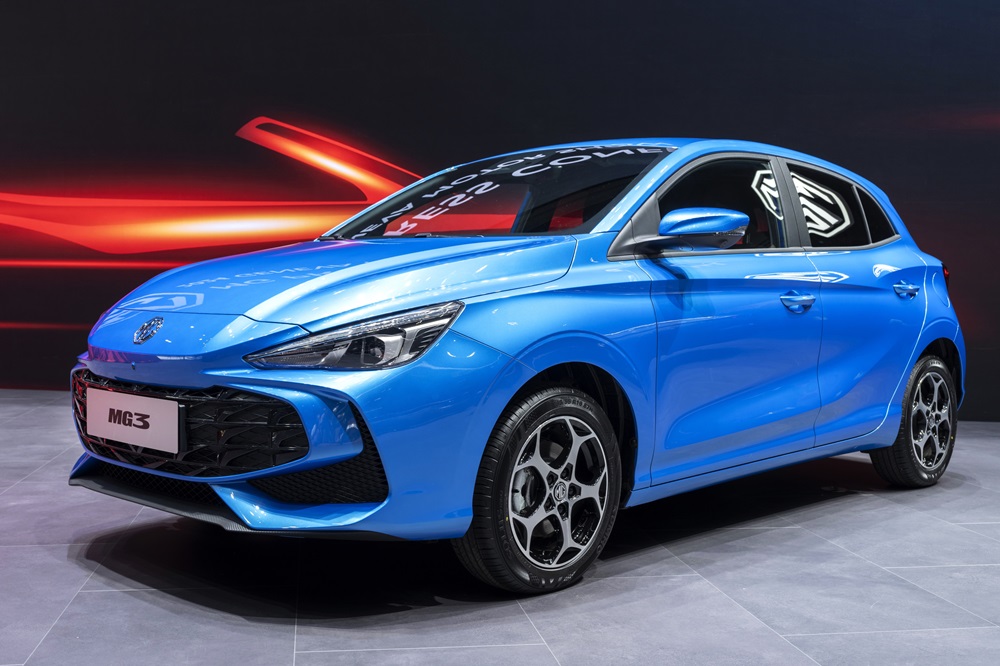
Geneva MS 2024: MG Motor presents MG3 Hybrid+ and Cyberster
 1
1
MG Motor to present all-new MG3 hybrid supermini at 2024 Geneva Motor Show
Sort by :
1 - 5 of 5 results
Australia - New car sales in 2025 by OEM, vehicle type
483 units in November represented a 15.7% decrease from the same period in 2024, SUV sales of 60,728 units represented a 0.2% increase, LCV sales of 21,017 units represented a 2.3% increase and MHCV sales of 3,809 units represented an 11.5% decrease.FCAI Chief Executive Tony Weber said that plug-in hybrid (PHEV)s continue to gain momentum because they give drivers the benefits of electric travel for daily use without range concerns. Petrol’s de...
Automotive Sales Data Updated at: 2025/12/05
UK - New car sales in 2025 by OEM, vehicle type
859 units), Kia Sportage (3,649 units), Nissan Qashqai (3,004 units), Nissan Juke (2,835 units) and VW T-Roc (2,768 units).Compared to last November, gasoline-engine car sales decreased 5.9% to 66,180 units (43.8% share), battery-electric vehicle (BEV) sales rose 3.6% to 39,965 units (26.4% share), hybrid electric (HEV) car sales rose 1.3% to 19,836 units (13.1% share), plug-in hybrid electric (PHEV) car sales jumped 14.8% to 18,005 units (11.9% ...
Automotive Sales Data Updated at: 2025/12/05
UK - New car sales in 2024 by OEM, vehicle type
ts), followed by Kia Sportage (47,163 units), Nissan Qashqai (42,418 units), Nissan Juke (34,454 units), and Tesla Model Y (32,862 units).Compared to 2023, gasoline-engine car sales were down 4.4% to 1,019,128 units (52.2% share), electric vehicles (EVs) jumped 21.4% to 381,970 units (19.6% share), hybrid vehicles (HEVs) rose 9.6% to 261,398 units (13.4% share), plug-in hybrid vehicles (PHEVs) increased 18.3% to 167,178 units (8.6% share), diesel...
Automotive Sales Data Updated at: 2025/07/03
Australia - New car sales in 2024 by OEM, vehicle type
2% 87,800 7.2% 14.1% 3 Mazda 7,256 7.6% 6,765 6.9% 7.3% 95,987 7.9% 100,008 8.2% -4.0% 4 Kia 6,302 6.6% 5,583 5.7% 12.9% 81,787 6.7% 76,120 6.3% 7.4% 5 Mitsubishi 5,754 6.0% 5,134 5.2% 12.1% 74,547 6.1% 63,511 5.2% 17.4% 6 Hyundai 5,025 5.2% 4,887 5.0% 2.8% 71,664 5.9% 75,183 6.2% -4.7% 7 MG 4,218 4.4% 3,834 3.9% 10.0% 50,592 4.1% 58,346 4.8% -13.3% 8 Isuzu Ute 3,558 3.7% 3,987 4.0% -10.8% 48,172 3.9% 45,341 3.7% 6.2% 9 Nissan 4,224...
Automotive Sales Data Updated at: 2025/07/02
Australia - Flash report, Automotive sales volume, 2023
2% 95,718 8.9% 4.5% 3 Ford 9,826 10.0% 6,165 7.0% 59.4% 87,800 7.2% 66,628 6.2% 31.8% 4 Kia 5,583 5.7% 5,630 6.4% -0.8% 76,120 6.3% 78,330 7.2% -2.8% 5 Hyundai 4,887 5.0% 4,434 5.0% 10.2% 75,183 6.2% 73,345 6.8% 2.5% 6 Mitsubishi 5,134 5.2% 4,927 5.6% 4.2% 63,511 5.2% 76,991 7.1% -17.5% 7 MG 3,834 3.9% 5,194 5.9% -26.2% 58,346 4.8% 49,582 4.6% 17.7% 8 Tesla 2,192 2.2% 2,266 2.6% -3.3% 46,116 3.8% 19,594 1.8% 135.4% 9 Subaru 3,623 3....
Automotive Sales Data Updated at: 2025/06/04
.jpg)
.jpg)
_thumbnail.jpg)
.jpg)
.jpg)
_thumbnail.jpg)
.jpg)
.jpg)
_thumbnail.jpg)


 Japan
Japan USA
USA Mexico
 Germany
 China (Shanghai)
 Thailand
 India
India