


Search Results by Category
All information related to {{ key_word }}.
AI Navigator will guide you. Click here for information about {{ key_word }}.
Sort by :
1 - 7 of 7 results
China - Flash report, Automotive sales volume, 2022
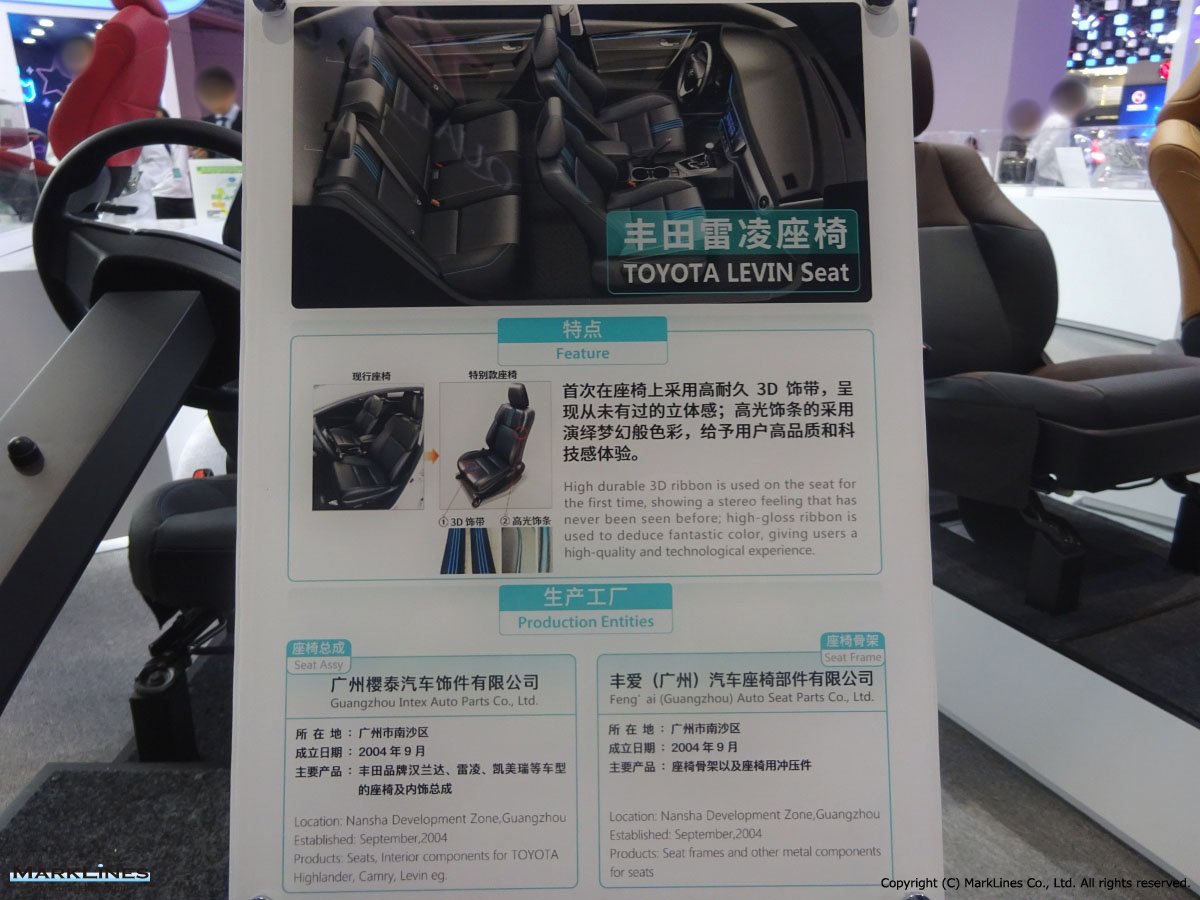
rand Model Apr. 2022 Apr. 2021 Y-o-Y Jan.- Apr. 2022 Jan.- Apr. 2021 Y-o-Y 1 Wuling Wuling Hongguang MINIEV 27,181 29,251 -7.1% 133,902 125,925 6.3% 2 BYD Auto Song DM 20,181 1,442 1299.5% 78,030 2,858 2630.2% 3 Nissan Bluebird Sylphy/Sylphy 18,152 22,128 -18.0% 90,653 80,342 12.8% 4 Toyota Levin 18,087 20,770 -12.9% 73,768 83,973 -12.2% 5 Toyota Camry 16,452 17,234 -4.5% 85,356 56,986 49.8% 6 Haval Haval H6 16,201 28,019 -42.2% 93,02...
Automotive Sales Data Updated at: 2025/06/04
China - Flash report, Automotive sales volume, 2021
ker/Brand Model Jul. 2021 Jul. 2020 Y-o-Y Jan.- Jul. 2021 Jan.- Jul. 2020 Y-o-Y 1 Toyota Corolla/New Corolla 32,490 32,184 1.0% 217,095 185,414 17.1% 2 Wuling Wuling Hongguang MINIEV 26,905 7,348 266.2% 209,672 7,348 2753.5% 3 Haval Haval H6 25,746 23,723 8.5% 222,431 145,494 52.9% 4 Toyota Levin 23,174 20,186 14.8% 155,397 114,441 35.8% 5 Tesla Model 3 22,614 11,014 105.3% 138,177 40,698 239.5% 6 VW Lavida 22,433 35,925 -37.6% 203,42...
Automotive Sales Data Updated at: 2025/06/04
China - Flash report, Sales volume, 2020
76 14,848 54.1% 140,346 227,165 -38.2% 6 Nissan 14th Sylphy/Sylphy 22,151 10,160 118.0% 114,361 10,160 1025.6% 7 VW Bora 21,947 26,704 -17.8% 153,649 162,892 -5.7% 8 VW Sagitar 21,393 22,240 -3.8% 139,289 137,028 1.7% 9 Changan/Chana CS75 21,358 10,953 95.0% 130,911 79,933 63.8% 10 Toyota Levin 20,186 22,811 -11.5% 114,441 114,977 -0.5% Source: MarkLines Data Center *The below data may differ from the sales volume by make (shipped fr...
Automotive Sales Data Updated at: 2025/06/04
China - Flash report, Sales volume, 2019
% 167,605 208,618 -19.7% 4 VW New Bora (Model X) 28,307 8,660 226.9% 129,937 149,036 -12.8% 5 Buick Excelle GT 26,555 23,411 13.4% 193,663 152,560 26.9% 6 Haval Haval H6 25,097 26,697 -6.0% 230,689 271,392 -15.0% 7 Wuling Wuling Hongguang 25,017 23,196 7.9% 219,161 282,442 -22.4% 8 Toyota Levin 22,496 16,619 35.4% 137,473 120,671 13.9% 9 VW New Santana 20,517 15,890 29.1% 159,167 162,578 -2.1% 10 Honda Civic 20,378 18,920 7.7% 157,8...
Automotive Sales Data Updated at: 2020/05/12
China - Flash report, Sales volume, 2018
-digit sales growth, and Nissan maintained its top spot in the rankings.Nissan announced that it sold 135,037 units in China, a 13.1% y/y increase resulting from strong sales of the Teana, Sylphy, Murano, Venucia D60, and Venucia T70.Toyota sold 127,500 vehicles, a 24.5% y/y increase. The Camry and Levin product lines saw significant sales growth.Honda announced record January sales of 126,174 vehicles in China, a y/y increase of 10.9%. By model,...
Automotive Sales Data Updated at: 2019/01/31
China - Flash report, Sales volume, 2017
X-Trail, Qashqai, Murano, KICKS, TIIDA, Venucia D60, and Venucia T90. The company’s year-to-date (YTD) sales from January reached 1,335,417 vehicles, up 12% y/y.Toyota sold 109,600 vehicles, a 1.3% y/y decline. The automaker enjoyed continuing sales increases for models including the Corolla and Levin. Toyota’s YTD sales reached 1,182,600 vehicles, up 7.5% y/y.Honda announced record November sales of 140,972 vehicles in China, a y/y increase...
Automotive Sales Data Updated at: 2018/07/24
China - Flash report, Sales volume, 2016
oyota sold approximately 1,214,200 vehicles in 2016, which was an 8.2% rise y/y. Although it was overtaken by Honda and fell to the third place, the company achieved its yearly target of 1.15 million vehicles and broke its record. The automaker enjoyed favorable sales of models like the Corolla and Levin that are eligible for the small car tax break throughout the year. Toyota’s December sales totaled 113,800 vehicles, a 6.7% decrease y/y.Honda...
Automotive Sales Data Updated at: 2017/01/18

 Japan
Japan USA
USA Mexico
 Germany
 China (Shanghai)
 Thailand
 India
India