


Search Results by Category
All information related to {{ key_word }}.
AI Navigator will guide you. Click here for information about {{ key_word }}.
Images
 3
3
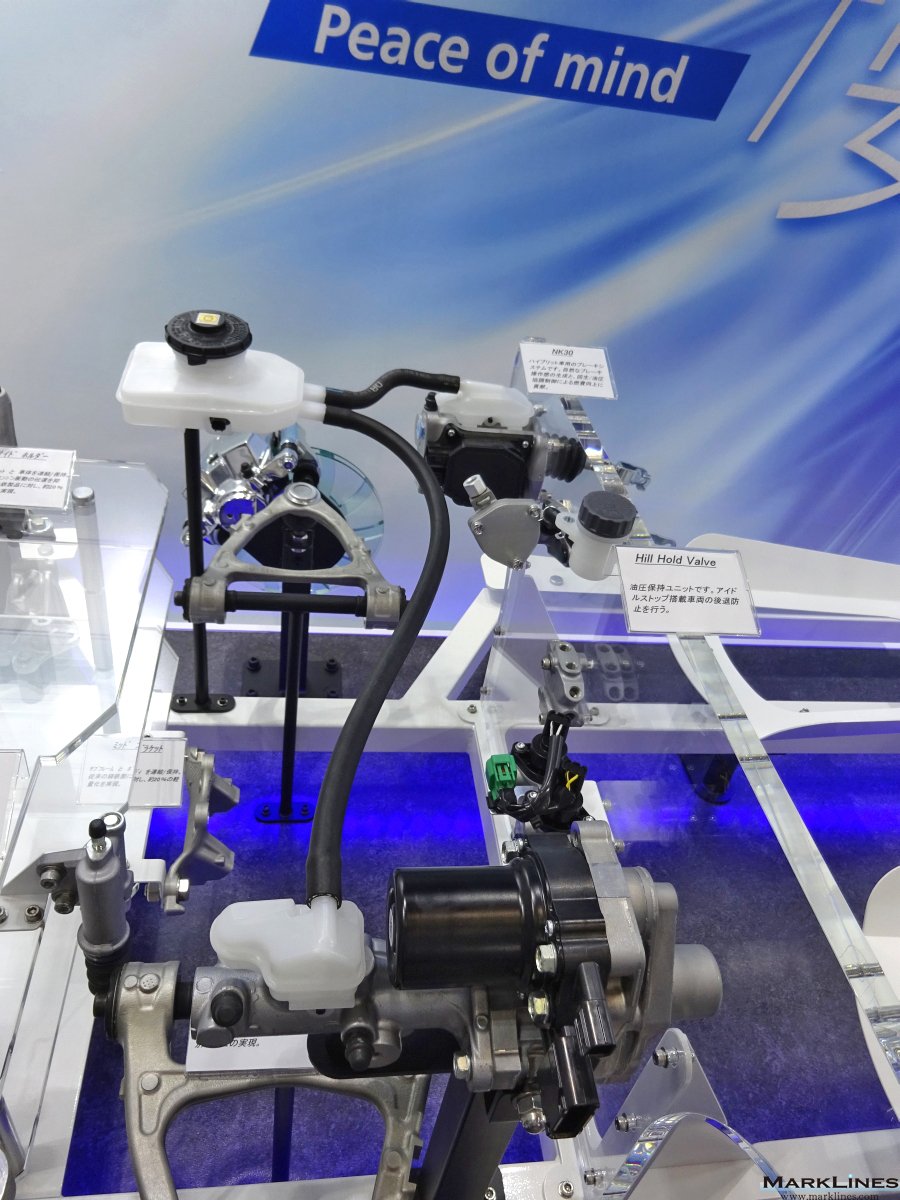
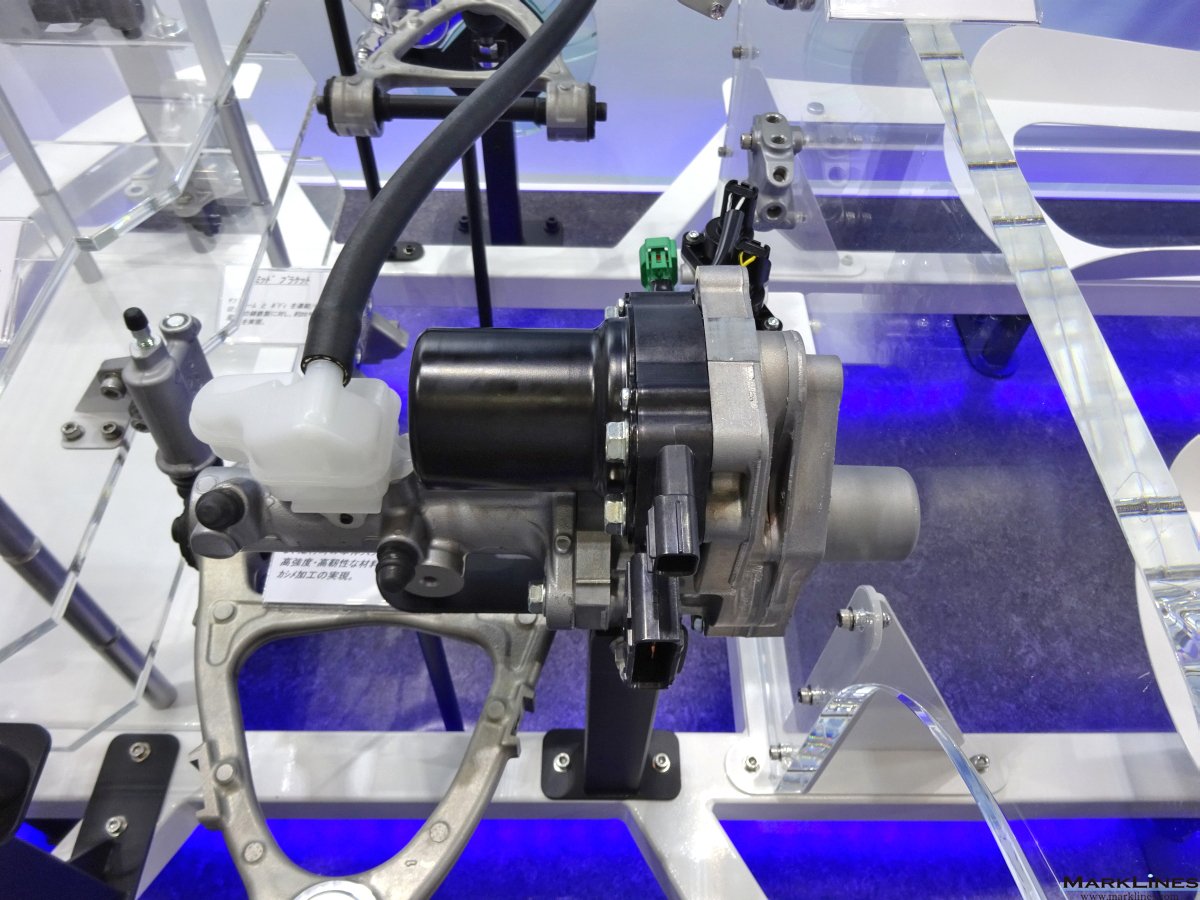
Electric servo brake -NK30-
 5
5
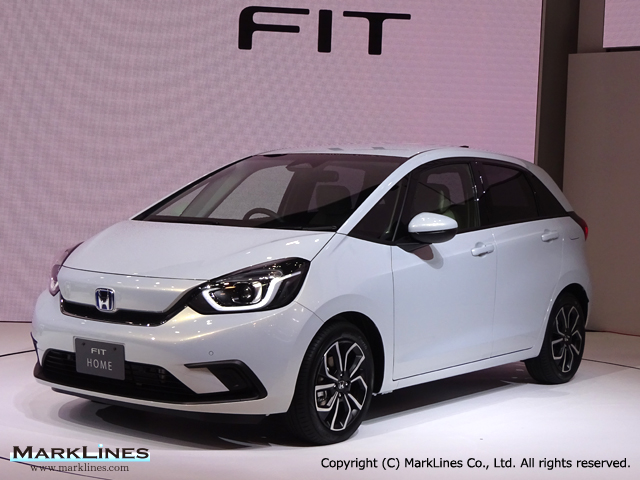
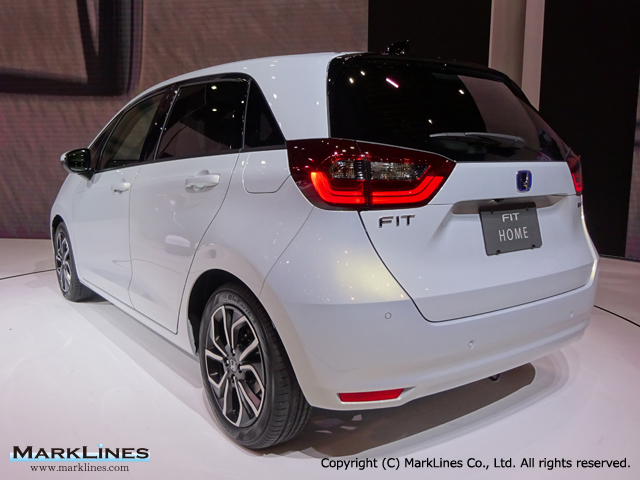
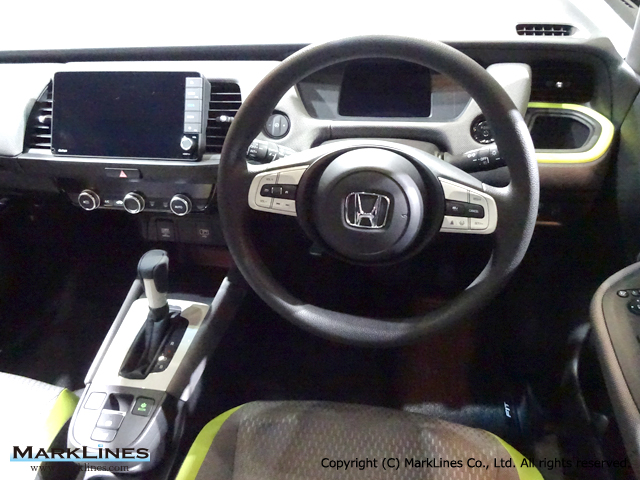
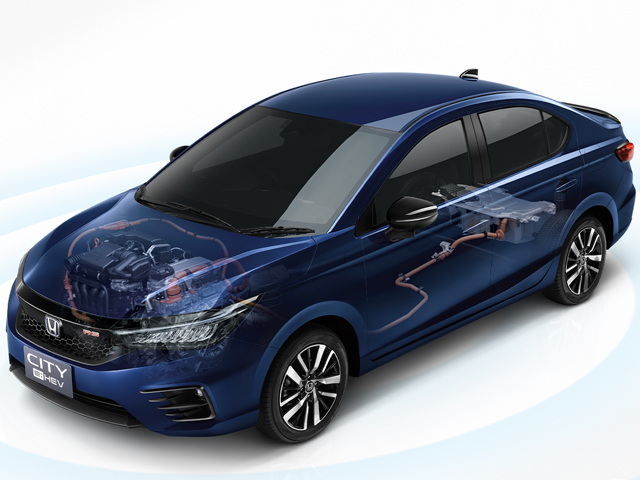
Fit/Jazz/City Hybrid
 1
1
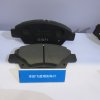
Brake pads
 3
3
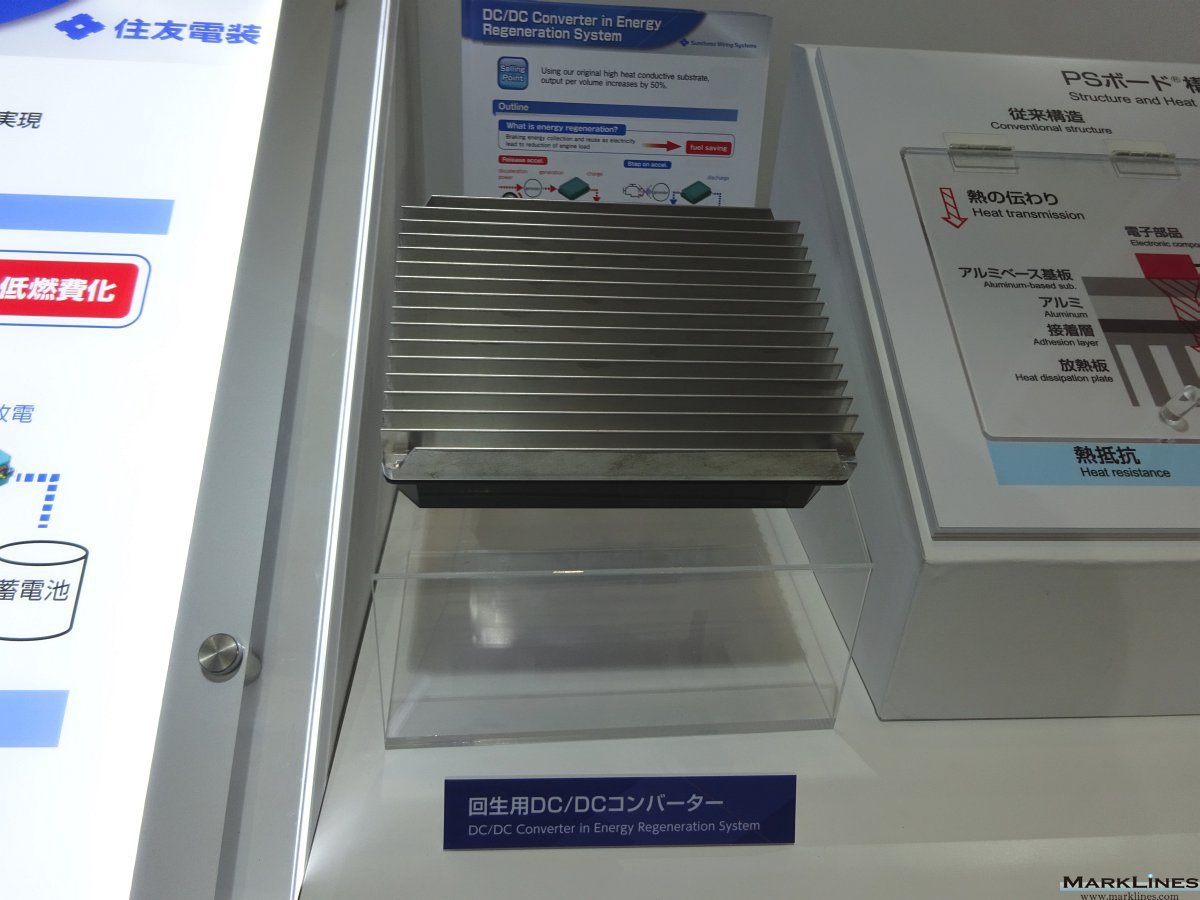
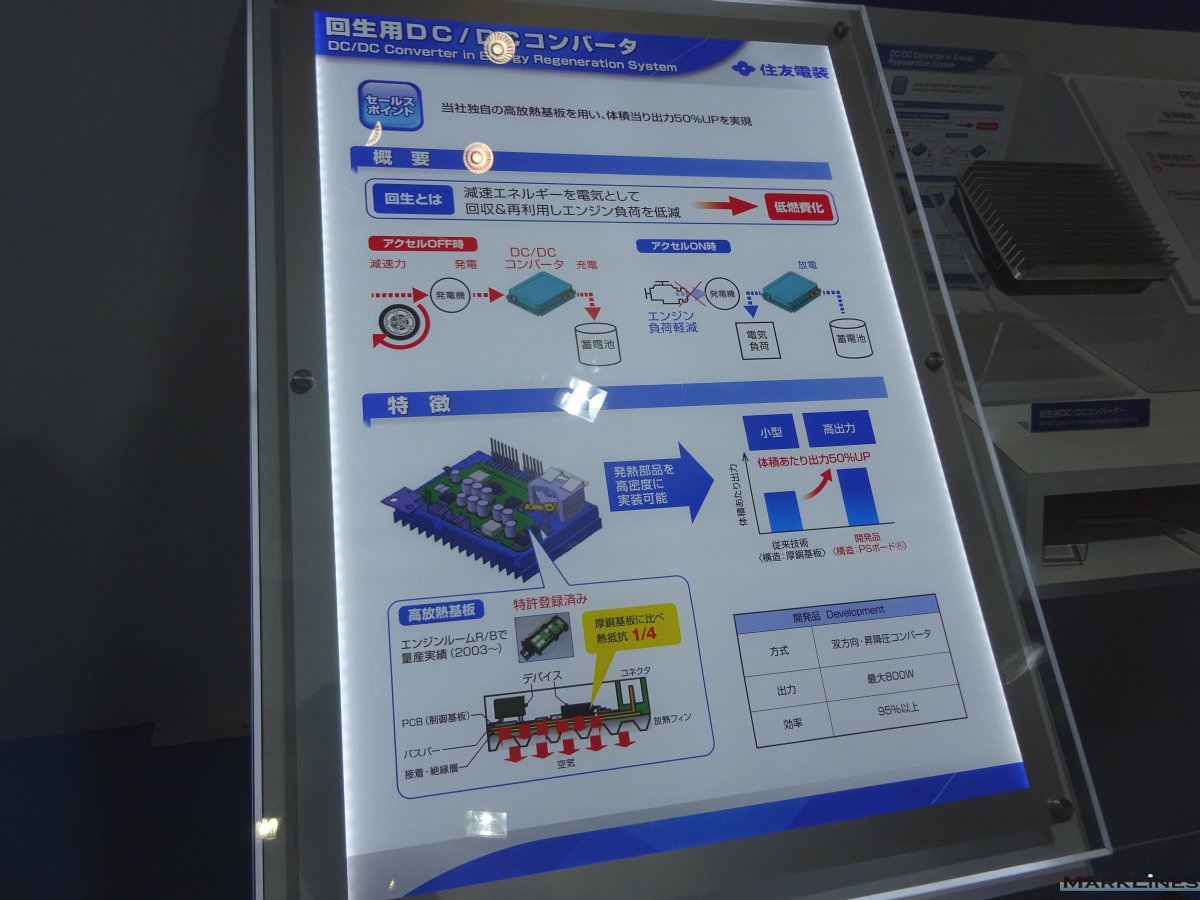
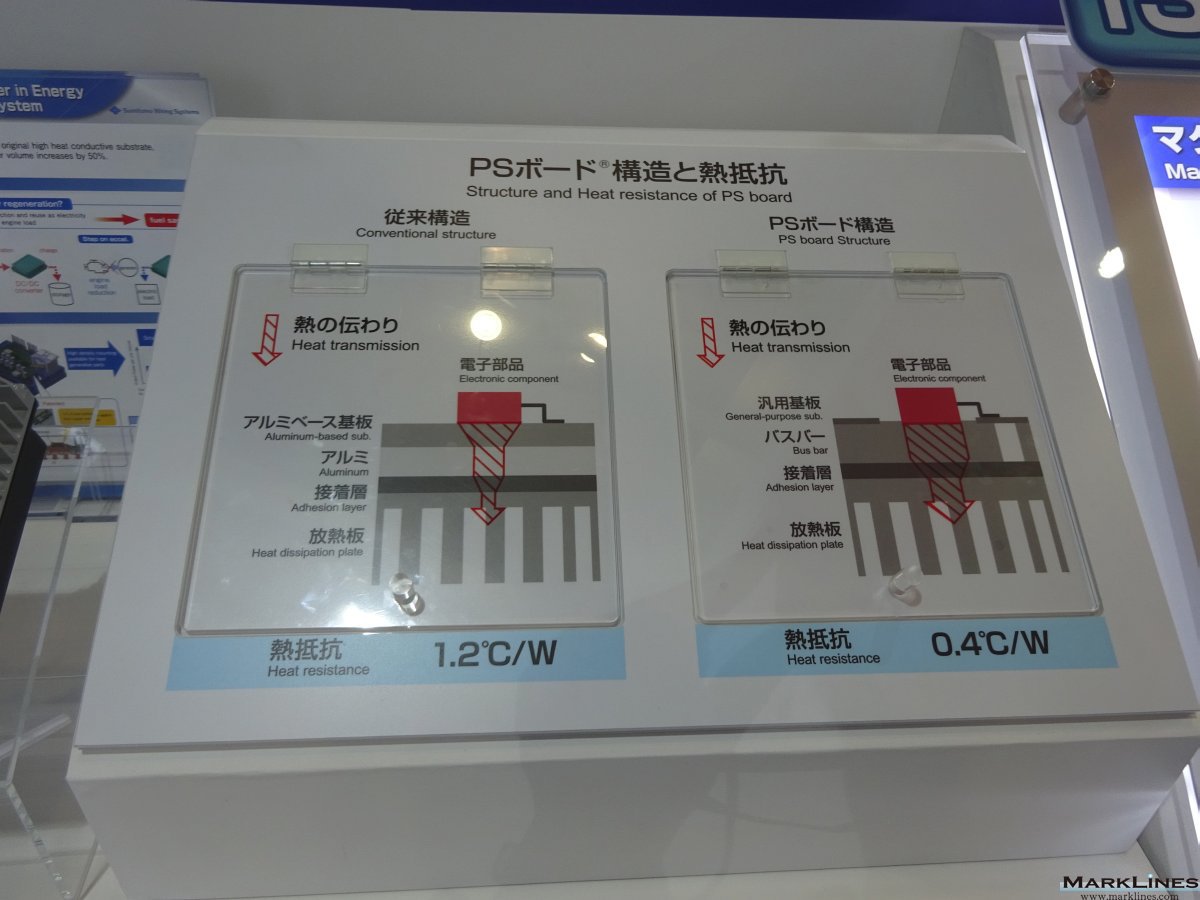
DC/DC converter in energy regeneration system
 3
3
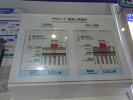
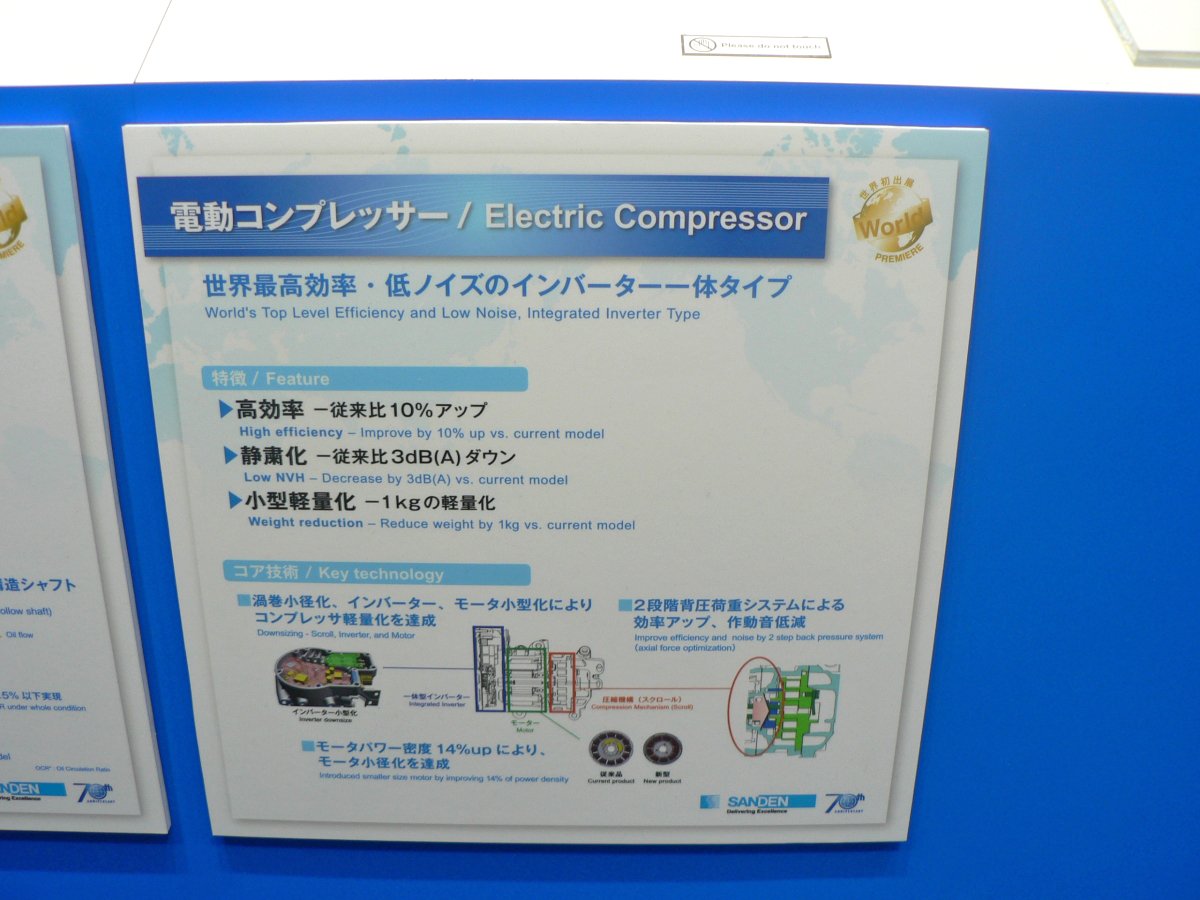
Electric Compressor
 3
3
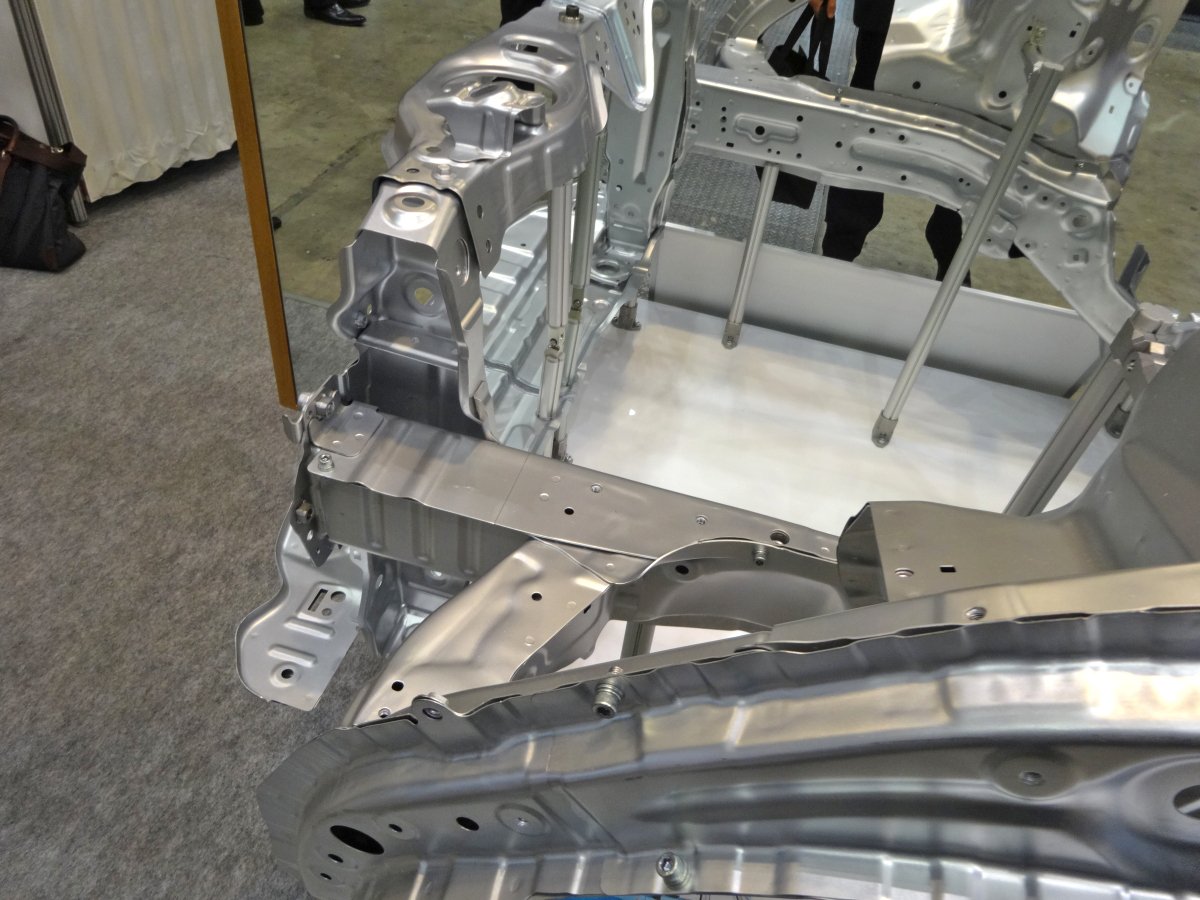
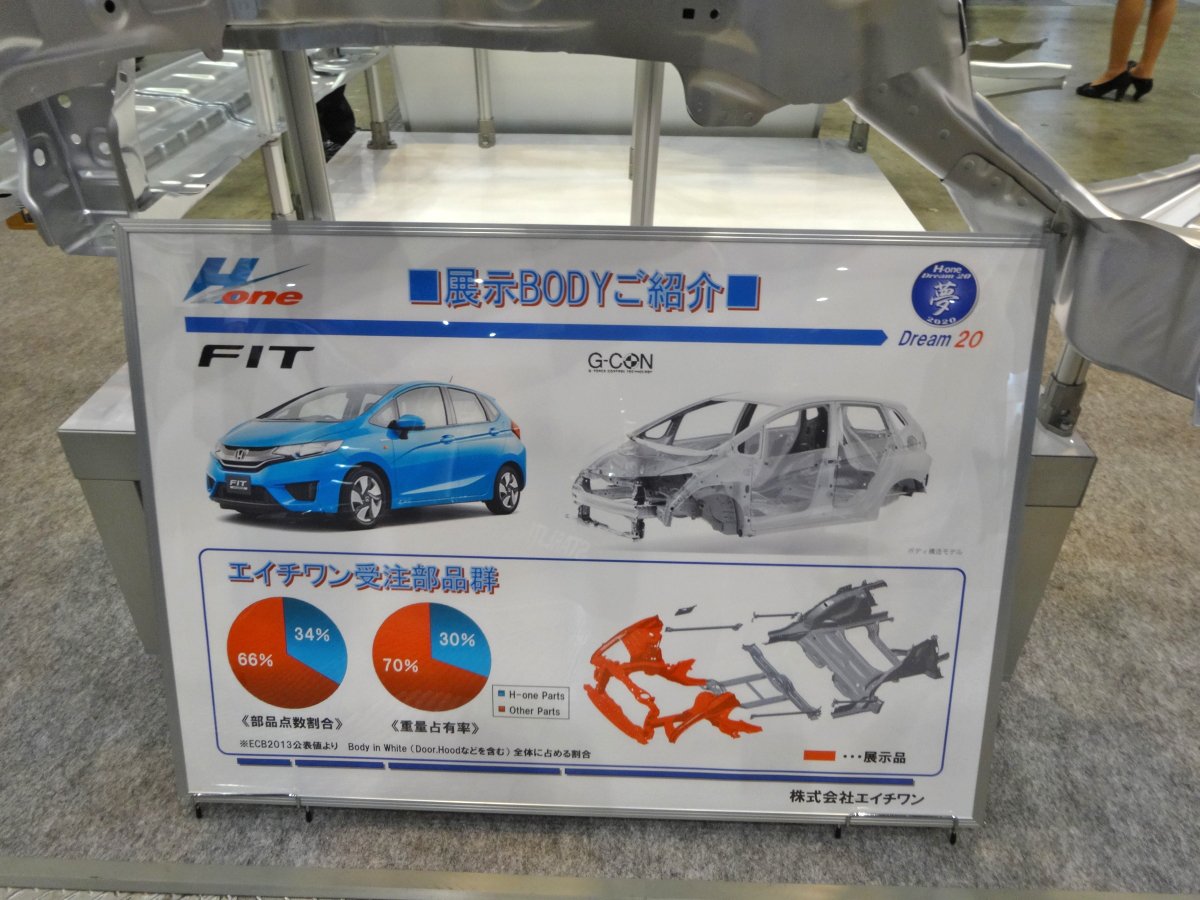
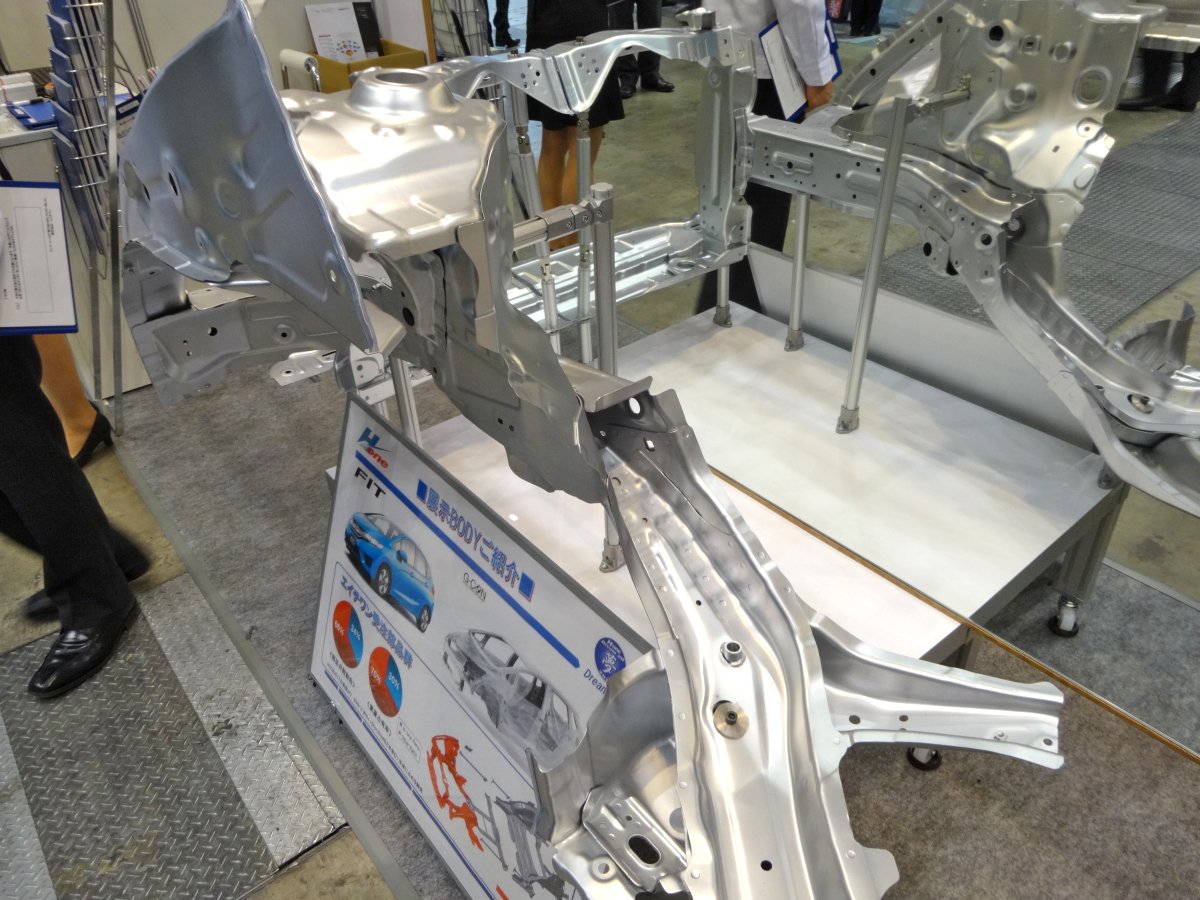
Automobile Framework Parts
 5
5
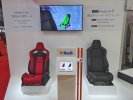
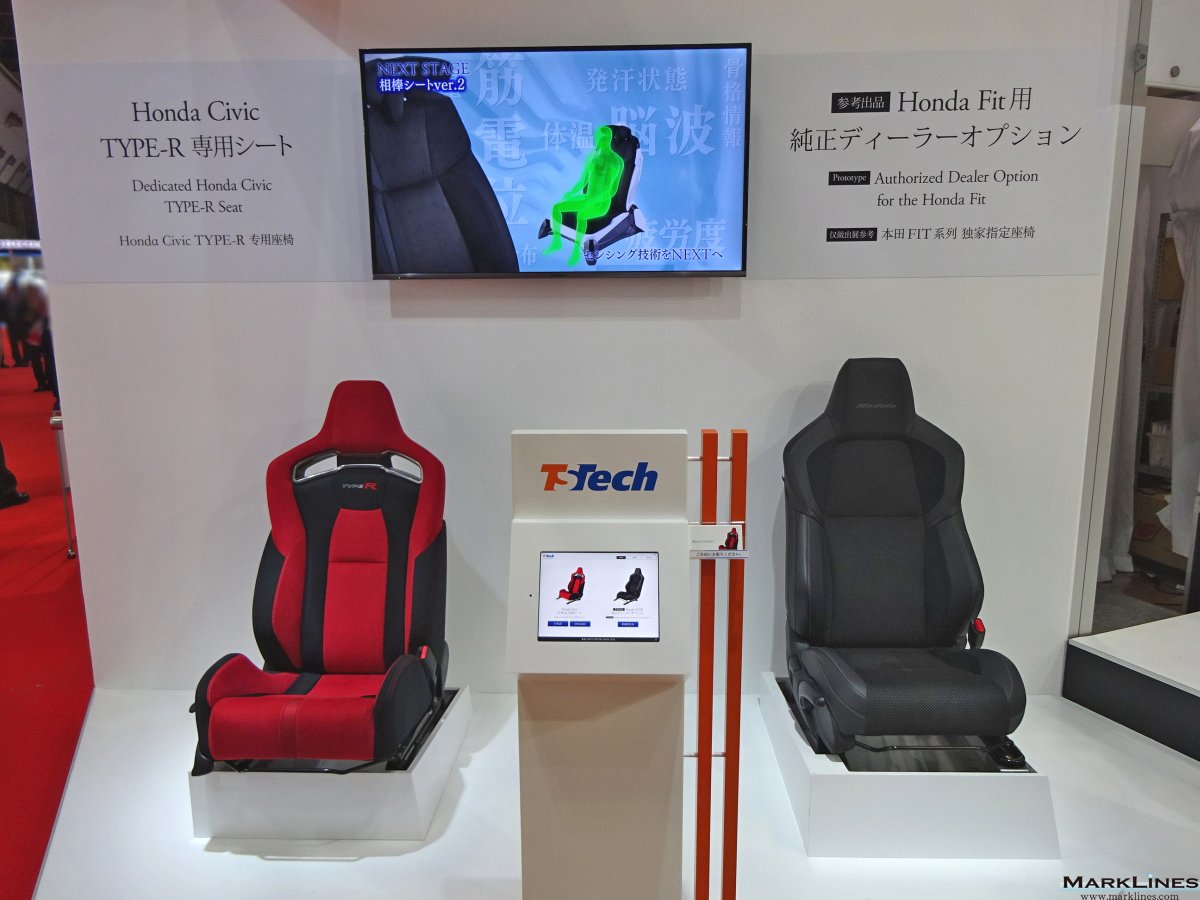
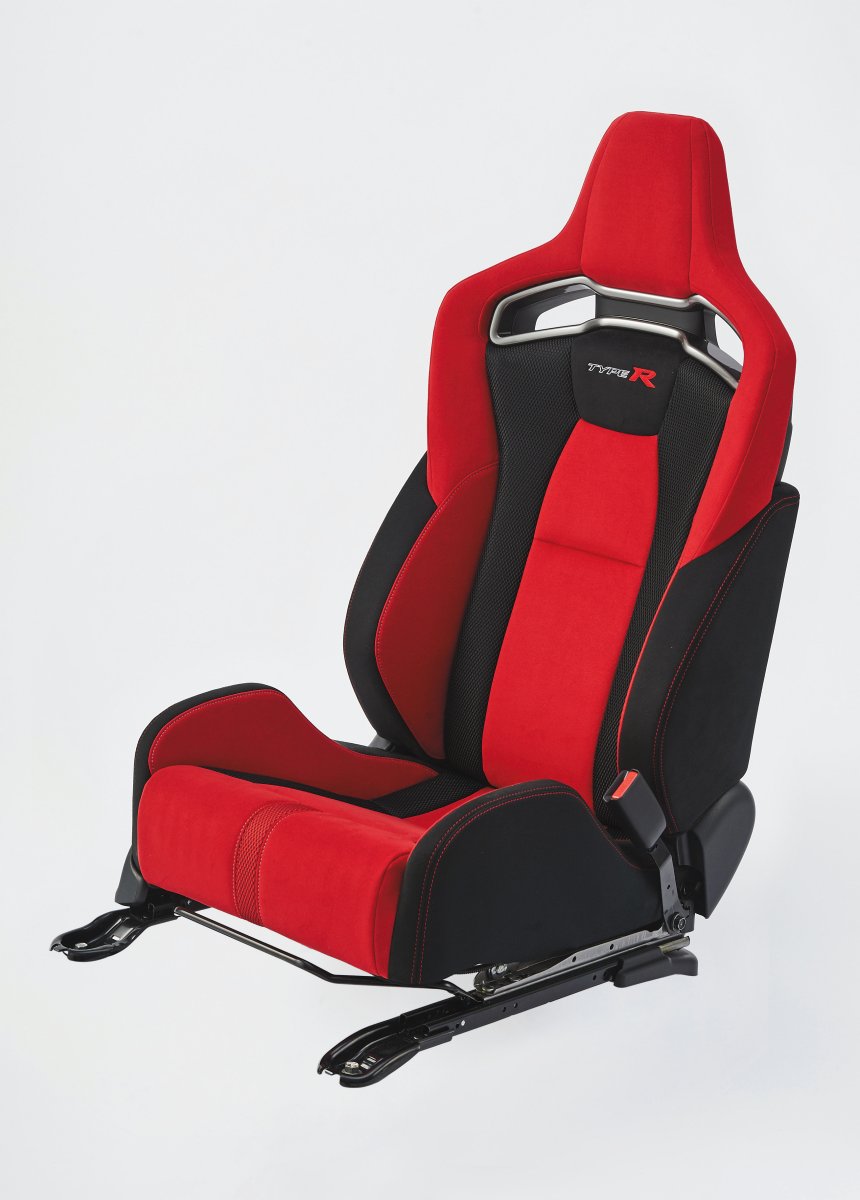
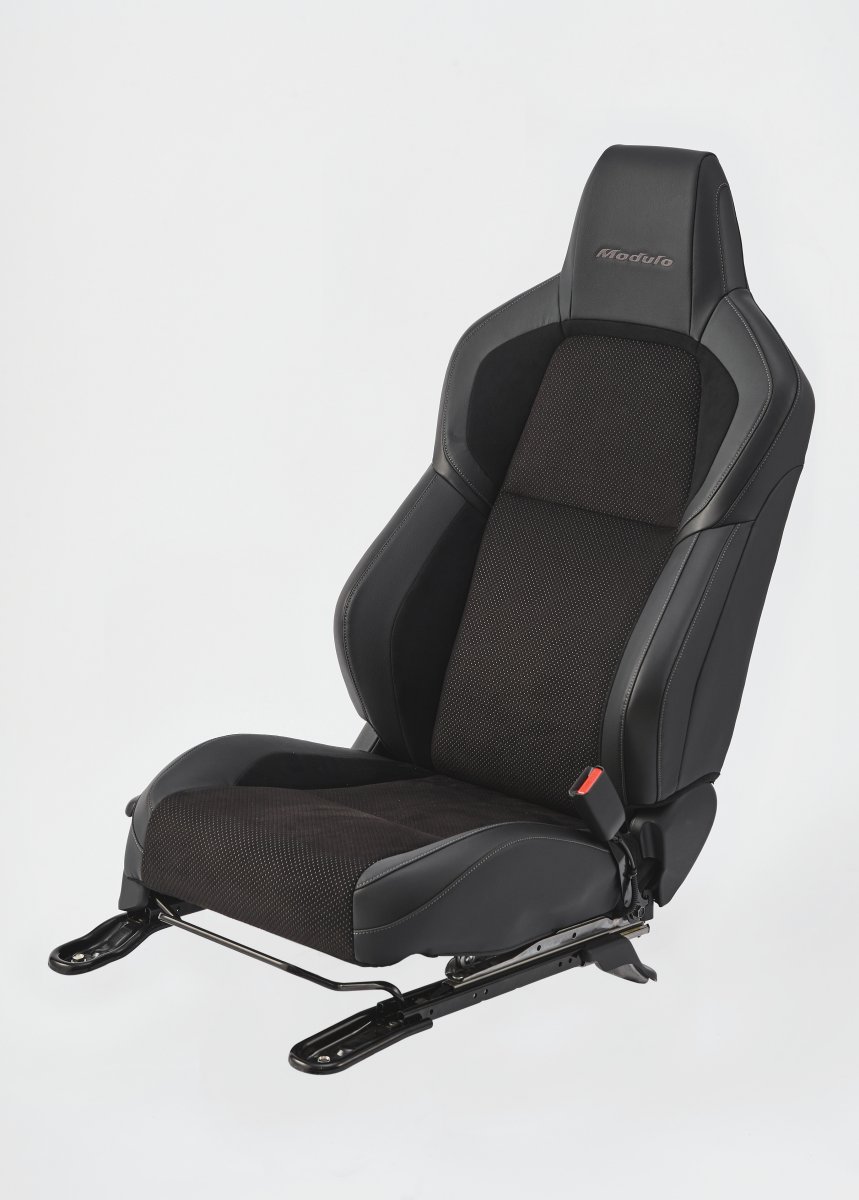
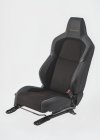
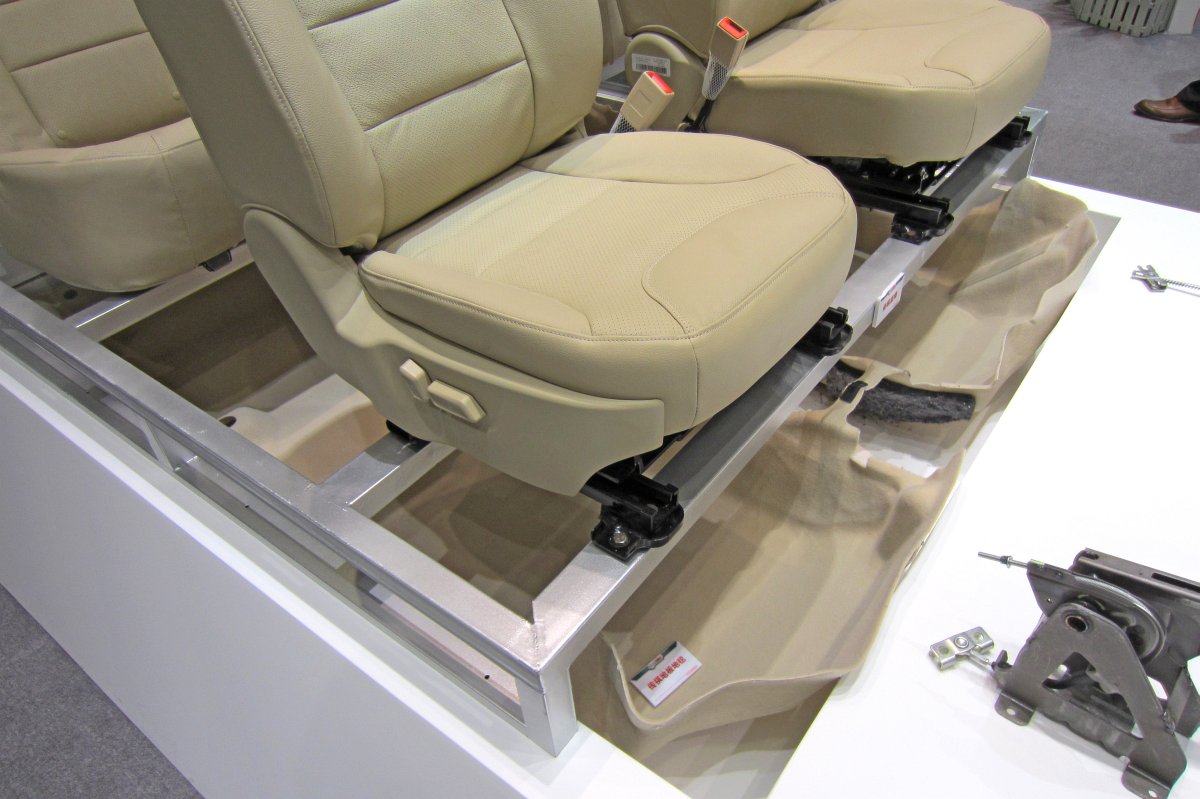
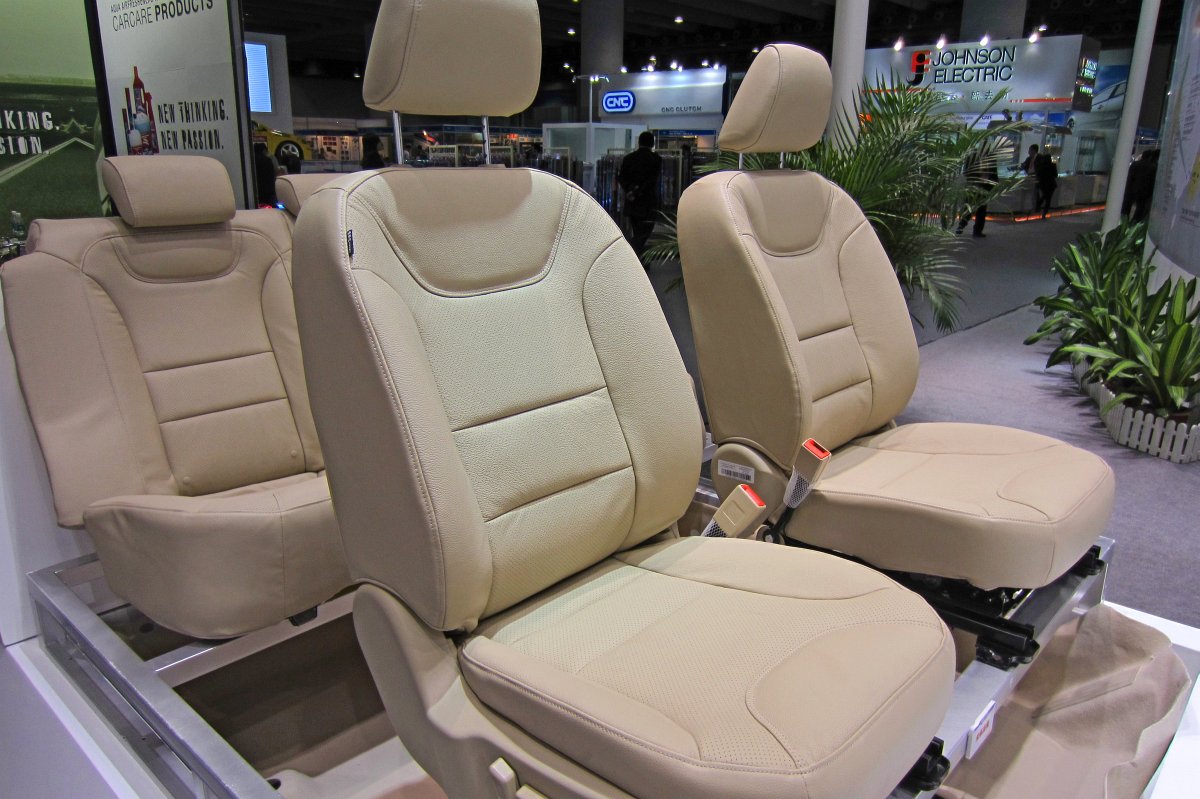
Front seats
 2
2
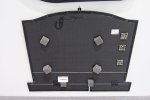
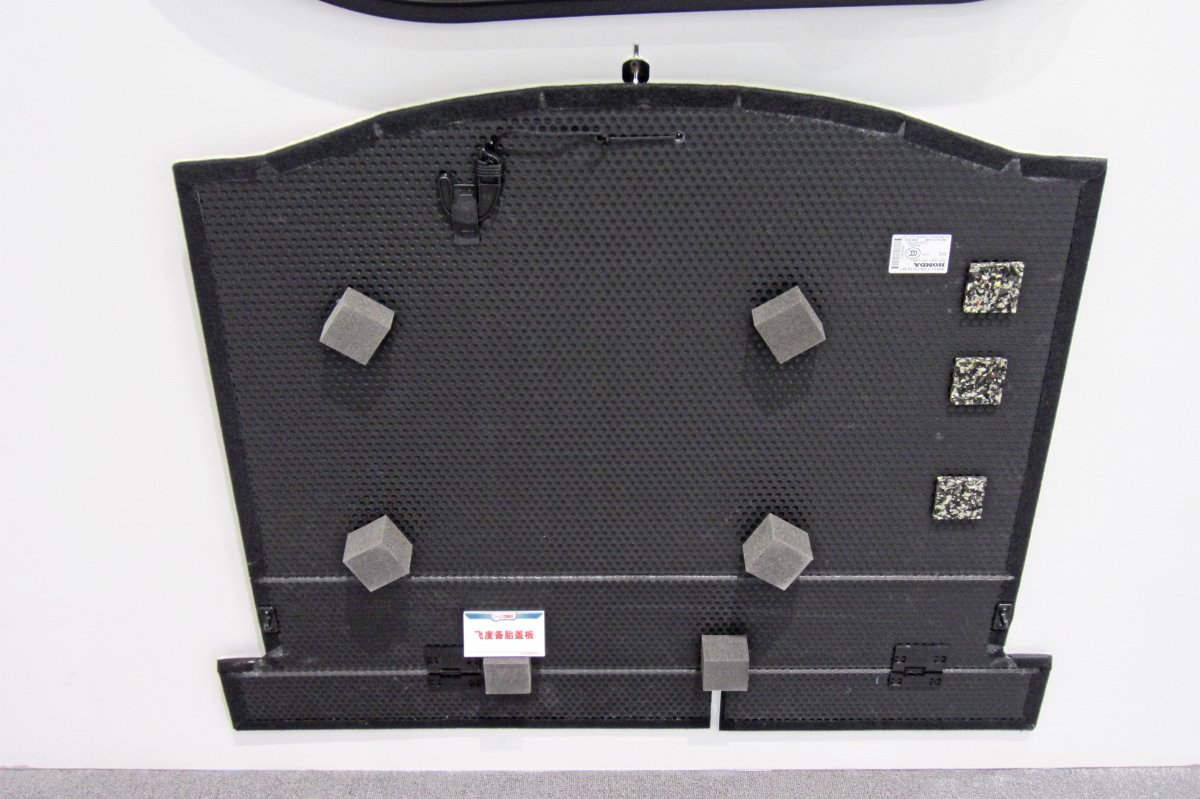
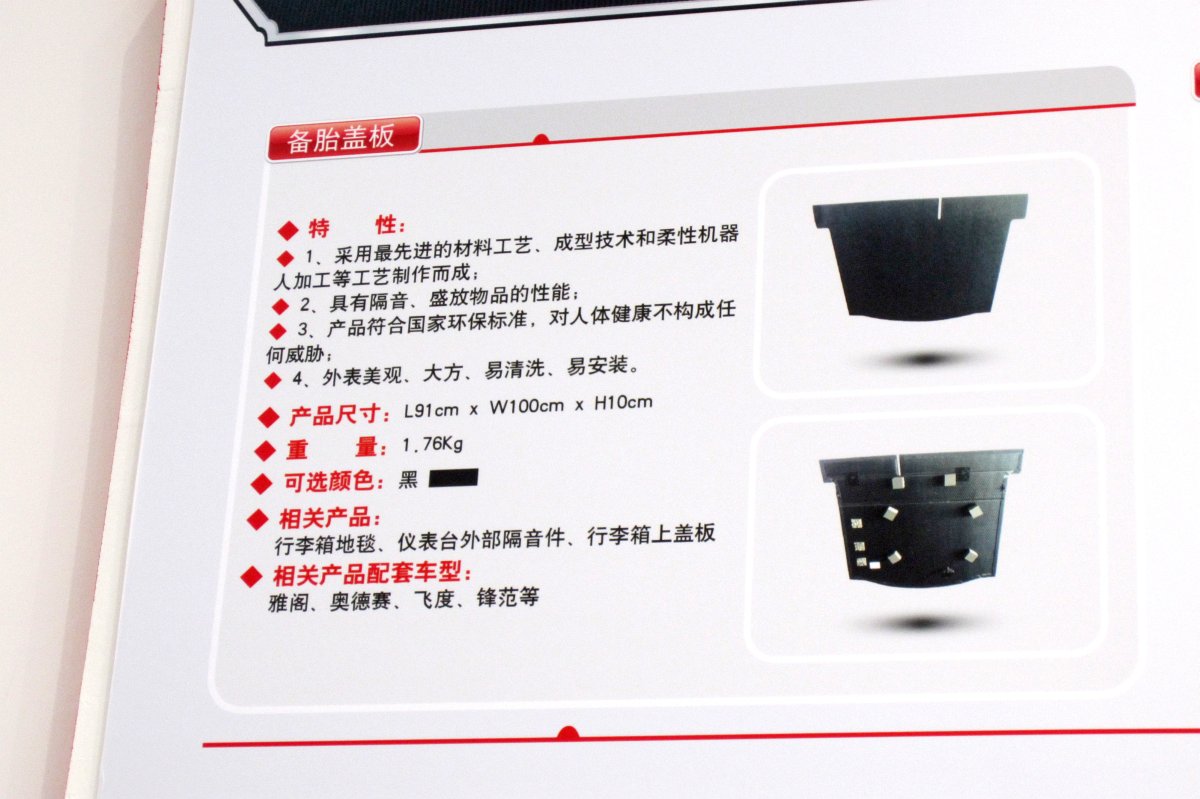
[Wuhan Linjun Co., Ltd.] Spare wheel cover
 2
2
[Guangzhou GAC-GSK Auto Interiors R&D Co., Ltd.] Floor carpet
 2
2
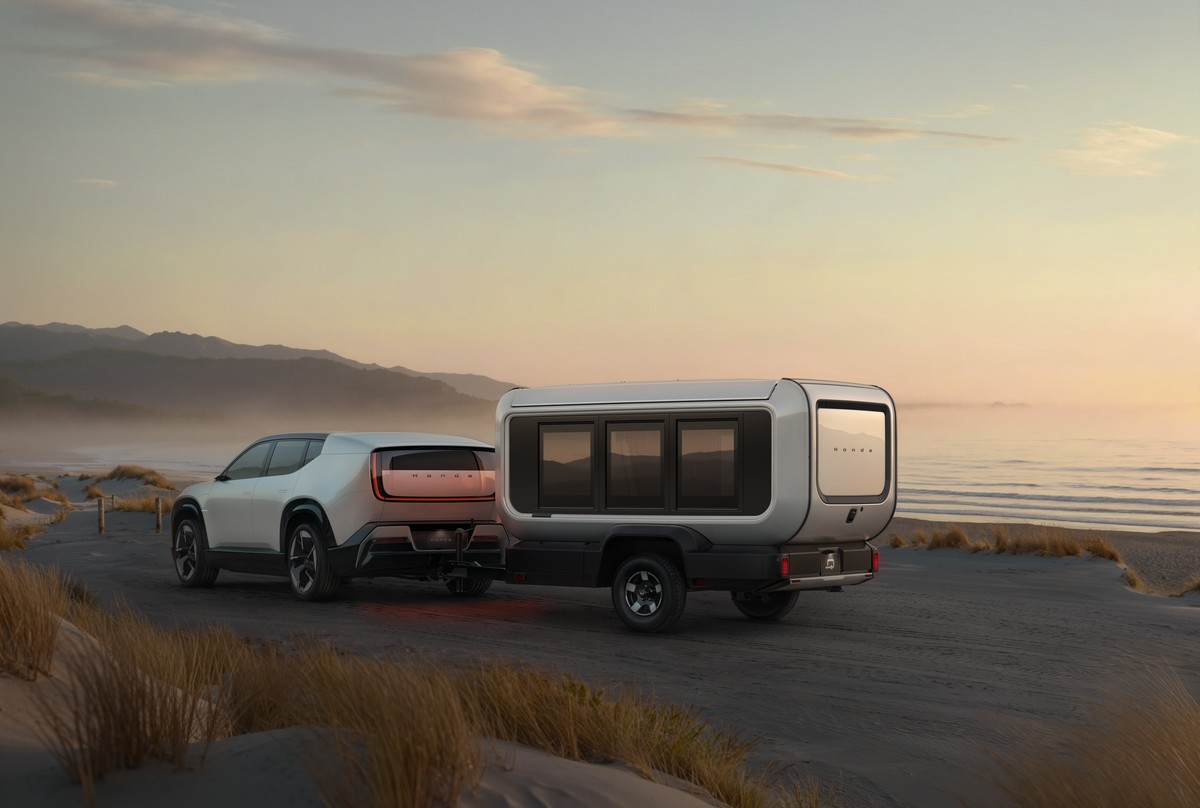
Honda unveils Base Station Prototype as travel trailer for its SUVs
Sort by :
1 - 11 of 11 results
Data changes for Sales Statistics
ssan" to "Venucia". June 19, 2014 The maker/brand, Chinese OEMs, and manufacturers of "Liebao" have been changed. Refer to the chart below for details. Download June 10, 2014 Descriptions of some of groups have been changed. Maker/Brand Previous Group New Group Everus, CIIMO Other Groups Honda Baojun Other Groups GM Group October 23, 2013 Porsche has been classified as part of the VW group since 2013. May 16, 2013 The maker/b...
Automotive Sales Data Updated at: 2026/06/18
Thailand - Flash report, Sales volume, 2020
the coronavirus pandemic as well as the 37th Thailand Motor Expo which helped boosting up local auto market. 2020 full year vehicle sales in Thailand declined 21.4% year over year to 792,146 units.By brand sales in 2020, Toyota was down 26.6% to 243,763 units. Isuzu was up 7.7% to 181,194 units and Honda was down 26.1% to 93,041 units. Mitsubishi sales were down 34.9% to 57,409 units, and Nissan sales were down 30.8% to 44,558 units.By body type ...
Automotive Sales Data Updated at: 2025/06/04
Japan - Flash report, Sales volume, 2020
s Association, Japan Light Motor Vehicle and Motorcycle AssociationNon-mini vehicles Total (Breakdown by vehicle type) Brands 2020 2019 Y-o-Y 2020 2019 Y-o-Y Dec. Share Dec. Share Jan.-Dec. Share Jan.-Dec. Share Toyota 116,630 47.8% 105,667 46.6% 10.4% 1,423,151 49.4% 1,510,741 46.0% -5.8% Honda 20,989 8.6% 17,568 7.7% 19.5% 293,800 10.2% 357,242 10.9% -17.8% Nissan 21,041 8.6% 19,349 8.5% 8.7% 266,289 9.2% 367,514 11.2% -27.5% Mazda...
Automotive Sales Data Updated at: 2025/06/04
China - Flash report, Sales volume, 2020
ion methods. Passenger Car retail sales by Chinese Makers Top10 - Maker Dec. 2020 (10,000) Y-o-Y 1 FAW-VW 24.0 5.3% 2 SAIC GM 16.2 30.3% 3 SAIC VW 16.2 -26.7% 4 SAIC-GM-Wuling 15.2 9.6% 5 Dongfeng Nissan 14.4 0.5% 6 Geely Automobile 14.2 12.3% 7 Great Wall 12.2 40.6% 8 Dongfeng Honda 11.1 46.7% 9 GAC Honda 9.8 45.7% 10 Chery Automobile 9.3 28.4% Source: CPCA Four Japanese OEMs announce Chinese sales figures for Decembe...
Automotive Sales Data Updated at: 2025/06/04
China - Flash report, Sales volume, 2019
y 26,950 56,339 -52.2% 346,551 481,216 -28.0% 6 VW Sagitar 31,789 22,455 41.6% 307,323 309,902 -0.8% 7 Buick Excelle GT 26,083 18,531 40.8% 279,280 261,920 6.6% 8 VW New Bora (Model X) 31,274 2,469 1166.7% 272,266 169,782 60.4% 9 VW New Santana 24,900 17,933 38.9% 251,174 265,869 -5.5% 10 Honda Civic 19,031 22,195 -14.3% 243,966 218,132 11.8% Source: MarkLines Data Cente *The below data may differ from the sales volume by make (shipp...
Automotive Sales Data Updated at: 2020/05/12
Thailand - Flash report, Sales volume, 2019
to MarkLines Data Center, December vehicle sales in Thailand declined 21.4% year over year to 89,285 units. 2019 full year vehicle sales in Thailand declined 3.3% year over year to 1,007,552 units.By brand sales in 2019, Toyota was up 5.5% to 331,878 units. Isuzu was down 5.4% to 168,215 units and Honda was down 1.9% to 125,833 units. Mitsubishi sales were up 4.4% to 88,244 units, and Nissan sales were down 11.0% to 64,414 units.By body type sal...
Automotive Sales Data Updated at: 2020/01/29
Japan - Flash report, Sales volume, 2019
i vehicles Total (Breakdown by vehicle type) Brands 2019 2018 Y-o-Y 2019 2018 Y-o-Y Dec. Share Dec. Share Jan.-Dec. Share Jan.-Dec. Share Toyota 105,667 46.6% 107,317 42.8% -1.5% 1,510,741 46.0% 1,471,079 43.9% 2.7% Nissan 19,349 8.5% 24,148 9.6% -19.9% 367,514 11.2% 426,323 12.7% -13.8% Honda 17,568 7.7% 27,180 10.8% -35.4% 357,242 10.9% 377,695 11.3% -5.4% Mazda 13,086 5.8% 12,301 4.9% 6.4% 166,681 5.1% 178,739 5.3% -6.7% Suzuki ...
Automotive Sales Data Updated at: 2020/01/23
Thailand - Flash report, Sales volume, 2018
MarkLines Data Center, December vehicle sales in Thailand increased 8.7% year over year to 113,343 units. 2018 full year vehicle sales in Thailand increased 19.2% year over year to 1,039,158 units.By brand sales in 2018, Toyota was up 31.3% to 314,498 units. Isuzu was up 10.8% to 177,864 units and Honda was up 0.4% to 128,290 units. Mitsubishi sales were up 21.3% to 84,560 units, and Nissan sales were up 21.2% to 72,394 units.By body type sales ...
Automotive Sales Data Updated at: 2019/03/22
China - Flash report, Sales volume, 2018
the local plant) to be released later on our data for monthly sales volume.This is due to the difference in calculation methods. Four Japanese OEMs announce Chinese sales figures for DecemberOn January 5, four Japanese OEMs have announced their sales results in China for December 2018. Toyota and Honda achieved an increase in sales.On January 4, Nissan announced that it sold 176,191 units in China, reflecting a 4.4% y/y decline. December sales ...
Automotive Sales Data Updated at: 2019/01/31
Thailand - Flash report, Sales volume, 2017
MarkLines Data Center, December vehicle sales in Thailand increased 20.1% year over year to 104,302 units. 2017 full year vehicle sales in Thailand increased 13.4% year over year to 871,644 units.By brand sales in 2017, Toyota was down 2.0% to 239,551 units. Isuzu was up 12.1% to 160,550 units and Honda was up 19.0% to 127,768 units. Mitsubishi sales were up 25.9% to 69,737 units, and Nissan sales were up 39.9% to 59,709 units.By body type sales...
Automotive Sales Data Updated at: 2018/07/24
Japan - Flash report, Sales volume, 2017
ni vehicles Total (Breakdown by vehicle type) Brands 2017 2016 Y-o-Y 2017 2016 Y-o-Y Dec. Share Dec. Share Jan.-Dec. Share Jan.-Dec. Share Toyota 119,900 45.7% 122,217 46.1% -1.9% 1,556,301 45.9% 1,498,758 46.2% 3.8% Nissan 25,484 9.7% 33,024 12.5% -22.8% 408,560 12.0% 385,623 11.9% 5.9% Honda 27,179 10.4% 28,680 10.8% -5.2% 381,835 11.3% 383,820 11.8% -0.5% Mazda 13,642 5.2% 8,464 3.2% 61.2% 169,928 5.0% 162,274 5.0% 4.7% Subaru 9...
Automotive Sales Data Updated at: 2018/07/24


 Japan
Japan USA
USA Mexico
 Germany
 China (Shanghai)
 Thailand
 India
India