


Search Results by Category
All information related to {{ key_word }}.
AI Navigator will guide you. Click here for information about {{ key_word }}.
Images
 3
3
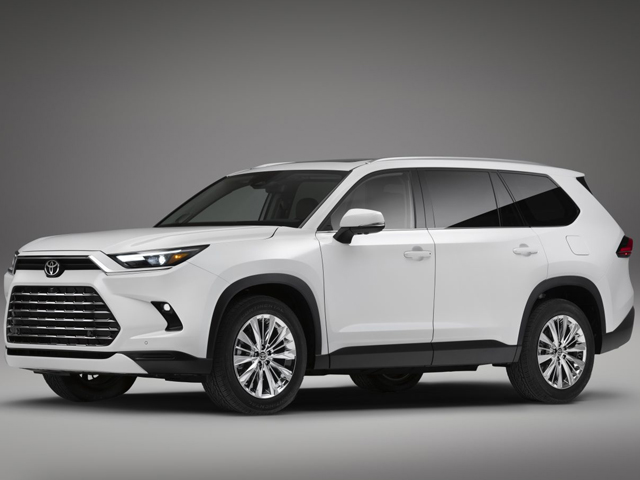
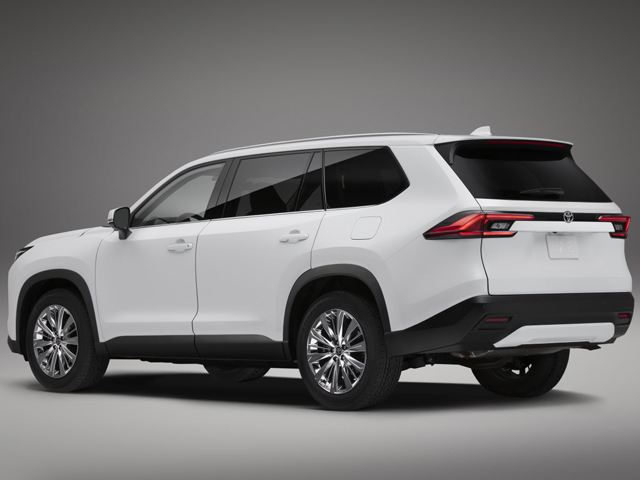
Grand Highlander Hybrid
 1
1
Toyota investing USD 1 billion in Kentucky, Indiana plants
 1
1
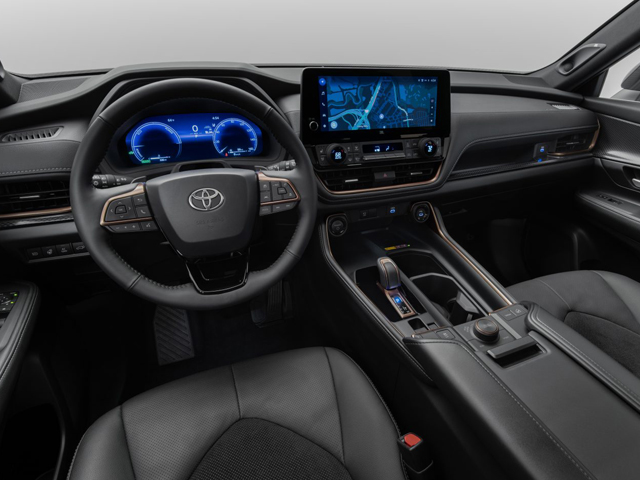
Toyota reveals interior of new 3-row SUV ahead of February 10 debut
 1
1
Toyota Grand Highlander adds affordable LE grade for 2025 in US
 2
2
Toyota to invest USD 1.4 billion at Princeton, Indiana plant
 1
1
Lexus TX production starts at Toyota Indiana plant
Sort by :
1 - 8 of 8 results
China - New car sales in 2026 by OEM, model, vehicle type
e(%) Y-o-Y(%) Sedan/Hatchback 75.0 28.5 -23.4 360.8 29.6 -21.9 MPV 8.5 3.2 -15.8 38.6 3.2 -17.8 SUV 139.2 52.9 11.6 621.1 50.9 7.9 Mini Van 2.6 1.0 4.0 11.3 0.9 -25.3 Passenger Cars Total 225.3 85.7 -4.2 1,031.8 84.5 -6.2 Commercial Vehicles Total 37.6 14.3 12.5 188.8 15.5 7.7 Grand Total 262.9 100.0 -2.1 1,220.7 100.0 -4.2 Source:Created by MarkLines based on press releaseNew vehicle sales by brands (Factory shipments)...
Automotive Sales Data Updated at: 2026/06/12
USA - New car sales in 2026 by OEM, model, vehicle type
Share 0.0% 0.0% 0.0 pt 0.0% 0.0% 0.0 pt Polestar *2 Total 281 518 -45.8% 3,015 3,112 -3.1% Share 0.0% 0.0% 0.0 pt 0.0% 0.0% 0.0 pt VinFast *2 Total N/A N/A -% N/A N/A -% Share -% -% -% -% -% -% Others Total 1,213 1,748 -30.6% 6,456 8,778 -26.5% Share 0.1% 0.1% 0.0 pt 0.1% 0.1% 0.0 pt Grand Total *2 Total 1,469,774 1,479,342 -0.6% 6,538,572 6,862,440 -4.7% Share 100.0% 100.0% 0.0 pt 100.0% 100.0% 0.0 pt Source: Releases by each...
Automotive Sales Data Updated at: 2026/06/10
Data changes for Sales Statistics
Retroactively from 2021, MG's sales figures of E-mobility have been updated.There is no change in the total number of monthly sales. May 1, 2023 Japan The buses sales data for March 2023 have been updated. There is no change in the total of each vehicle type, including the total of buses nor the grand total. April 10, 2023 USA Sales figures of Mercedes in January - March 2022 have been updated. As a result, the total sales figure for the U.S...
Automotive Sales Data Updated at: 2026/06/08
USA - New car sales in 2025 by OEM, model, vehicle type
,163 -100.0% Share 0.0% 0.0% 0.0 pt 0.0% 0.0% 0.0 pt Karma *2 Total 0 0 -% 0 18 -100.0% Share 0.0% 0.0% 0.0 pt 0.0% 0.0% 0.0 pt VinFast *2 Total N/A N/A -% N/A N/A -% Share -% -% -% -% -% -% Others Total 1,570 2,532 -38.0% 19,683 21,520 -8.5% Share 0.1% 0.2% -0.1 pt 0.1% 0.1% 0.0 pt Grand Total *2 1,476,588 1,499,627 -1.5% 16,390,701 15,960,890 2.7% Source: Releases by each company, MarkLines Data Center *1 Includes Sprinter *2...
Automotive Sales Data Updated at: 2026/02/04
USA - Flash report, Automotive sales volume, 2022
0.0 pt 0.1% 0.0% 0.1 pt Lucid Motors *2 Total 463 369 25.5% 2,656 577 360.3% Share 0.0% 0.0% 0.0 pt 0.0% 0.0% 0.0 pt Karma *2 Total 3 10 -70.0% 185 99 86.9% Share 0.0% 0.0% 0.0 pt 0.0% 0.0% 0.0 pt Others Total 1,060 826 28.3% 10,820 9,511 13.8% Share 0.1% 0.1% 0.0 pt 0.1% 0.1% 0.0 pt Grand Total *2 1,287,280 1,221,230 5.4% 13,903,429 15,081,117 -7.8% Source: Releases by each company, MarkLines Data Center *1 Includes Sprinter *2...
Automotive Sales Data Updated at: 2025/06/04
USA - Flash report, Automotive sales volume, 2021
% -% -% Rivian *2 Total 252 - -% 584 - -% Share 0.0% -% -% 0.0% -% -% Lucid Motors *2 Total 369 - -% 577 - -% Share 0.0% -% -% 0.0% -% -% Karma *2 Total 10 - -% 99 - -% Share 0.0% -% -% 0.0% -% -% Others Total 826 743 11.2% 9,511 6,963 36.6% Share 0.1% 0.0% 0.0 pt 0.1% 0.0% 0.0 pt Grand Total *2 1,221,647 1,619,907 -24.6% 15,079,182 14,580,541 3.4% Source: Releases by each company, MarkLines Data Center *1 Includes Sprinter *...
Automotive Sales Data Updated at: 2025/06/04
USA - Flash report, Sales volume, 2020
re 0.2% 0.2% 0.0 pt 0.2% 0.2% 0.0 pt Jaguar *2 Total 1,119 3,311 -66.2% 17,976 31,051 -42.1% Share 0.1% 0.2% -0.1 pt 0.1% 0.2% -0.1 pt smart Total NA NA -% NA 680 -% Share -% -% -% -% 0.0% -% Others Total 1,252 1,481 -15.5% 12,177 16,724 -27.2% Share 0.1% 0.1% 0.0 pt 0.1% 0.1% 0.0 pt Grand Total *2 1,619,085 1,540,073 5.1% 14,577,371 17,061,082 -14.6% Source: Releases by each company, MarkLines Data Center *1 Includes Sprinter *...
Automotive Sales Data Updated at: 2025/06/04
China - Flash report, Sales volume, 2017
.00 39.21 -4.35 1,184.80 41.03 -2.48 MPV 22.83 7.46 -15.98 207.07 7.17 -17.05 SUV 117.30 38.33 8.40 1,025.27 35.50 13.32 Mini Van 5.18 1.69 -18.72 54.70 1.89 -19.97 Passenger Cars Total 265.33 86.70 -0.71 2,471.83 85.59 1.40 Commercial Vehicles Total 40.70 13.30 5.70 416.06 14.41 13.95 Grand Total 306.03 100.00 0.10 2,887.89 100.00 3.04 Source:CAAM, Each maker's press releases*Y-o-Y figures have been corrected. (Jan. 29, 2018) N...
Automotive Sales Data Updated at: 2018/07/24


 Japan
Japan USA
USA Mexico
 Germany
 China (Shanghai)
 Thailand
 India
India