


Search Results by Category
All information related to {{ key_word }}.
AI Navigator will guide you. Click here for information about {{ key_word }}.
Images
 4
4
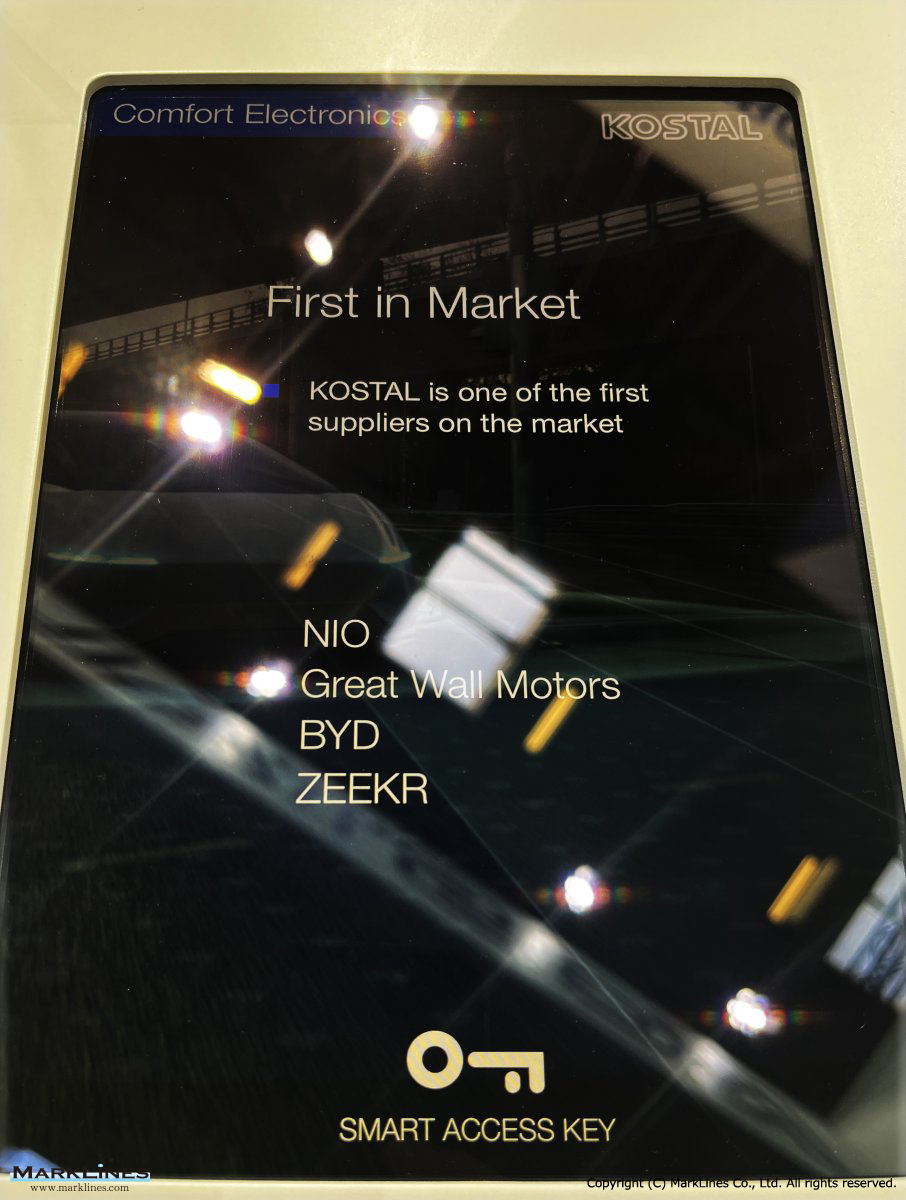
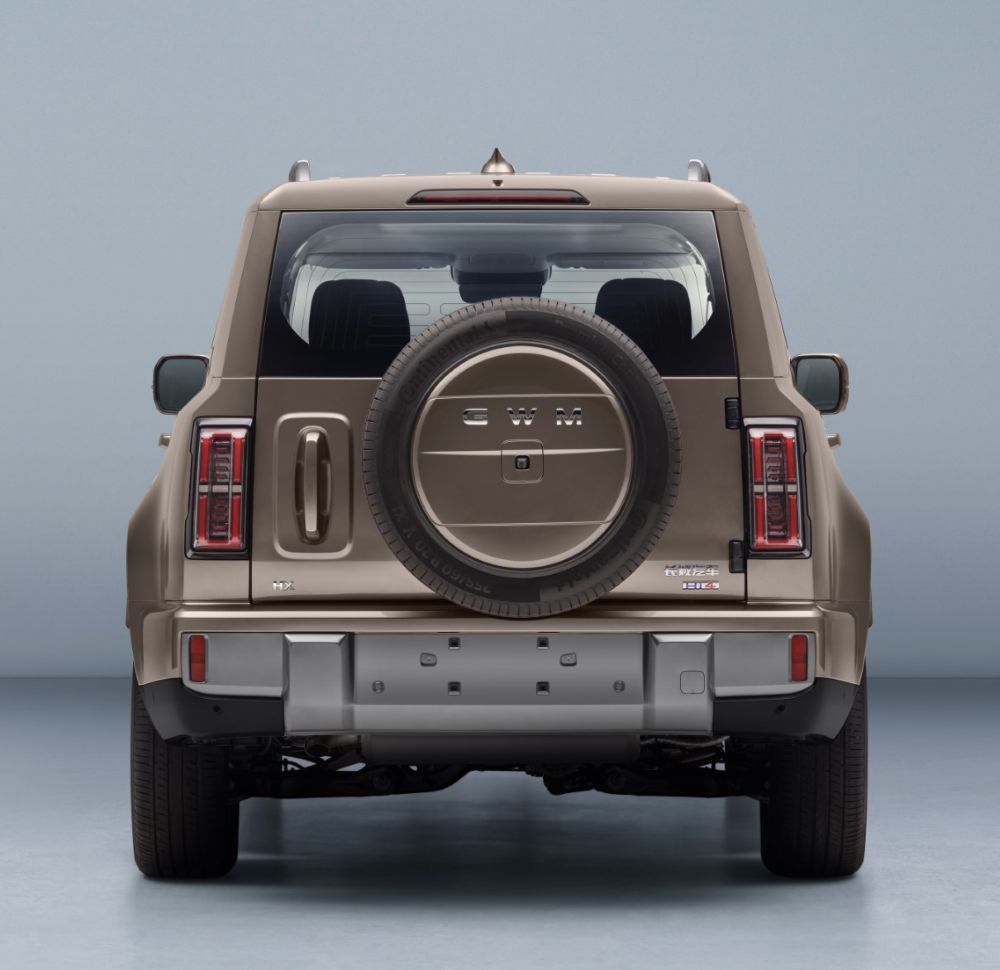
Smart access key
 4
4
GWM Haval launches Raptor Plus plug-in hybrid electric SUV
 7
7
[Exclusive Interview] AAPICO’s strategy vision and developments for EV in Thai market
 6
6
GWM WEY launches V9X plug-in hybrid electric SUV
 2
2
GWM Thailand officially begins ORA 5 production, targeting 5,000 initial deliveries from May 2026
 1
1
GWM to introduce ORA 5 SUV in Germany
 1
1
Astana Motors, Kazakhstan, to distribute GWM vehicles in Poland
 1
1
Astana Motors presents first Kazakhstan-produced GWM pickup trucks
 2
2
GWM Haval names new plug-in hybrid electric SUV “H10”
 1
1
Haval to launch updated F7x crossover coupe in Russia
Sort by :
1 - 20 of 23 results
UK - New car sales in 2026 by OEM, vehicle type
1,032 0.1% -24.5% Abarth 69 0.0% 25 0.0% 176.0% 198 0.0% 184 0.0% 7.6% KGM 63 0.0% 101 0.1% -37.6% 734 0.1% 686 0.1% 7.0% Maserati 55 0.0% 24 0.0% 129.2% 191 0.0% 138 0.0% 38.4% GAC Aion 31 0.0% 0 0.0% -% 31 0.0% 0 0.0% -% INEOS Automotive 16 0.0% 29 0.0% -44.8% 117 0.0% 106 0.0% 10.4% GWM 12 0.0% 33 0.0% -63.6% 137 0.0% 157 0.0% -12.7% Mitsubishi 12 0.0% 0 0.0% -% 12 0.0% 0 0.0% -% DS 9 0.0% 141 0.1% -93.6% 68 0.0% 371 0.0% -81....
Automotive Sales Data Updated at: 2026/06/05
Mexico - New car sales in 2026 by OEM, vehicle type
14,196 2.3% 16,651 2.8% -14.7% Mitsubishi 2,453 1.9% 2,630 2.2% -6.7% 12,794 2.0% 11,368 1.9% 12.5% Changan 1,972 1.6% 1,546 1.3% 27.6% 9,317 1.5% 5,623 0.9% 65.7% JAC 1,800 1.4% 1,950 1.6% -7.7% 9,467 1.5% 10,026 1.7% -5.6% BMW *1 1,478 1.2% 1,647 1.4% -10.3% 7,006 1.1% 7,537 1.3% -7.0% GWM *5 1,046 0.8% 1,096 0.9% -4.6% 5,460 0.9% 6,126 1.0% -10.9% Mercedes-Benz 716 0.6% 730 0.6% -1.9% 3,513 0.6% 4,631 0.8% -24.1% JETOUR 550 0.4%...
Automotive Sales Data Updated at: 2026/06/05
Indonesia - New car sales in 2026 by OEM
.3% 658 0.3% 37.8% VinFast 392 0.5% 1,161 2.2% -66.2% 1,093 0.4% 1,474 0.6% -25.8% Mazda 277 0.3% 195 0.4% 42.1% 1,075 0.4% 862 0.3% 24.7% JETOUR 275 0.3% 20 0.0% 1275.0% 947 0.3% 166 0.1% 470.5% BMW 264 0.3% 77 0.1% 242.9% 830 0.3% 466 0.2% 78.1% XPeng 260 0.3% - -% -% 853 0.3% - -% -% GWM 248 0.3% 35 0.1% 608.6% 1,127 0.4% 368 0.1% 206.3% DFSK 124 0.2% 63 0.1% 96.8% 366 0.1% 329 0.1% 11.2% Citroen 123 0.2% 90 0.2% 36.7% 414 0.1%...
Automotive Sales Data Updated at: 2026/05/13
Australia - New car sales in 2026 by OEM, vehicle type
3 6.7% 11,974 3.1% 110.8% 3 Kia 6,450 7.0% 6,303 7.0% 2.3% 27,080 7.2% 26,037 6.8% 4.0% 4 Hyundai 6,002 6.5% 5,547 6.1% 8.2% 25,103 6.7% 23,833 6.3% 5.3% 5 Ford 5,748 6.2% 7,334 8.1% -21.6% 25,920 6.9% 28,733 7.5% -9.8% 6 Mazda 5,636 6.1% 6,573 7.3% -14.3% 27,526 7.3% 31,692 8.3% -13.1% 7 GWM 4,717 5.1% 3,874 4.3% 21.8% 19,595 5.2% 15,453 4.1% 26.8% 8 Chery 4,322 4.7% 2,287 2.5% 89.0% 16,058 4.3% 8,344 2.2% 92.4% 9 MG 3,678 4.0% 3,1...
Automotive Sales Data Updated at: 2026/05/07
Thailand - New car sales in 2025 by OEM, model, vehicle type
73,465 11.8% 85,582 14.9% -14.2% BYD 2,914 3.9% 1,491 2.8% 95.4% 39,856 6.4% 27,021 4.7% 47.5% MG 4,503 6.0% 1,737 3.2% 159.2% 27,007 4.3% 17,239 3.0% 56.7% Mitsubishi 2,512 3.3% 2,678 5.0% -6.2% 26,369 4.2% 27,318 4.8% -3.5% Ford 1,729 2.3% 1,842 3.4% -6.1% 18,271 2.9% 20,893 3.6% -12.5% GWM 3,182 4.2% 871 1.6% 265.3% 18,058 2.9% 7,364 1.3% 145.2% Changan 3,699 4.9% 1,127 2.1% 228.2% 14,964 2.4% 8,549 1.5% 75.0% GAC 1,668 2.2% 398 ...
Automotive Sales Data Updated at: 2026/02/24
Indonesia - New car sales in 2025 by OEM
7,474 0.9% -% Aion 1,674 1.8% 1892.9% 6,839 0.9% 451.5% Mazda 279 0.3% 4.9% 3,080 0.4% -29.6% Jaecoo 1,163 1.2% -% 2,653 0.3% -% Geely 404 0.4% -% 2,406 0.3% -% Mercedes Benz 255 0.3% -33.9% 2,344 0.3% -37.6% MG 259 0.3% 102.3% 2,018 0.3% -49.2% BMW 308 0.3% -44.2% 1,922 0.2% -58.9% GWM 178 0.2% 85.4% 1,628 0.2% 104.5% UD Trucks 101 0.1% -16.5% 1,627 0.2% -17.0% Citroen 368 0.4% 206.7% 1,577 0.2% 19.1% Lexus 81 0.1% -48.1% 1...
Automotive Sales Data Updated at: 2026/02/12
Mexico - New car sales in 2025 by OEM, vehicle type
8 1.5% 2,160 1.5% 7.8% 27,994 1.8% 24,706 1.6% 13.3% JAC 2,205 1.4% 2,525 1.7% -12.7% 24,445 1.6% 24,826 1.7% -1.5% Geely 3,535 2.3% 859 0.6% 311.5% 22,258 1.5% 6,596 0.4% 237.4% Changan 1,773 1.1% - -% -% 19,308 1.3% - -% -% BMW *1 1,767 1.1% 1,587 1.1% 11.3% 18,953 1.2% 17,335 1.2% 9.3% GWM *5 1,379 0.9% 1,253 0.9% 10.1% 15,336 1.0% 14,455 1.0% 6.1% Mercedes-Benz 955 0.6% 1,227 0.8% -22.2% 10,663 0.7% 12,905 0.9% -17.4% Volvo 453 ...
Automotive Sales Data Updated at: 2026/02/06
UK - New car sales in 2025 by OEM, vehicle type
.1% 16,617 0.9% -89.6% KGM 69 0.0% 67 0.0% 3.0% 1,574 0.1% 1,617 0.1% -2.7% Genesis 68 0.0% 111 0.1% -38.7% 1,225 0.1% 1,210 0.1% 1.2% DS 12 0.0% 27 0.0% -55.6% 1,015 0.1% 1,152 0.1% -11.9% Bentley 54 0.0% 68 0.0% -20.6% 993 0.0% 919 0.0% 8.1% XPeng 150 0.1% 0 0.0% -% 900 0.0% 0 0.0% -% GWM 73 0.0% 18 0.0% 305.6% 542 0.0% 1,162 0.1% -53.4% Geely 125 0.1% 0 0.0% -% 478 0.0% 0 0.0% -% Maserati 52 0.0% 28 0.0% 85.7% 372 0.0% 469 0.0%...
Automotive Sales Data Updated at: 2026/02/06
Australia - New car sales in 2025 by OEM, vehicle type
da sales increased 4.2% to 7,562 units, Kia sales decreased 3.2% to 6,101 units and Hyundai sales increased 12.2% to 5,640 units. In 2025, the top three manufacturers, Toyota, Ford, and Mazda, saw decreases of 0.6%, 5.8%, and 4.2% respectively compared to the previous year, while Great Wall Motors (GWM) ranked 7th and BYD ranked 8th saw significant increases of 23.4% and 156.2%, respectively.FCAI Chief Executive Tony Weber said that many consumer...
Automotive Sales Data Updated at: 2026/02/04
Sweden - New car sales in 2025 by OEM
% 308 0.2% 17.9% Honda 73 0.4% 39 0.2% 87.2% 546 0.3% 744 0.5% -26.6% SEAT 68 0.4% 149 0.9% -54.4% 994 0.6% 1,764 1.2% -43.7% BYD 68 0.4% 79 0.5% -13.9% 540 0.3% 578 0.4% -6.6% Xpeng 43 0.2% 47 0.3% -8.5% 522 0.3% 298 0.2% 75.2% Mitsubishi 39 0.2% 15 0.1% 160.0% 214 0.1% 343 0.2% -37.6% GWM 35 0.2% 8 0.0% 337.5% 35 0.0% 76 0.1% -53.9% NIO 15 0.1% 17 0.1% -11.8% 32 0.0% 85 0.1% -62.4% Others 87 0.5% 381 2.3% -77.2% 3,407 2.1% 3,043...
Automotive Sales Data Updated at: 2026/02/02
Thailand - New car sales in 2024 by OEM, model, vehicle type
139 4.4% 31.2% 18,134 8.1% 15,430 5.3% 17.5% MG 1,239 6.0% 1,742 6.7% -28.9% 12,739 5.7% 19,049 6.5% -33.1% Mazda 476 2.3% 554 2.1% -14.1% 5,173 2.3% 8,728 3.0% -40.7% Neta 0 0.0% 1,779 6.8% -100.0% 4,844 2.2% 13,836 4.7% -65.0% Suzuki 262 1.3% 778 3.0% -66.3% 4,814 2.1% 9,668 3.3% -50.2% GWM 484 2.3% 343 1.3% 41.1% 3,709 1.7% 6,046 2.1% -38.7% Nissan 295 1.4% 425 1.6% -30.6% 3,606 1.6% 6,153 2.1% -41.4% Changan 325 1.6% - -% -% 1,6...
Automotive Sales Data Updated at: 2025/07/03
Mexico - New car sales in 2024 by OEM, vehicle type
an increase of 11.7% from the previous year.Hyundai sales increased 7.1% to 53,305 units in 2024 while Ford Motor sold 52,359 units, an increase of 9.2% from last year.Chery and Omoda brands sales decreased 30.2% to 26,843 units, while JAC sold 24,826 units, an increase of 17.8% from the last year.GWM sold 14,455 units, an increase if of 2,090.2% from the previous year.Motornation sold 10,497 units of BAIC, Changan, JMC, DFSK and SERES vehicles,...
Automotive Sales Data Updated at: 2025/07/03
Ireland - New car sales in 2024 by OEM, vehicle type
153 0.6% -44.4% PORSCHE 82 0.3% 152 0.6% -46.1% FIAT 76 0.2% 68 0.2% 11.8% TESLA 66 0.2% 1 0.0% 6500.0% JEEP 40 0.1% 21 0.1% 90.5% DS 39 0.1% 61 0.2% -36.1% HONDA 33 0.1% 50 0.2% -34.0% POLESTAR 31 0.1% 36 0.1% -13.9% ALFA ROMEO 23 0.1% 23 0.1% 0.0% JAGUAR 17 0.1% 23 0.1% -26.1% GWM 11 0.0% 0 0.0% -% OTHERS 16 0.1% 10 0.0% 60.0% TOTAL 31,470 100.0% 27,337 100.0% 15.1% Registrations of new light commercial vehicles Ma...
Automotive Sales Data Updated at: 2025/07/02
Australia - New car sales in 2024 by OEM, vehicle type
63,511 5.2% 17.4% 6 Hyundai 5,025 5.2% 4,887 5.0% 2.8% 71,664 5.9% 75,183 6.2% -4.7% 7 MG 4,218 4.4% 3,834 3.9% 10.0% 50,592 4.1% 58,346 4.8% -13.3% 8 Isuzu Ute 3,558 3.7% 3,987 4.0% -10.8% 48,172 3.9% 45,341 3.7% 6.2% 9 Nissan 4,224 4.4% 2,658 2.7% 58.9% 45,284 3.7% 39,376 3.2% 15.0% 10 GWM 4,073 4.2% 3,862 3.9% 5.5% 42,782 3.5% 36,397 3.0% 17.5% Others 28,523 29.7% 32,727 33.2% -12.8% 368,326 30.2% 419,458 34.5% -12.2% Total 95...
Automotive Sales Data Updated at: 2025/07/02
Thailand - Flash report, Automotive sales volume, 2023
a 1,779 6.8% 1,019 4.1% 74.6% 13,836 4.7% 1,019 0.4% 1257.8% BYD 3,334 12.8% - -% -% 11,219 3.8% - -% -% Suzuki 778 3.0% 1,476 6.0% -47.3% 9,668 3.3% 16,721 6.3% -42.2% Mazda 554 2.1% 523 2.1% 5.9% 8,728 3.0% 17,810 6.7% -51.0% Nissan 425 1.6% 631 2.6% -32.6% 6,153 2.1% 10,933 4.1% -43.7% GWM 343 1.3% 581 2.4% -41.0% 6,046 2.1% 4,326 1.6% 39.8% Hyundai 210 0.8% 0 0.0% -% 1,521 0.5% 0 0.0% -% Porsche 141 0.5% 133 0.5% 6.0% 1,445 0.5%...
Automotive Sales Data Updated at: 2025/06/04
Thailand - Flash report, Automotive sales volume, 2022
6% 21,157 8.0% 18,456 7.3% 14.6% Mazda 523 2.1% 1,197 3.8% -56.3% 17,810 6.7% 19,800 7.9% -10.1% Suzuki 1,476 6.0% 2,776 8.7% -46.8% 16,721 6.3% 19,486 7.7% -14.2% MG 1,569 6.4% 1,615 5.1% -2.8% 14,183 5.4% 10,389 4.1% 36.5% Nissan 631 2.6% 2,171 6.8% -70.9% 10,933 4.1% 19,790 7.9% -44.8% GWM 581 2.4% 296 0.9% 96.3% 4,326 1.6% 462 0.2% 836.4% KIA 256 1.0% 275 0.9% -6.9% 1,447 0.5% 1,573 0.6% -8.0% Porsche 133 0.5% 108 0.3% 23.1% 1,0...
Automotive Sales Data Updated at: 2025/06/04
Australia - Flash report, Automotive sales volume, 2022
2,075 6.4% 16.1% 6 Hyundai 5,519 5.8% 6,854 8.5% -19.5% 68,911 6.9% 67,138 6.9% 2.6% 7 MG 5,497 5.8% 3,743 4.6% 46.9% 44,388 4.5% 35,757 3.7% 24.1% 8 Subaru 3,701 3.9% 2,712 3.4% 36.5% 31,965 3.2% 34,211 3.5% -6.6% 9 Volkswagen 3,045 3.2% 3,098 3.8% -1.7% 27,887 2.8% 38,325 3.9% -27.2% 10 GWM 2,914 3.1% 1,972 2.4% 47.8% 21,747 2.2% 16,864 1.7% 29.0% Others 27,904 29.3% 24,876 30.8% 12.2% 291,390 29.3% 286,583 29.5% 1.7% Total 95,0...
Automotive Sales Data Updated at: 2025/06/04
Thailand - Flash report, Automotive sales volume, 2021
.2% 20,616 4.1% 23,350 4.5% -11.7% Mazda 2,553 4.3% 1,778 2.7% 43.6% 15,584 3.1% 14,427 2.8% 8.0% Hino 1,458 2.5% 1,435 2.2% 1.6% 13,840 2.7% 10,309 2.0% 34.3% Honda 2,793 4.7% 1,697 2.6% 64.6% 11,806 2.3% 15,622 3.0% -24.4% Nissan 1,421 2.4% 1,207 1.8% 17.7% 9,906 2.0% 17,438 3.4% -43.2% GWM 1,170 2.0% 0 0.0% -% 3,240 0.6% 0 0.0% -% Hyundai 667 1.1% 379 0.6% 76.0% 3,094 0.6% 2,976 0.6% 4.0% Subaru 371 0.6% 457 0.7% -18.8% 2,934 0.6...
Automotive Sales Data Updated at: 2025/06/04
Israel - Flash report, Sales volume, 2016
0% 92 0.0% 54 0.0% 70.4% Maserati 0 0.0% 53 0.0% 37 0.0% 43.2% Abarth 1 0.0% 49 0.0% 46 0.0% 6.5% DS 0 0.0% 30 0.0% 0 0.0% -% Aston Martin 0 0.0% 13 0.0% 0 0.0% -% Dodge 0 0.0% 12 0.0% 23 0.0% -47.8% Ferrari 0 0.0% 9 0.0% 4 0.0% 125.0% Iveco 0 0.0% 1 0.0% 0 0.0% -% Great Wall Motor (GWM) 0 0.0% 0 0.0% 5 0.0% -100.0% Lancia 0 0.0% 0 0.0% 2 0.0% -100.0% Total 7,030 100.0% 286,728 100.0% 254,748 100.0% 12.6% * Data of Chrysler...
Automotive Sales Data Updated at: 2017/01/06
South Africa - Flash report, Sales volume, 2013
143 0.4% Fiat 134 0.4% Tata 111 0.3% Mahindra 110 0.3% Lexus 107 0.3% Subaru 103 0.3% Citroen 82 0.3% Jaguar 71 0.2% Chrysler 53 0.2% Alfa Romeo 10 0.0% Ssangyong 10 0.0% Ferrari 7 0.0% Infiniti 7 0.0% Maserati 6 0.0% smart 3 0.0% Abarth 2 0.0% AMH & AAD * 4,897 - GWMSA ** 103 - Dec. 2013 Total 32,747 - Dec. 2012 Total 33,028 - Y-o-Y -0.9% - Sales of new light commercial vehicles Maker/Brand Dec. 20...
Automotive Sales Data Updated at: 2016/05/02


_2.jpg)


_2_thumbnail.jpg)


 Japan
Japan USA
USA Mexico
 Germany
 China (Shanghai)
 Thailand
 India
India