
 AI Navigator


Search Results by Category
 AI Navigator
All information related to {{ key_word }}.
AI Navigation will guide you. Click here for information about {{ key_word }}.
Images
 1
1
Ford, TXU Energy team up to offer free EV charging to Texas customers
 1
1
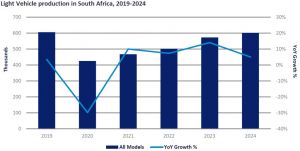
GlobalData blog: Is South Africa ready to embrace electric vehicle production?
Sort by :
1 - 12 of 12 results
USA - New car sales in 2025 by OEM, model, vehicle type
ed results in November: GM fell 10.6% y/y, Ford slipped 0.6% y/y, and Stellantis rose 7.8% y/y. Ford was hit by reduced output of the F-Series after the Novelis plant fire disrupted aluminum-panel supplies (F-Series sales dropped 9.6%). Ford’s EV sales plunged 60.8% y/y to 4,247 units, with the F-150 Lightning down 72.4% to 1,006 units. Hybrids, however, rose 13.6% to 16,301 units. Tesla volume dropped 30.7%, marking a second consecutive steep ...
Automotive Sales Data Updated at: 2025/12/23
Philippines - New car sales in 2025 by vehicle type
nger car sales declined 23.3% to 84,917 units, while commercial vehicle sales increased 6.8% to 335,859 units. Electrified vehicle sales over the 11-month period reached 28,102 units, including 22,027 HEVs, 4,261 BEVs, and 1,814 PHEVs.Toyota Motor Philippines led the market, followed by Mitsubishi, Ford, Suzuki, and Nissan.For CAMPI, the November slowdown has not dampened its outlook for the industry’s year-end performance, as vehicle demand us...
Automotive Sales Data Updated at: 2025/12/22
USA - Flash report, Automotive sales volume, 2023
ikesU.S. new vehicle sales of 1,211,141 units for the month of October represented a decrease of 9.6% from September 2023, and an increase of 2.0% from one year ago in October 2022, as production and logistics became difficult in the U.S. with some plants closed due to UAW labor strikes against GM, Ford, and Stellantis.There were 25 selling days in October 2023, one less than the 26 selling days in October 2022.October’s passenger car sales dec...
Automotive Sales Data Updated at: 2025/06/04
Philippines - Flash report, Automotive sales volume, 2021
in the January to November 2020. As of November 2021, passenger car sales climbed 26.2% YoY to 76,813 units while commercial vehicle sales rose 21% to 163,829 units. Toyota maintained its leadership in the market with a 48.27% share of total sales as of end-November, followed by Mitsubishi Motors, Ford, Suzuki, and Nissan, which held a share of 13.91%, 7.54%, 7.30%, and a 7.22% share, respectively.Already surpassing 2020 sales renewed hope that ...
Automotive Sales Data Updated at: 2025/06/04
Canada - Flash report, Sales volume, 2020
/2020 decreased 44.7% from the same quarter in 2019, to 314,496 units due to coronavirus.SUV and pickup sales, at 247,177 units, were down 39.9% in the second quarter of 2020, while passenger car sales, at 67,319 units, were down 57.1% compared to the same period of 2019.In the second quarter 2020, Ford, General Motors, and FCA estimated sales decreased 44.8%, 35.5%, and 46.8%, respectively.Among German companies’ sales, VW brand sales were dow...
Automotive Sales Data Updated at: 2025/06/04
India - Flash report, Sales volume, 2020
van) sales were down 17.0% to 726,232 units (excudes BMW, Mercedes-Benz and Volvo Cars). CVs (M&HCVs and LCVs) sales were down 20.1% to 133,524 units (excludes Daimler and Scania).Based on the release of carmakers in September PVs and CVs, the available results are as follows:Maruti-Suzuki sales of 150,040 units increased 33.4% in September compared to the same month in 2019.Hyundai sales of 50,313 units increased 23.6% from last year.Tata sales ...
Automotive Sales Data Updated at: 2025/06/04
USA - Flash report, Sales volume, 2019
1,014 4.4% Share 2.3% 2.1% 0.2 pt 1.9% 1.8% 0.1 pt Mazda Total 26,491 25,870 2.4% 278,552 300,325 -7.2% Share 1.7% 1.6% 0.1 pt 1.6% 1.7% -0.1 pt Audi Total 25,850 22,765 13.6% 224,111 223,323 0.4% Share 1.7% 1.4% 0.3 pt 1.3% 1.3% 0.0 pt Tesla (Est.) Total 23,300 20,100 15.9% 178,950 126,150 41.9% Share 1.5% 1.2% 0.3 pt 1.0% 0.7% 0.3 pt Mitsubishi Total 9,915 8,986 10.3% 121,046 118,074 2.5% Share 0.6% 0.6% 0.1 pt 0.7% 0.7% 0.0 p...
Automotive Sales Data Updated at: 2020/01/21
USA - Flash report, Sales volume, 2018
14 305,685 1.7% Share 2.1% 2.1% 0.0 pt 1.8% 1.8% 0.0 pt Mazda Total 25,870 26,893 -3.8% 300,325 289,470 3.7% Share 1.6% 1.7% -0.1 pt 1.7% 1.7% 0.1 pt Audi Total 22,765 26,977 -15.6% 223,323 226,511 -1.4% Share 1.4% 1.7% -0.3 pt 1.3% 1.3% 0.0 pt Tesla (Est.) Total 20,100 3,540 467.8% 126,150 43,860 187.6% Share 1.2% 0.2% 1.0 pt 0.7% 0.3% 0.5 pt Mitsubishi Total 8,986 8,501 5.7% 118,074 103,686 13.9% Share 0.6% 0.5% 0.0 pt 0.7% 0....
Automotive Sales Data Updated at: 2019/01/28
Canada - Flash report, Sales volume, 2018
0.9% 183,457 15.1% 187,938 15.4% -2.4% General Motors 25,226 14.4% 25,852 14.2% -2.4% 180,163 14.9% 176,348 14.4% 2.2% Toyota 16,864 9.6% 16,943 9.3% -0.5% 121,423 10.0% 119,062 9.8% 2.0% Honda 16,693 9.5% 16,843 9.3% -0.9% 107,526 8.9% 106,981 8.8% 0.5% FCA 15,652 8.9% 23,467 12.9% -33.3% 150,463 12.4% 175,041 14.3% -14.0% Hyundai 13,567 7.7% 12,443 6.8% 9.0% 74,847 6.2% 79,322 6.5% -5.6% Nissan 11,593 6.6% 11,807 6.5% -1.8% 82,204 ...
Automotive Sales Data Updated at: 2019/01/07
USA - Flash report, Sales volume, 2017
rcedes * Total 31,401 31,383 0.1% 298,878 305,743 -2.2% Share 2.3% 2.3% 0.0 pt 2.1% 2.1% 0.0 pt VW Total 27,732 24,779 11.9% 280,188 256,047 9.4% Share 2.0% 1.8% 0.2 pt 2.0% 1.8% 0.2 pt BMW (Est.) Total 23,200 24,017 -3.4% 243,375 254,150 -4.2% Share 1.7% 1.8% 0.0 pt 1.7% 1.8% 0.0 pt Mazda Total 20,811 22,711 -8.4% 241,108 246,978 -2.4% Share 1.5% ...
Automotive Sales Data Updated at: 2018/07/24
Canada - Flash report, Sales volume, 2017
up 5.0% from the same period in 2016, with passenger car sales down 2.8% and SUV and pickup sales up 9.1%.Combined sales in November for the Detroit Big 3 were down 9.8% to 66,441 units, while sales of all foreign nameplates combined were up 6.1% to 92,212 units.Of the Big Three manufacturers, GM, Ford, and FCA were down 17.2%, 2.8%, and 7.8%, respectively, from last November.Among Japanese automakers, Toyota, Nissan, Honda, and Subaru sales in ...
Automotive Sales Data Updated at: 2018/07/24
USA - Flash report, Sales volume, 2016
99,211 2,603,082 -0.1% Share 14.1% 14.5% -0.4% 14.8% 14.9% -0.1% Toyota Total 243,229 238,350 2.0% 2,449,587 2,499,313 -2.0% Share 14.4% 14.5% -0.1% 14.0% 14.3% -0.3% FCA Total 192,519 213,924 -10.0% 2,244,315 2,252,877 -0.4% Share 11.4% 13.0% -1.7% 12.8% 12.9% -0.1% Honda Total 160,477 150,893 6.4% 1,637,942 1,586,551 3.2% Share 9.5% 9.2% 0.3% 9.3% 9.1% 0.3% Nissan Total 152,743 139,300 9.7% 1,564,423 1,484,918 5.4% Share 9.0% ...
Automotive Sales Data Updated at: 2017/01/05


 Japan
Japan USA
USA Mexico
 Germany
 China (Shanghai)
 Thailand
 India
India